Micromechanical Photonics - H. Ukita Part 6 pot
Bạn đang xem bản rút gọn của tài liệu. Xem và tải ngay bản đầy đủ của tài liệu tại đây (1.03 MB, 20 trang )
3.2 Theoretical Analysis 91
(b)
w
F
g
Fs
-1
1
O
Z
f
r
f(r)
f(r)
n
q1(r)
s
(a)
r
f(r)
F
m
b
b
Z
Y
f
O
w
w'
X
Y
Z
R
m
R
m
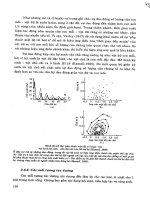
Fig. 3.11. Geometry for calculating axial trapping efficiency of polystyrene mi-
croshere. The laser focus is on the optical axis which is parallel to the center line of
the microsphere [3.4]
(a)
X
Y
Z
r
gb
g
a
b
O
Y
Z
1
-1
f
W
W'
q
1
q
1
F
m
R
m
Fs
Fg
R
m
R
m
cotF
m
n
A
(b)
W
O
f '
n
A
s'
R
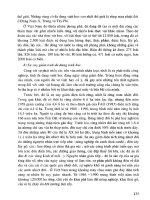
Fig. 3.12. Geometry for calculating the transverse trapping efficiency of polystyrene
microshere. The laser focus is located along the transverse center line of the sphere
[3.4]
Z
0.2 0.40
Trapping efficiency
-0.4 -0.2
Focus point
(a) (b)
0 0.2 0.4 0.6 0.8
1.0
0.1
0.2
0.3
0.4
0
Y
Trapping efficiency
Focus point
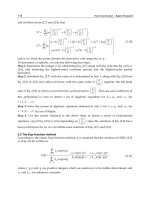
Fig. 3.13. Total trapping efficiency Q
t
exerted on a polystyrene microsphere sus-
pended in water by trap with a uniformly filled input aperture of NA = 1.25 for
axial (a), and for transversal (b) directions
92 3 Optical Tweezers
Table 3.4. Maximum trapping efficiency for axial trap with various laser beam
profiles
beam profile downward directed upward directed
Gaussian (TEM
00
) 0.21 0.33
uniform 0.25 0.39
donut (TEM
01
∗
) 0.26 0.41
the upward directed beam is more effective in trapping the microsphere than
the downward-directed beam. Table 3.3 shows microsphere materials for the
analysis in this book.
The trapping efficiency dependence on the incident angle of a ray means
that trapping efficiency is related to the profile of the laser beam. Table 3.4
shows the maximum trapping efficiency calculated for input beams with
various mode intensity profiles: Gaussian, uniformly filled, and donut. The
maximum Q increases as the outer part intensity increases. Good trapping is
possible when the outer part of the aperture is filled by a high intensity to
give a laser beam with a high convergence angle.
Example 3.4. Calculate the axial trapping efficiency for a microsphere when
the focus of the uniformly input laser beam is along the optical axis in the
center line of the sphere.
Solution. First, we find the incident angle θ
1
(r, β)ofarayenteringthein-
put aperture of the objective lens at the arbitrary point (r, β), as shown in
Fig. 3.11a [3.4]. Since axial trapping efficiency is independent on β due to axial
symmetry, we consider r-dependence for the θ
1
(r, β). The angle φ(r) between
the incidence ray and z-axis is r
0
sin θ
1
(r)=s sin φ(r) where r
0
is the radius
of the microsphere (we take r
0
= 1 since the results in the ray optics model
are independent on r), s is the distance between the center of the microsphere
and the laser focus. From Fig. 3.11b,
φ(r) = tan
−1
r
R
m
tan Φ
m
,
where R
m
is the lens radius and Φ
m
is the maximum convergence angle. Then
the incident angle θ
1
(r) becomes
θ
1
(r)=sin
−1
sr tan Φ
m
R
m
1+
r tan Φ
m
R
m
2
.
Next, the trapping efficiencies Q
s
(r)andQ
g
(r) are computed by the vector
sum of the contributions of all rays within the convergence angle using (3.5)
and (3.6). Here, the y-component is cancelled out due to the symmetry, only
the z-component is calculated as
Q
sz
(r)=Q
s
(r)cosφ(r),
Q
gz
(r)=Q
g
(r) sin φ(r).
3.2 Theoretical Analysis 93
Finally, Q
s
and Q
g
are obtained by integrating all the rays using
Q
s
=
1
πR
2
m
2π
0
R
m
0
rQ
sz
(r)drdβ =
2
R
2
m
R
m
0
rQ
sz
(r)dr,
Q
g
=
1
πR
2
m
2π
0
R
m
0
rQ
gz
(r)drdβ =
2
R
2
m
R
m
0
rQ
gz
(r)dr.
The total trapping efficiency is given by Q
t
=
Q
2
s
+ Q
2
g
.
3.2.3 Effect of Beam Waist
In the ray optics, a laser beam is decomposed into individual rays with appro-
priate intensity, direction and polarization, which propagate in straight lines.
In actual conditions, the focused light beam has a beam waist, which means
that each ray varies its direction near the focus. Therefore, the incident angle
θ
1
varies from that of the straight line, leading to the recalculation of the
exact optical pressure force.
We introduce a Gaussian beam profile (3.9) of a beam waist ω
0
and the
depth of focus Z
0
instead of straight line ray optics as
ω
0
=
λ
2NA
,Z
0
= kω
2
0
, (3.9)
where k is the wave number 2π/λ, λ is the wavelength, and NA is the numer-
ical aperture of the objective.
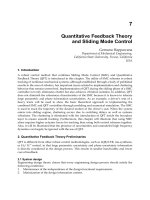
To determine the incident angle θ
1
(r) of a Gaussian ray passing at r = r in
the aperture of the objective enters at the point (α, β) on the sphere surface
as shown in Fig. 3.14. The coordinates (α, β) are expressed
α =
2sZ
2
0
−
4s
2
Z
2
0
− 4Z
2
0
s
2
− r
2
0
+
r
R
m
2
ω
2
0
Z
2
0
+
r
R
m
2
ω
2
0
2
Z
2
0
+
r
R
m
2
ω
2
0
,
(3.10)
β =
r
2
0
− (s −α)
2
. (3.11)
Then the incident angle θ
1
(r) is calculated as the angle between the tan-
gent vector a of the Gaussian ray at (α, β) and the direction vector b pointing
to the center of the sphere. After the incident angle θ
1
(r) is defined, the trap-
ping efficiency along the optical axis can be computed. Figure 3.15 show the
result for a polystyrene sphere suspended in water. Considering the beam
94 3 Optical Tweezers
y
Focus point
0
-1
1
S
o
Z
(ab)
Fig. 3.14. Geometry for calculating exact axial trapping efficiency for microsphere
considering beam waist
s
0
0.05
0.1
0.15
0.2
0.25
0.3
0.35
0.4
0.45
0.5
0 0.4 0.60.2 0.8 1
Normalized distance between particle center and focus point
Trapping efficiency
Ray optics
Diameter
20
mm
10
5
2
1
Beam waist
Fig. 3.15. Axial trapping efficiency of polystyrene microsphere suspended in water
by converging ray approximations of straight line (ray optics) and parabolic line
(beam waist) with beam waist ω
0
waist, it is seen from the figure that the axial trapping efficiency decreases to
50% that of the straight lines. This is caused by the fact that focused rays are
almost parallel to the optical axis near the focus, as shown in the upper left
sketch in the figure.
Figure 3.16 shows the transverse trapping efficiency along the axis perpen-
dicular to the optical axis. It is seen from the figure that both straight and
parabolic Gaussian beam rays have almost the same numerical results. This
is based on the fact that the incident angles at the surface of the sphere are
almost the same for both approximations because the laser focus is located
near the surface edge, maximum trapping efficiency, on the center line of the
sphere (see the upper left sketch in the figure).
Example 3.5. Compute the trapping efficiency of a microsphere suspended in
water along the propagation axis by the laser beam emitted from the tapered
3.2 Theoretical Analysis 95
Normarized distance between microsphere center and focus point
Trapping efficiency
Diameter
40 mm
10
2
20
4
Ray optics
Beam waist
0.40
0.35
0.30
0.25
0.20
0.15
0.10
0.05
0
0 0.2 0.4 0.6 0.8 1.0
s
Fig. 3.16. Transverse trapping efficiency of polystyrene microsphere by two con-
verging ray approximations
d
2
d
1
w
1
w
2
n
2
n
1
R
r(z)
Fig. 3.17. Geometry for calculating trapping efficiency for microsphere along prop-
agation axis by laser beam emitted from tapered lensed optical fiber
lensed optical fiber of curvature R =10µm, beam waist radius ω
1
=5.0 µm,
core refractive index n
1
=1.462, as shown in Fig. 3.17. The focus distance
from the tapered lensed fiber end d
2
and the beam radius r(z) with the beam
waist ω
2
are given as
d
2
= −
n
2
R(n
2
− n
1
)
(n
2
− n
1
)
2
+ R
2
λ
πω
2
1
2
,r(z)=ω
2
1+
z
kω
2
2
2
.
Solution. An equation of a ray going along the z-direction is expressed by
the variable parameter t(0 ≤ t ≤ 1) as
y = tω
2
1+
z
Z
0
2
,Z
0
= kω
2
2
,
where t = r/R
m
and
ω
2
=
ω
1
πω
2
1
λ
2
n
2
−n
1
n
1
R
2
+1
.
96 3 Optical Tweezers
The equation of the microsphere located on the z-axisis(z −s)
2
+ y
2
= r
2
0
where r
0
is the radius of the microsphere and s is the distance between the
center of the microsphere and the beam waist. From the two equations given
carlier, the intersection point α between the ray and the sphere surface is
α =
2sZ
2
0
−
4s
2
Z
2
0
− 4Z
2
0
(s
2
− r
2
0
+ t
2
ω
2
2
)(Z
2
0
+ t
2
ω
2
2
)
2(Z
2
0
+ t
2
ω
2
2
)
.
According to the Pythagoras theorem
β =
r
2
0
− (s −α)
2
.
The incident angle θ
1
of a Gaussian ray entering the sphere at the inter-
section point (α, β) is the angle between the tangential vector a of the ray
and the vector b pointing from the point (α, β) to the center of the sphere is
θ
1
= arccos
ab
|a |·|b|
,
where a =(1,f(t, α)),f is the derivative function of y, that is
f(t, α)=
tω
2
α
Z
2
0
1+
α
2
Z
2
0
,
b =(s −α, −β).
Here
θ
2
=arcsin{(n
1
/n
2
)sinθ
1
},
R(t, s)=
1
2
tan(θ
2
− θ
1
)
tan(θ
2
+ θ
1
)
2
+
sin(θ
2
− θ
1
)
sin(θ
2
+ θ
1
)
2
,
and T =1−R.
The trapping efficiencies Q
s
and Q
g
are given from (3.5) and (3.6) as
Q
s
=1+R(t, s) cos(2θ
1
) −
T
2
{cos(2θ
1
− 2θ
2
)+R(t, s) cos(2θ
1
)}
1+R(t, s)
2
+2R(t, s) cos(2θ
2
)
,
Q
g
= R(t, s) sin(2θ
1
) −
T
2
{sin(2θ
1
− 2θ
2
)+R(t, s) sin(2θ
1
)}
1+R(t, s)
2
+2R(t, s) cos(2θ
2
)
.
Considering the z-component,
Q
s
=Q
s
cos φ, cosφ =
1
1+f(t, s)
2
,
Q
g
= Q
g
sin τ, sin τ =
f(t, s)
1+f(t, s)
2
.
The trapping efficiency along the z-axis due to a ray is given as Q
z
= Q
s
+Q
g
.
3.2 Theoretical Analysis 97
Next, the trapping efficiency due to a circular element of radius β is
given as
Q
c
=2πβQ
z
.
Finally, this trapping efficiency is integrated over the entire cross-section
of the sphere for all individual rays using the Shimpson formula under the
conditions in Table 3.5.
Figure 3.18 shows the axial trapping efficiency dependence on the distance
from the optical fiber end for a polystyrene sphere of radii 2.0 and 2.5 µm.
The laser beam profile is Gaussian and the wavelength is 1.3 µm. It is seen
from the figure that trapping force increases as axial distance increases from
zero to a beam waist of 40 µm, i.e., it increases over the region in which
the fiber lens is focusing, and then begins to decrease monotonically as the
beam diverges beyond the focus. Therefore, we can expect that the optimum
dual fiber lens spacing will exists at a point where axial trapping efficiency is
changing rapidly (see Sect. 3.3.4).
3.2.4 Off-axial Trapping by Solitary Optical Fiber
In recent years, studies of optical tweezers have been conducted on optical-
fiber tweezers [3.12] to improve their operation in the fields of life science and
Table 3.5. Conditions for analysis of tapered lensed optical fiber trapping efficiency
refractive index
water 1.33
particle 1.59
fiber core 1.446
beam waist in the core (µm) 5.0
beam waist distance (µm) 49.24
radius of curvature (µm) 10
wavelength (µm) 1.31
particle radius (µm) 2–10
0
0.001
0.002
0.003
0.004
0.005
0.006
0.007
0.008
0 50 100 150 200 250 300 350 400
Distance from fiber end (mm)
Trapping efficiency
Diameter
5 mm
4 mm
Fig. 3.18. Axial trapping efficiency dependence on distance from optical fiber end
of polystyrene sphere
98 3 Optical Tweezers
micromachines. The optical fiber implementation of such tweezers is simple
and inexpensive. The apparatus that uses a laser diode and an optical fiber
is particularly simple since no external optics such as a dichromatic mirror, a
beam splitter, and filters are required.
Trapping forces can be resolved into two components: the gradient force
F
g
, which pulls microspheres in the direction of the strong light intensity,
and te scattering force F
s
, which pushes microspheres in the direction of light
propagation. If a microsphere is located on the light propagation axis, the
gradient forces cancel out, thereby resulting in pushing the sphere. Therefore,
two counterpropagating coaxially aligned optical fibers are used to trap the
sphere suspended in water [3.13]. Although the sphere is stabilized axially at
a location where the scattering forces of the two beams balance each other,
the trapping in the transverse direction is weak. The freedom of operation for
the counterpropagating coaxially aligned optical fibers is poor. In this section,
we theoretically analyze an off-axial microsphere trapping force [3.14] in three
dimensions in order to trap it with a solitary optical fiber.
Analysis of Off-axial Trapping
Trapping efficiency for a microsphere on an optical axis can be calculated,
from axial symmetry, as shown in Fig. 3.19a, by integrating the optical pres-
sure force due to an individual ray in two dimensions. On the other hand,
calculation in three dimensions is necessary for the off-axial trapping effi-
ciency because of axial dissymmetry. Figure 3.19b shows that a ray enters at
(a)
Y
Z
F
s
F
g
F
g
F
s
Total trapping force
(b)
Intersection(x,y,z)
Incident
angle q
1
Y
Z
Beam profile
Sphere center
(0,B,A)
Axial distance A
Off-axial distance B
F
s
F
g
Fig. 3.19. Geometry for calculating trapping efficiency for a microshere when focus
is located on optical axis (a), and at off-axis (b)
3.2 Theoretical Analysis 99
the incident angle θ
1
on the arbitrary intersection (x, y,z)ofthesurfaceofa
sphere, whose center is located at (0,B,A). The y-coordinate is expressed as
y
(x,z)
= B +
r
2
− x
2
− (z − A)
2
(3.12)
The beam profiles for the x-andy-directions are given as
ω
y
= tω
0
1+
z
Z
0
2
,ω
x
= uω
0
1+
z
Z
0
2
, (3.13)
where ω
0
is the radius at the beam waist, Z
0
is the depth of focus, and
t(0 ≤ t ≤ 1) and u(0 ≤ u ≤ 1) are variable parameters.
Next, the incident angle θ
1
of a ray entering the sphere at the inter-
section point (x, y, z) is defined as the angle between the tangential vector
a =
ω
x
,ω
y
, 1
of the ray and the vector b =
x, B − y
(x,z)
,A−z
pointing
from the intersection (x, y, z) to the center (0,B,A) of the sphere
θ
1
= arccos
ab
|a |·|b|
. (3.14)
As a result, the trapping efficiencies Q
s(x,z)
and Q
g(x,z)
owing to a ray
hits the intersection (x, y, z) can be obtained using (3.5) and (3.6). The entire
trapping efficiency due to the entire surface of the microsphere is given later.
Figure 3.20 shows the sectional view of the off-axial trapping (a), indicating
how to integrate Q
s(x,z)
and Q
g(x,z)
along the z-axis (b). Calculate the incident
angle at the arbitrary point z in the circle in the yz plane and compute the
optical trapping efficiency for the ray. Then integrate Q
s(x,z)
and Q
g(x,z)
along
the z-direction leading to Q
s
z
(x)
and Q
g
z
(x)
in the yz plane. The integration
is carried out for the upper and lower hemispheres individually because of
the dissymmetry due to off-axial trapping. The integration starts from the
Beam profile
(a)
A-r
z
upper
(x)
(t
max
)
z
lower
(x)
(t
max
)
z
(x)
(t
min
)
dx
dz
Beam profile
(b)
x=0
x(u
max
)
zz
Y
X
Fig. 3.20. Method of optical pressure integration when a sphere is located at an
off-axis, side view (a), and top view (b)
100 3 Optical Tweezers
left side z
(x)
(t
min
)=A −
√
r
2
− x
2
in Fig. 3.20a for both the upper and lower
hemispheres. The integration ends at the tangential point between the ray and
the surface profiles of the upper and the lower hemispheres. The integration
end points z
upper
(x)
(t
max
) for the upper hemisphere and z
lower
(x)
(t
max
) for the lower
hemisphere are given by the solution between two equations shown as
r
2
− x
2
=
y
(x,z)
− B
2
+(z − A)
2
ω
y
= tω
0
1+
z
Z
0
2
. (3.15)
Then, Q
z
s(x)
and Q
z
g(x)
are given as
Q
z
s(x)
=
z
upper
(x)
(t
max
)
z
(x)
(t
min
)
Q
s(x,z)
dz +
z
lower
(x)
(t
max
)
z
(x)
(t
min
)
Q
s
(x,z)
dz, (3.16)
Q
z
g(x)
=
z
upper
(x)
(t
max
)
z
(x)
(t
min
)
Q
g(x,z)
dz +
z
lower
(x)
(t
max
)
z
(x)
(t
min
)
Q
g
(x,z)
dz. (3.17)
Next, our integration goes along the x-axis. Figure 3.20b shows the top
view, indicating how to integrate along the x-axis. The trapping efficiencies
Q
z
s(x)
and Q
z
g(x)
in the yz plane are summed along the x-axis in the xz plane.
In this case, the integration starts from x = 0 and ends at x = x(u
max
), which
is the tangential point between the ray profile (3.13) and the sphere circle
(3.18) in the xz plane
x
2
+(z − A)
2
= r
2
ω
x
= uω
0
1+
z
Z
0
2
. (3.18)
Then, Q
all
s
and Q
all
g
are given as
Q
all
s
=2
x(u
max
)
0
Q
z
s(x)
dx, (3.19)
Q
all
g
=2
x(u
max
)
0
Q
z
g(x)
dx. (3.20)
As a result, the total trapping efficiency comes from (3.7). Followings are the
numerical results for the off-axial trapping in three dimensions.
Off-axial Distance and Microsphere Radius Dependence
In the analysis a circularly polarized laser beam by a laser diode with a 1.3 µm
wavelength, a tapered lensed optical fiber with a curvature of 10 µm, and mi-
crospheres 2–10 µm in radius are used under the conditions listed in Table 3.6.
First, transverse trapping efficiency on the off-axial distance (transverse
offset) is analyzed for a polystyrene sphere of 2.5 µm radius located at different
3.2 Theoretical Analysis 101
Table 3.6. Microspheres for analysis of solitary fiber trapping
material refractive index density (g cm
−3
) radius (µm)
polystyrene 1.6 1.06 2–10
glass 1.51 2.54 2–10
-0.06
-0.04
-0.02
0
0.02
0.04
0.06
-10 -55
10
Off-axial distance (mm)
Fiber end
At beam waist
2 fold beam waist
3 fold beam waist
Optical trapping efficiency
Fig. 3.21. Variation in transverse trapping efficiency for a 2.5-µm-radius mi-
crosphere as function of off-axial distance, with beam axial distance as a parameter
axial distances of zero (fiber end), beam waist, two-fold beam waist, and
three-fold beam waist. The axial distance of the sphere is measured along the
symmetry axis of the laser beam and the off-axial distance of the sphere is
measured as a relative distance to the symmetry axis (transverse offset) of the
laser beam. It is seen from the numerical results in Fig. 3.21 that the optical
pressure force towards the beam axis (transverse force) is exerted by off-axial
trapping and becomes maximum at an axial distance of 3 µm.
Second, transverse trapping efficiency at the off-axial distance is analyzed
for polystyrene spheres of 2–10 µm radius at an axial distance from the beam
waist location. It is seen from Fig. 3.22 that the transverse trapping efficiency
increases as the sphere radius increases and the location where the trapping
efficiency becomes maximum is far away from the beam axis. When the radius
increases, more power illuminates the sphere; thus the maximum transverse
efficiency is realized.
Optical Trapping by Solitary Fiber
In off-axial trapping, the optical pressure force towards the beam axis (trans-
verse force) F
g
is exerted as described earlier. Finally, we realize solitary op-
tical fiber trap by balancing the horizontal components of the gradient force
F
g
, which always pulls a sphere to the beam axis and the scattering force
F
s
, which always pushes a sphere along the beam axis. Figure 3.23 shows the
concept of the horizontal component balanced between the optical pressures
F
s
and F
g
owing to the oblique incident θ for an optical fiber [3.15].
102 3 Optical Tweezers
-0.5
-0.4
-0.3
-0.2
-0.1
0
0.1
0.2
0.3
0.4
0.5
-20 -10
10
Off-axial distance (mm)
2
3
4
5
6
7
8
9
10
Sphere
radius
(mm)
20
Optical trapping efficiency
Fig. 3.22. Variation in transverse trapping efficiency at beam waist as function of
off-axial distance, with microspore radius as a parameter
Y
Z
F
g
F
s
F
sz
F
gz
Beam axis
Incident
angle
Fig. 3.23. Balancing between scattering force F
s
and gradient force F
g
at fiber
incident angle of θ [3.15]
Following are the analyses for the incident angle of θ that satisfies F
gz
=
F
sz
for polystyrene radii ranging from 2 to 10 µm. Figure 3.24 shows the fiber
incident angle for different sphere radii at the maximum gradient force on
off-axial position. It is seen from the figure that as axial distance increases
the fiber incident angle illuminating the sphere first decreases, then increases
a little and becomes constant (about 40
◦
) at the axial distance of 10 µm.
Figure 3.25 also shows the numerical results, showing that incident angle
decreases at radius intervals of 0–3 µm; after that it remains almost constant
at 35
◦
. From the results stated earlier, we may trap a microsphere two di-
mensionally by a solitary fiber illuminating at an angle of about 40
◦
.Bythe
way, the experimental results for glass and polystyrene microspheres of 5 µm
diameter show that the minimum trapping power linearly increases with stage
velocity (Fig. 3.37).
3.3 Experimental Measurement and Comparison 103
10
20
30
40
50
60
70
80
90
010
Off-axial distance (mm)
2
3
4
5
6
7
8
9
10
Sphere
Radius
(mm)
Incident angle (deg)
5
Fig. 3.24. Relationship between optimum fiber incident angle and radius of mi-
crosphere for F
sz
= F
gz
at maximum F
g
on off-axial position
20
30
40
50
60
70
80
90
0610
Sphere radius (mm)
Incident angle (deg)
24 8
Fig. 3.25. Variation in fiber incident angle as function of off-axial distance at F
s
=
F
g
, with microsphere radius as a parameter
3.3 Experimental Measurement and Comparison
of Experimental and Theoretical Predictions
The use of optical tweezers is seen as a method of manipulating [3.16],
aligning [3.17], fabricating and rotating [3.8] microobjects mainly in aqueous
solutions. The optical trapping characteristics of spherical particles for these
types of application were analyzed theoretically in Sec. 3.2 and are analyzed
experimentally in this section. We not only describe the results of the exper-
iments required to determine the characteristics of the optical trap but also
compare the results with that of theoretical ones.
3.3.1 Experimental Setup
An experimental setup for trapping and manipulating particles using upward-
directed and downward-directed YAG laser beams at a wavelength of 1.06 µm
104 3 Optical Tweezers
Cover glass Liquid
Slide glass
Objective lens
Spacer
CCD
ND filter
l/4 plate
Beam expander
Monitor
YAG laser
Upper objective
Stage
Lower objective
Dichroic mirror
Enlarged view
Fig. 3.26. Experimental setup for trapping and manipulating microobjects us-
ing upward-directed and downward-directed YAG laser beams with wavelength of
1.06 µm
having a TEM
00
mode structure is shown in Fig. 3.26. The laser beam di-
ameter is increased from 0.7 to 8.2 mm by a beam expander to fill the entire
aperture of the objective uniformly. A quarter-wave plate is placed to generate
a circularly polarized beam. The intensity of the laser beam is varied using
a ND filter. The beam is divided by a beam splitter to enter two objective
lenses for focusing the downward-directed and upward-directed laser beams.
A dichroic mirror is used to separate the transmitted image from the trapping
beam. The total transmittance efficiency from YAG laser to the objective is
about 35%. The transmittance efficiency of the immersion oil objective lens
(NA = 1.25) is 21% at a wavelength of 1.06 µm.
Figure 3.27 shows photographs of the experimental setup. Microobjects are
suspended in an aqueous medium in a chamber. The chamber is made similar
to a hole of a spacer (50–150 µm in depth) inserted between a coverslip (150 µm
in depth) and a glass slide. The particle is trapped so as to be pulled to the
focus of a strongly converging laser beam transmitted through the coverslip.
When the objective lens moves, the particle follows the objective motion.
The trapping behavior of the microobjects is monitored using a CCD camera.
We have measured the minimum laser power for both axially trapped and
transversely trapped particles by balancing the gravitational force and the
viscous drag force, respectively.
The particles have also been manipulated successfully using the upward-
directed and downward-directed laser beams. Two beams do not interfere each
other, which leads to the appropriate manipulation of microobjects such as in
the assembly of particles in the fabrication of a 3-D microobject.
3.3.2 Axial Trapping Power
To measure the minimum axial trapping power P
ax
min
, first, polystyrene/glass
spheres are dispersed in water and trapped by a circularly polarized laser beam
converged with a 1.25-NA objective lens. Second, the power of the trapping
3.3 Experimental Measurement and Comparison 105
Objective
Microscope
YAG laser
Stage
CCD
(a) (b)
Objective Stage
Fig. 3.27. Photograph of optical trapping apparatus. Upper and lower objective
lenses are seen around the microscope stage lower left in (a). Two objective lenses
used in trapping particles in water with downward-directed and upward-directed
laser beams (b)
Minimum trapping power (mW)
Minimum trapping power (mW)
Upward directed
(a)
Downward
Particle diameter (mm)Particle diameter (mm)
(b)
Upward directed
Downward
0.4
0.3
0.2
0.1
0
02468
0
1
2
3
4
02468
Fig. 3.28. Dependence of minimum axial trapping power on diameter for
polystyrene spheres (a), and glass spheres (b)
beam decreased until the microsphere is observed to fall out of the trap.
This P
ax
min
is taken to be the difference between the gravitational and buoyant
forces. The spheres used for experiments are polystyrene (ρ =1.06 g cm
−3
,
n =1.60) of 3.23, 5.85, 7.73, 10, 20, 30, 40 and 50 µm in diameter and glass
(ρ =2.54 g cm
−3
,n=1.51) of 1.0, 2.5, 3.1, 5.1 and 5.8 µm in diameter.
Figure 3.28 shows the dependence of the measured P
ax
min
on sphere diam-
eter at T =10µm for the polystyrene (light) spheres (a), and glass (heavy)
spheres (b), where T is the distance of the laser focus from the coverslip.
P
ax
min
with an upward-directed (lower) laser beam is less than that with the
downward-directed (upper) laser beam because the scattering force is added
to the gradient force to trap the particle with an upward-directed beam. The
discrepancy between the predicted and the measured forces is found to be
smaller for a heavy particle (glass) than that for a light particle (polystyrene).
This may be because the glass has smaller effects in both Brownian motion
and electrostatic force than polystyrene.
The theoretical axial trapping power P
ax
pre
is shown by the solid line (up-
ward directed) and the broken line (downward directed) from (3.21) [3.11]
106 3 Optical Tweezers
that considers gravity, buoyancy and Brownian movement (theoretical trap-
ping power is calculated using the expression P
ax
pre
= F
ax
pre
c/n
1
Q
max
).
F
ax
pre
=
π
6
(ρ
s
− ρ
m
) d
3
g +2kT/d, (3.21)
where ρ
s
and ρ
m
are the densities of the sample spheres and suspending
medium, respectively; d is the diameter of the spheres, g is the gravitational
acceleration, and kT is the thermal energy.
Results of comparison of traps between experimental and theoretical meth-
ods are summarized in Table 3.7 as the ratio of P
ax
min
to P
ax
pre
. The measured
P
ax
min
for glass beads matches the theoretical P
ax
pre
at large diameters (only
about 1.5 times difference for the diameter of 5.8 µm) because the ray op-
tics model is appropriate and the Brownian effect is relatively small for large
diameters. In parentheses, the experimental value with the upward-directed
beam for the 5.8 µm diameter becomes large because the wall force (between
the bead and the cover slip) strongly pulls the bead downward at a small
distance of about 4.2(= 10 −5.8) µm.
A comparison is also given for the axial trapping power in both straight ray
and parabolic ray approximations. Figure 3.29 shows the minimum axial trap-
ping power for polystyrene microspheres comparing the experimental measure-
ments to the predicted results for a straight ray model (broken line) and a
parabolic ray model (solid line). It is seen from the figure that the minimum
axial trapping power largely increases for the parabolic ray model and is close
to the experimental results. This is because the actual focused trapping laser
beam has a beam waist (parabolic ray model) and the individual ray enters
almost vertically to the sphere surface leading to a reduced trapping efficiency.
3.3.3 Transverse Trapping Power
Next, the transverse trapping power P
trans
min
was measured as the minimum
power for trapping a particle moving at the constant velocity v in water, as
Table 3.7. Ratio of experimental and theoretical minimum axial trapping powers
of polystyrene sphere (a), and those of glass sphere (b)
diameter (µm) downward directed upward directed
(a) Polystyrene
3.25 7.6 4.0
5.85 3.5 1.7
7.73 2.4 1.5
(b) Glass
1.0 40 50
2.5 2.5 2.2
3.1 1.9 2.0
5.1 1.8 1.7
5.8 1.5 -
3.3 Experimental Measurement and Comparison 107
Particle diameter (mm)
Beam waist
Ray optics
Experimental
Minimum trapping power (mW)
0.40
0.35
0.30
0.25
0.20
0.15
0.10
0.05
0
02468
Fig. 3.29. Minimum axial trapping power for polystyrene sphere comparing the
experimental measurement with the predicted results for straight ray (ray optics)
and parabolic ray (beam waist) optics
Laser
Objective
(2) Stage scanning (3) Minimum power(1) Trapping
Constant velocity Constant velocity
Fig. 3.30. Meathod of measuring transverse trapping power as minimum power for
trapping a particle moving at the constant velocity of v in water
shown in Fig. 3.30. The theoretical transverse trapping power P
trans
pre
can be
expressed as (3.22) [3.11] by considering viscous drag force, trapping depth
and the maximum trapping efficiency Q
max
(= 0.406) [3.4].
P
trans
pre
=
3πµdvc
1+
9d
32
1
T
−
1
H − T
n
1
Q
max
. (3.22)
Here, µ and n
1
are the viscosity and the index of refraction of the suspend-
ing medium (water), respectively; c is the speed of light, and His the height of
the specimen chamber (150 µm). A transversely moving sphere should stably
remain near the sphere surface (Q
max
) on the transverse axis for the light
bead.
108 3 Optical Tweezers
50 100 150 200 250
5
10
15
20
h = 1.0mPa•s
n = 1.33
T = 55
mm
Stage velocity (mm/s)
Minimum trapping power (mW)
0
0
H = 150 mm
d = 10
mm
Fig. 3.31. Dependence of minimum transverse trapping power on the velocity for
d =10µm polystyrene particle
Particle diameter (mm)
0
0
20
40
60
80
100
10 20 30 40 50
Minimum trapping power (mW)
Polystyrene
Fig. 3.32. Dependence of minimum transverse trapping power on diameter of
polystyrene microspheres
Figure 3.31 shows the dependence of P
trans
min
on sphere velocity for d =
10 µm polystyrene particles (small gravity). P
trans
min
increases as bead velocity
increases and the experimental values are fairly in good agreement with the
theoretical ones.
Figure 3.32 shows the dependence of P
trans
min
on sphere size (diameter) for
polystyrene particles with a downward-directed beam. P
trans
min
substantially
increases as d increases due to the Stokes drag force increase. The discrepancies
between the theory and experiment for the trapping forces at d>30 µm is due
to the fact that the trapping position moves to upward from the transverse
center line in the sphere, and that Q becomes smaller, since the gravitational
force increases for such large spheres [3.18] (Q3.7).
3.3.4 Optical Fiber Trapping
To realize a simple and inexpensive implementation of an optical trap, 3-D
trapping using the counterpropagating light beams from two optical fibers
and 2-D trapping using a solitary fiber were demonstrated. Figure 3.33 shows
3.3 Experimental Measurement and Comparison 109
(a) (b)
Fig. 3.33. Photographs of setup around fiber ends (a ), and dual tapered fiber
trap (b)
-40 -20
02040
0
10
20
30
Trap position (mm)
110
90
70
50
30
Laser power (mW)
Fiber spacing (mm)
-40 -20
02040
0
10
20
30
Trap position (mm)
Laser power (mW)
(a) (b)
Fiber spacing (mm)
Fig. 3.34. Relationship between trap equilibrium position and output power from
left side fiber ranging from 0 to 40 mW when output power is 15 mW from right side
fiber for different spacings between fiber lens
photographs of the setup around fiber ends (a), and the dual tapered fiber
trap (b). The trap equilibrium position of a 5-µm-diameter glass bead varies
depending on the laser power ratio between the dual fibers. Laser diodes
of 1.3 µm wavelength and cleaved/tapered (hemispherically machined lensed
end) optical fibers are used for the experiment (Tables 3.5, Example 3.6).
Figure 3.34 shows the relationship between the trap equilibrium position
and the output power from the left side fiber ranging from 0 to 40 mW when
the output power from right-side fiber is 15 mW for different fiber lens spac-
ings, which leads to enables the trapping of the particle at any positions in
the dual fiber spacing by changing power ratio. The performance of a lensed
fiber trap (b) is less sensitive in position than that of a cleaved fiber trap (a)
due to its focus depth characteristics.
Figure 3.35 shows that the particle moves to the right continuously as the
left power increases for small spacing of the fiber lens, but jumps for large spac-
ing of the fiber lens. When the spacing becomes large, axial trapping becomes
110 3 Optical Tweezers
(a) (b)
-40 -20 0 20 40
0
10
20
30
110
90
70
(1)
(2)
(3)
(4)
(5)
Trap position (mm)
Laser power (mW)
Fiber spacing (micrometer)
Power up
Power
down
Glass (10 mm)
(1)
(2)
(3)
(4)
(5)
Fig. 3.35. Particle behavior when left power increases for different spacings between
fiber lens
40Њ
Sphere
Optical Fiber
Water
Stage
(a) (b)
Fig. 3.36. Trapping performance by solitary optical fiber inserted at angle of 40
◦
unstable. Anyway, adjusting the relative powers of the optical fibers allow us
to trap and position a bead over axial distances using the counterpropagating
coaxially aligned optical fibers.
Figure 3.36 shows the trapping performance of a solitary fiber. The fiber,
with an illuminating angle of 40
◦
, traps a microsphere of 10 µm diameter. The
minimum trapping power is linearly proportional to the velocity of the stage
as shown in Fig. 3.37. The power is smaller for polystyrene than that for glass
because the polystyrene refractive index (trapping efficiency) is larger and its
density (friction force at the surface due to the 2-D trapping) is smaller than
that of the glass.
In summary, we measured the optical-trapping force on polystyrene and
glass microspheres of different diameters in two orthogonal directions with
upward-directed and downward-directed laser beams and optical fibers. Fol-
lowing are our experimental results:
1. We confirmed that the upward-directed beam has a higher trapping
efficiency than the downward beam for both polystyrene and glass