Micromechanical Photonics - H. Ukita Part 7 pot
Bạn đang xem bản rút gọn của tài liệu. Xem và tải ngay bản đầy đủ của tài liệu tại đây (1.36 MB, 20 trang )
3.3 Experimental Measurement and Comparison 111
Stage velocity (mm/s)
Polystyrene
Glass
0
2
4
6
8
10
12
14
16
0 10203040506070
Minimum trapping power (mW)
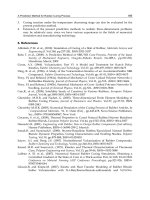
Fig. 3.37. Relationship between minimum trapping power obtained using solitary
optical fiber and stage velocity for microsheres of 10 micrometer in diameter
microspheres. This is because the trapping force is equivalent to F
g
− F
s
for downward illumination, but to F
g
+ F
s
for upward illumination. The-
oretically, the minimum trapping power ratios between the upward- and
downward-directed beams are 1.8 for polystyrene sphere and 1.6 for glass
sphere.
2. The experimental minimum trapping powers are in fairly good agreement
with the theoretical ones for axial trapping, but not in good agreement for
transverse trapping. This is because the trapping position for transverse
trapping changes due to the large gravitational force, particularly for high-
density and/or large particles.
3. The minimum axial trapping power increases as the trapping position
increases from the chamber surface. This is because the spherical aberra-
tion due to the refractive index difference between the immersion oil of the
objective and the aqueous medium in which a microsphere is suspended.
4. Brownian motion is active for microspheres less than about 1 µm in diam-
eter, which increases trapping power.
5. Optical fiber trapping is expected to improve both the operation and
implementation.
Example 3.6. Show that the force due to Brownian motion of a microsphere
suspended in water is equivalent to F =2kT/d where k is the Boltzman con-
stant, T is the absolute temperature and d is the diameter of a microsphere.
Solution. Microspheres smaller than about 1 µm in diameter seem to fall out
of the optical trap when laser power is reduced below a certain level. This
is due to the thermal energy driving the particle in the weakest direction of
the optical trap, i.e., parallel to the beam axis. To express the thermal effect
in force units we assume that the harmonic trap potential Kz
2
/2(K is the
112 3 Optical Tweezers
optical spring constant) equals the thermal energy kT/2 (Brownian motion
energy) [3.11], Therefore, K = kT/z
2
.
At the moment of escape, z =d/2 because the maximum trapping effi-
ciency is close to the surface of the sphere. In this case, the equivalent force
of the Brownian motion is
F = Kz =
kT
z
2
z =
2kT
d
.
3.4 Applications of Optical Tweezers
Ashkin et al. [3.19] demonstrated the optical trapping of a transparent mi-
crosphere by a strongly focused laser beam. A single-beam gradient-force
optical trapping technique has been proved to be useful in the study of
biological processes because of its noninvasive nature [3.20]. Recently, op-
tical tweezers have been applied in various scientific and engineering fields
listed in Table 3.8. Inexpensive fiber manipulation is expected for easy
implementation.
Not only a solid laser but also an LD can be used as a light source for
trapping. The optical pressure force is very weak, nearly pN/mW, but can
manipulate particles on the micrometer scale. Since the gravitational force in-
creases proportional to the third power of the particle radius and the Brownian
effect increases inversely proportional to the radius, there exists an adequate
objective size in trapping. It corresponds to several micrometers, facilitating
the manipulation of living cells in its early developing stage. 3-D trapping is
possible for various particles ranging from 20 nm to tens of micrometers in-
cluding biological, dielectric and polymer particles which are transparent for
the laser beam, as shown in Fig. 3.38.
Recently, materials have been widening for further applications. For ex-
ample, the 3-D trapping of metallic objects is possible due to a gradient force
of the light intensity in the Rayleigh regime where the size is much less than
the wavelength, and also due to the diffractive effect of the light at the sur-
face of the object with a size of several wavelengths [3.21]. Gahagam et al. of
Wochester Polytechnic Institute demonstrated the 3-D trapping of low-index
particles in the size range of 2–50 µm using a donut-shaped intensity pro-
file beam [3.22]. Higurashi et al. of NTT trapped ringlike (hollow), low-index
microobjects in a high-index liquid using upward bottom-surface radiation
pressure [3.17]. The ringlike microobject was made of fluorinated polyimide,
with a refractive index of 1.53 and a surrounding liquid refractive index of
1.61. Following are the actual applications of the optical tweezers classified in
the field of basic research and industry.
3.4.1 Basic Research
Biology
Living cells of several micrometers in size, which are easy to trap, leads to
optical tweezers were first used in biology [3.23]. For example, results of the
3.4 Applications of Optical Tweezers 113
Table 3.8. Applications of optical tweezers
technology fields applications
basic research 1. Physics: Measurement of optical pressure (1964) [3.1]
2. Biology: Measurement of swimming velocity of
bacteria (1987) [3.23]
3. Biology: Measurement of compliance of bacterial
flagella (1989) [3.24]
4. Chemistry: Microchemical conversion system (1994) [3.6]
5. Optics: Microsphere laser oscillation (1993) [3.29]
6. Biology: Kinesin stepping with 8 nm (1993) [3.25]
7. Mechanics: Measurement of particle rotation rate (1995) [3.34]
8. Mechanics: Measurement of the drag force on a
bead (1995) [3.33]
9. Physics: Optically trapped gold particle near-field
probe (1997) [3.31]
10. Biology: Single molecule observation (1998) [3.26]
industry 1. Space engineering: Solar sail flight []
2. Applied optics: Particle transport (1986) [3.19, 3.35]
3. Biological engineering: Living cell fusion (1991) [3.20]
4. Mechanical engineering: 3-D microfabrication (1992) [3.9]
5. Mechanical engineering: Shuttlecock type optical
rotor (1994) [3.8, 1.62]
6. Applied optics: Optical fiber trapping (1995) [3.13],
(1999) [3.15]
7. Mechanical engineering: Optical rotor with slopes(2003) [1.63]
8. Applied optics: Optically induced angular alignment (1999)
[3.17]
9. Mechanical engineering: Gear type optical rotor (2001) [1.65]
10. Applied optics: Optical mixer (2002) [1.50], (2004) [1.66]
11. Applied chemistry: Patterning surfaces with nanoparticles
(2002) [3.40, 3.41]
12. Applied optics: Microstructure formation and control (2004)
[3.39]
manipulation of bacteria and the measurement of the swimming speed of
mitochondria are shown in Fig. 3.39. Furthermore, living cell fusion [3.20] by
violet light exposure in the contact area of two cells trapped independently is
shown in Fig. 3.40.
Another example is the compliance measurement of bacterial flagella. The
torque generated by the flagella motor of a bacterium tethered to a glass
surface by a flagella filament was measured by balancing that generated by
the optical pressure force. The balance was realized by calibrating optical
power [3.24].
The direct observation of kinesin stepping was performed by optical
trapping interferometry with a special and temporal sensitivity for resolving
movement on the molecular scale, as shown in Fig. 3.41 [3.25]. Silica spheres
carrying single molecules of the motor protein kinesin were deposited on mi-
crotubules using optical tweezers and their motion was analyzed to determine
whether kinesin moves in 8 nm steps.
114 3 Optical Tweezers
Particle diameter (mm)
Relative refractive index
Semiconductor
Metal oxide
n = 1.16 - 2.2
k < 0.002
(l = 0.63 mm)
Living cell
Dielectric
Organic
Metal
n = 0.28
k = 7.5
3.0
2.5
2.0
1.5
1.0
0.5
0
0.001
0.01 0.1
1.0
10
100 1000
(3D) (2D)
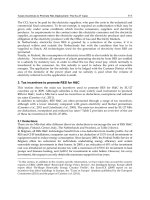
Fig. 3.38. Reported materials and sizes possible for optical trapping by YAG laser
beam. Various particles ranging from 20 nm to tens micrometer in size including
biological, dielectric, polymer and metal particles are included
L
BS
BS
Objective
Sample
cell
CL
Bacteria
X, Y, Z stage
SL
F
E
X, Y, Z mount
BF
BF
VC
I
Fig. 3.39. Example of bacterial manipulation and measurement of swimming speed
of mitocondria by optical tweezers [3.23]
Figure 3.42 shows the simultaneous measurement of individual ATPase and
mechanical reactions of single one-headed myosin molecules [3.26]. A single
actin filament with beads attached to both ends was suspended in a solution
by YAG laser trapping. The fluorescence was excited by the evanescent wave
generated by the total reflection of the green laser shown in the figure. The
local illumination by the evanescent light greatly reduced the background
luminescence.
3.4 Applications of Optical Tweezers 115
Befor trapping
Trapping and contacting
Laser radiation
After 1 second
After 1 minute
After 10 seconds
After 5 minutes
After 15 minutes
(e)
(f)
(g)
(h)
(a)
(b)
(c)
(d)
Fig. 3.40. Living cell fusion by violet light exposure at contact area between two
cells trapped independently [3.20]. Courtesy of S. Sato, Tohoku University, Japan
Displacement and force due to actin–myosin interactions were determined
by measuring bead displacement with nanometer accuracy by a quadrant
photodiode. Individual ATPase reactions were monitored by an SIT camera as
changes in fluorescence intensity due to association–(hydrolysis)–dissociation
events of a fluorescent ATP (analog labeled with Cy3-ATP) with the myosin
head. As a result, it was found that the myosin head produces several hun-
dred of milliseconds after a bound nucleotide is released. This suggests that
myosin has hysteresis or memory state, and stores chemical energy from ATP
hydrolysis [3.26].
Chemistry
Optical tweezers are used in the field of chemistry. Figure 3.43 shows a mi-
crochemical conversion system [3.6] for the studies of reaction kinetics that
allows the selective excitation of optically manipulated particles in reaction en-
vironments, which was prepared by micromachining. Continuous wave YAG
116 3 Optical Tweezers
Polarization
Photodetector A
Photodetector B
Volts = (A-B)/(A+B)
Normalizing
differential
amplifier
diffraction-limited
laser spots
Interferometer
input-output
relationship
Polarizing
beam-splitting
cube
l/4 plate
Wollaston
prism
Wollaston
prism
Polarized laser light
Volts
200
d (nm)
400
x-y piezo
stage
Lens
Lens
Specimen
and
Fig. 3.41. Direct observation of kinesin stepping by optical trapping interferometry
[3.25]
Prism
Halogen lamp
Objective
Green laser
Frosted glass
filter
He-Ne laser
DM
DM
Filter
SIT camera
APD
YAG Laser
PBS
DM
DM
Galvano
scanner
Stage
4D-PD Filter
Fig. 3.42. Simultaneous measurement of individual ATPase and mechanical re-
actions of single myosin molecules. Reprinted from [3.26] with permission by
T. Yanagida, Osaka University, Japan
3.4 Applications of Optical Tweezers 117
Dichromatic mirror (DM)
Objective
CCD camera
Spectroscopic data
Q-switch YAG Laser
CW YAG Laser
Optical fiber
Electrochemical measurement
OH
-
OH
-
OH
-
OH
-
D
D
D
H
H
H
y
z
x
Fig. 3.43. Microchemical conversion system for studies of chemical reaction process.
Reprinted from [3.6] with permission by H. Masuhara, Osaka University, Japan
lasers (λ =1, 064 nm) trap and close particles in contact with each other.
Q-switched YAG laser (λ = 350 nm) stimulates the photochemical reaction
between such particles. Such a chemical reaction was studied by a picosecond
time-resolved laser spectroscopy. They expect that such approaches will make
it possible to study the chemical and physical properties of a single fine parti-
cle as a function of its size, shape, surface morphology and to promote highly
selective/efficient material conversion [3.27].
Optics
Micrometer-sized spherical particles can act as optical cavities in air or liquid
[3.28]. Resonant field is formed inside the surface of particles doped with laser
dye such that the light propagates in a circumferential manner due to the
total internal deflection at the interface [3.29]. The optical characteristics of
the microsphere laser oscillation, such as polarization of resonant modes and
interaction between close particles, were studied. Photon tunneling from the
lasing microsphere to an object was demonstrated as a marked change of
an emission spectrum depending on microsphere-to-object distance. Lasing
microspheres have the advantage of high sensitivity due to the intracavity
enhancement of tunneling loss, i.e., a probe of a scanning near-field optical
microscopy (SNOM) [3.30]. In addition, an optically trapped gold particle
was demonstrated to be a useful near-field probe for the study of the surface
characteristics beyond the diffraction limit resolution [3.31,3.32].
118 3 Optical Tweezers
Micromechanics
Laser scanning manipulation was applied to measure the drag force [3.33]
acting on a glass bead moving in mineral oil between two glass plates. The
rotation rate of a small particle induced by optical pressure was measured by
the cycle of the scattered light from optically trapped particles [3.34].
3.4.2 Industry
Particle Transport
The spatial patterning and directional transport of plural particles in wa-
ter were shown to be possible by single-beam laser trapping. For radioactive
substance or nucleus materials, the optical trapping of metallic oxide parti-
cles with various optical constants were performed to confine, position and
transport without physical contact in water by Omori et al. 3-D trapping was
possible for a ThO
2
particle but only 2-D trapping was observed for a UO
2
particle in water using an He–Ne laser light at 633 nm. This is because a UO
2
particle has a relatively large refractive index and a large extinction coefficient
in the visible region [3.35].
Figure 3.44 shows the relationship between optical constant (refractive
index n and extinction coefficient k) and the maximum trapping efficiency
Q
max
for microspheres with a wavelength of 633 nm. The objective’s NA is
1.3 and the microsphere diameters are 2µm (a) and 10 µm (b). In this calcu-
lation, absorption was considered, therefore decreasing Q
max
with increasing
the diameter. It is also seen from the figure that 3-D trapping was possible
for the metallic oxide having a refractive index less than 2.4 by an He–Ne
laser light (Q
max
< 0). They also demonstrated that laser trapping was also
possible in air [3.36].
-1.5
-2
-2.5
-3
-4
-5
-3.5
-0.1 -0.1
-0.1
-0.1
-4.5
1.4 1.5
0
0
0.1
0.2
0.3
0.1
0.2
0.3
0.4
0.1
0
0
0.2
0.3
0.4
0.2
0.1
1.6 1.7 1.8
n
1.9 2 2.1 2.2 2.3 2.4
-1.5
-2
-2.5
-3
log
10
k
log
10
k
-4
-5
-3.5
-4.5
1.4 1.5 1.6 1.7 1.8
n
1.9 2 2.1 2.2 2.3 2.4
Fig. 3.44. Relationship between optical constant and maximum trapping efficiency
Q
max
for microsphere with wavelength of 633 nm [3.35]
3.4 Applications of Optical Tweezers 119
Ar laser for assembly
(l = 514.5 nm)
YAG laser for adhesion
(l = 355 nm)
CCD camera
(l = 355 nm)
Filter
ND filter
Filter
Fillter
Filter
Iris
Iris
Illuminator
Quater-wave plate
Mirror
Mirror
Mirror
Mirror
Quater-wave plate
Mirror
Mirror
Objective lens
Objective lens
Lens
Lens
Expander
Movement
Movement
Expander
G.M.
G.M.
G.M.
G.M.
Pinhole
Dichroic mirror
Light guide
Axis
alignment
plates
Half mirror
Half mirror
Dichroic mirror
Filter
CCD camera
Eyeplece
Specimen
plane
Fig. 3.45. Micro assembly system using two laser beams, one is for trapping (as-
sembly) and the other is for ablation (adhesion).
Fabrication of 3-D Microstructures
The simultaneous manipulation and microfabrication of spatially arranged fine
particles are attained using optical tweezers by introducing pulsed violet laser
illumination [3.9]. Figure 3.45 shows a microassembly system. The trapping
and ablation (adhesion) laser sources used are a 515-nm CW Ar
+
laser and a
355-nm pulsed YAG laser, respectively.
Such systems mentioned earlier were limited to a small number of objects
trapped in a single plane. Recently, components can be designed to split a laser
beam into many separate beams. Holographic optical tweezers can trap objects
in different focal planes allowing many objects to be simultaneously trapped
[3.37]. Crystal-like structures over a scale of tens micrometers were constructed
using holographic optical tweezers [3.38]. Eight 2-µm-diameter silica spheres
were trapped through the multiple trapping function of the hologram at the
corner of a cube [3.39]. The real-time calculation of the required holographic
pattern allows us to rotate the structure about an arbitrary axis.
Patterning Surfaces with Nanoparticles
The 2-D arrangement of colloids on a substrate is of interest for photonics,
electronics, magnetic, and sensor applications.Optical tweezers are used to
120 3 Optical Tweezers
bring particles from a reservoir and pattern nanoparticles on the substrate.
Fixing was carried out using opposite charges [3.40] or local photopolymer-
ization [3.41] around the nanoparticle assembly.
Optical Rotor
Optical pressure can also rotate dissymmetrical microobjects. Many types
of optical rotor have been proposed for future applications, which will be
described in Chap. 4.
Problems
3.1. Explain the method of measuring an optical pressure force.
3.2. Explain the procedure how to simulate the trapping force exerted on a
microsphere illuminated by a converging laser beam.
3.3. Compare the axial trapping efficiencies for a microsphere predicted by a
straight ray with a parabolic ray.
3.4. Calculate the transverse trapping efficiency for a microsphere when the
focus of the uniformly input laser beam is located along the transverse center
line (perpendicular to the optical axis) of the sphere.
3.5. Compare the transverse trapping efficiency for a microsphere predicted
by a straight ray with a parabolic ray.
3.6. Calculate the total trapping efficiency for a microsphere when the focus
of the input laser beam is located at arbitral positions in the sphere.
3.7. Consider the reasons for the transverse trapping power discrepancy be-
tween the theoretical prediction and the experimental result. Show the tra-
jectory of the trapping (focus) position in the sphere.
4
Optical Rotor
Optical tweezers have been successfully utilized in various scientific and en-
gineering fields such as biology, microchemistry, physics, optics and micro-
mechanics. Their ability to rotate microobjects remotely without the use of
bearings presents important opportunities in optical microelectromechanical
systems (optical MEMS) and biotechnology. This chapter describes the prin-
ciple, design, fabrication, and evaluation of an optical rotor to increase the
mixing performance of microliquids to enable future fluidic applications. The
optical rotor will be used as a mixer in micrototal analysis systems (µ-TAS).
4.1 Background
In space, small particles are blown away rotationally by the radiation pres-
sure of the sun, the so-called windmill effect. In micromechanics the following
methods are known for rotating a microobject using a single laser beam: one
in which a circularly polarized laser beam is used [4.1] and another in which
the rotating nonuniform intensity profile of a higher-order-mode laser beam is
used [4.2]. However, the rotation speeds of both methods are very slow, about
6.7 × 10
−1
− 6.7 × 10
−2
rpm [4.1] and 6 rpm [4.2].
Trapping and manipulation of micrometer-sized particles were demon-
strated firstly by Ashkin using a laser beam through a microscope objec-
tive [3.2]. Presently, optical tweezers have been successfully applied in various
fields. The optical pressure can also be used to rotate the dissymmetrical mi-
croobjects shown in Fig. 4.1, which are a polystyrene particle (refractive index
n =1.6, density ρ =1.07 g cm
−3
), a broken glass (n =1.5,ρ=2.2gcm
−3
), a
glass rod having concave end on the top and elongated cylindrical body, a bro-
ken ZnO (n =2.0,ρ =5.67 g cm
−3
), a broken Si (n =3.5,ρ =2.33 g cm
−3
),
and a broken GaP (n =2.12,ρ =4.13 g cm
−3
) for example. However, we
cannot control the rotational direction for arbitrarily shaped broken micro-
objects.
122 4 Optical Rotor
polystyrene ZnO
Si
GaP
glass
glass
(d)(a)
(b) (e)
(c) (f)
Fig. 4.1. Dissymmetrical/arbitrarily shaped broken microobjects which can be ro-
tated but not controlled the rotational direction by optical pressure. They are a
polystyrene (a), a broken glass (b), a glass rod (c),aZnO(d),anSi(e),anda
broken GaP (f)
Fig. 4.2. Fabricated shuttlecock optical rotors with shape dissymmetry on their
sides
Higurashi et al. reported in 1994 that they could experimentally cause a
directional high-speed rotation, for example, 22 rpm of artificial rotors in water
[4.3]. Yamamoto et al. measured the rotation rate of anisotropically shaped
particles using the temporal variation of light scattered from the rotation
particle [4.4]. Gauthier showed an example of a numerical computation of the
torque exerted on a rotor under restricted conditions [4.5].
Figure 4.2 shows a rotor with shape dissymmetry on its side [4.3]. The
rotor was made by reactive ion-beam etching of a 10-µm-thick silicon dioxide
(SiO
2
) layer. When incident laser light refracts at the top surface of the rotor,
the momentum of the light changes and an upward optical pressure force
for trapping is exerted as shown in Fig 4.3a. Optical pressure force is also
exerted when the light emits from the side surfaces. Fig. 4.3b shows the optical
pressure exerted on side surfaces I and II but not on side surface III. This is
4.1 Background 123
(a)
Laser
Ray
Optical pressure
(b)
Rotation
I
II
III
Fig. 4.3. Optical pressure force exerted on the light-incident upper surface lifts the
rotor (a), and that exerted on the light-emission side surfaces rotates it (b)
because surface III is parallel to the radial direction and does not refract the
laser beam. The optical pressure on side surface II does not contribute to
the optical torque because its direction is radial. The optical pressure on side
surface I, however, rotates the microobject counterclockwise, and we can see
that the direction of rotation can be controlled by appropriately designing
the dissymmetric geometry. Nevertheless, this type of optical rotor has the
following drawbacks.
1. a strongly focused laser beam is required
2. only a fraction of the incident light is effective for rotation
3. the viscous drag force is very large due to the complicated side shape.
To solve these problems, Ukita et al. extended their work and invented
a new rotor remotely driven by not only a focused laser beam but also an
unfocused (parallel) laser beam [4.6]. Fig. 4.4 shows the designed optical rotor
that has a sloped top, a cylindrical body and a flat plane on the bottom. This
rotor has shape dissymmetry on the top, which generates an optical trapping
force and optical torque at the same time. The optical force F , perpendicular
to the rotor slope, is torsionally exerted along the beam axis. F is separated
into two components, scattering force F
s
, and gradient force F
g
. The gradient
force F
g
is further separated into the torque force F
t
, and radial force F
r
.On
the lower surface, only the scattering force is exerted, and no z-axis torque is
exerted because the surface is perpendicular to the optical axis. On the side
surface, optical pressure does not contribute to the z-axis torque because of
its radial direction.
The total z-axis torque and the rotation speed have been evaluated using
the ray-tracing method taking into consideration the beam waist with various
optical parameters such as the numerical aperture (NA) of the lens and the
laser beam profile, as well as rotor shape parameters including oblique angle,
height and diameter. As a result, the cylindrical rotor driven by forces exerted
on its top surface is expected to rotate much faster than the previous rotors
[4.3] driven by forces exerted on their side surfaces. This is because all incident
light that hits the upper surface generates torque and also because the viscous
drag force is small due to the cylindrical structure.
124 4 Optical Rotor
Laser beam
Side wall
Slope
Side
Flat end
F
s
F
t
F
r
F
b
F
A
a
2 g
h
Fig. 4.4. Rotation principle by the optical pressure exerted on the slopes of the
light-incident surface and the cylindrical body
Applications include optical motors for micromachines and optical mix-
ers for µ-TAS. These technologies related to the optical rotor could have a
significant effect on developments in optical MEMS and micromechanical pho-
tonic systems; recently, a micromotor [4.7], a microgear [4.8], a micromachine
element [4.9], and a micromachine with complicated shape [4.10] have been
presented.
4.2 Theoretical Analysis I – Optical Torque
Two kinds of optical rotors are presented: a rotational but not bilaterally
symmetrically structured rotor to which optical torque is applied on its side
surfaces and a cylindrical optical rotor which has slopes for rotation on its
top. Their rotation mechanisms have been clarified both experimentally and
theoretically. The optical rotor is expected to solve the problems of an MEMS
motor, i.e., short lifetime due to friction and requirement of electrical wires
for the power supply.
4.2.1 Optical Rotor Having a Dissymmetrical Shape (Shuttlecock)
on its Side
The optical rotation principle of a shuttlecock optical rotor that has no bi-
lateral symmetry in the horizontal cross-section is shown in Fig. 4.3. In order
to simulate the optical torque, the laser beam was divided into 100 × 100
elements on the objective lens aperture, as shown in Fig. 4.5. We considered
4.2 Theoretical Analysis I – Optical Torque 125
Objective plane
x
z
y
0
Element
F
y
Objective
x
0
z
(r
L
, b)
r
R
(a) (b)
Fig. 4.5. Ray optics to simulate the optical torque of the shuttlecock rotor, where
ray incidence (r
L
,β) on the lens aperture is considered and the torque is estimated
at the point r
R
on side surface I
the ray incidence (r
L
,β) on the lens and estimated the torque at point r
R
on
side surface I in Fig. 4.3. Radius r
R
is expressed as
r
R
=
w
cos β
, (4.1)
where w is the wing width. Optical pressure F at the incident light angle of
θ. is derived in Example 3.2 and expressed as
F =
n
1
c
P
(1 + R)cosθ
1
−
n
2
n
1
T cos θ
2
, (4.2)
where n
1
and n
2
are the refractive indexes of the surrounding medium and the
rotor, respectively. P is the laser power, c
0
is the speed of light in vacuum,
and θ
2
is the refractive angle calculated from Snell’s law. R and T are the
reflectivity and transmittivity, and they are derived from the Fresnel formula.
As a consequence, optical pressure F can be calculated if the incident light
angle θ
1
is defined.
The optical torque T at r
R
is given as
T = r
R
F sin β. (4.3)
The total optical torque M exerted on the four-wing surfaces is
M =4
β=cos
−1
2w
d
β=0
r
L max
r
L min
F sin αr
2
dr dβ (4.4)
where d is the rotor diameter and r
L min
and r
L max
are the minimum and
maximum distances from the optical axis, respectively. They are given as
126 4 Optical Rotor
r
L min
=0andr
L max
= tan{arcsin(NA/n
1
)}, where NA is the numerical
aperture of the objective lens.
Figure 4.6a shows the optical torque dependence on the focal point where
the refractive indexes are n
1
=1.33 and n
2
=1.6. The diameter is d =20µm,
and the thickness is t =10µm, and the wing width is w =3.3 µm. The optical
torque reaches a maximum when the focal point is 4 µm above the top surface.
Fig. 4.6b shows the simulated results at the focal point located 5 µmabovethe
upper surface of the rotor under the same conditions as above. The optical
torque increases as the NA increases and reaches a maximum at NA = 1.2
because the large divergent angle increases the amount of light emitted from
the side surface, as shown in Fig. 4.3a, but it decreases due to the increase in
reflectivity at the top surface when NA becomes greater than 1.2. Table 4.1
lists the conditions of torque simulation for the optical rotor.
(b)
Objective lens NA
0
100
200
300
400
500
600
700
800
0 0.5 1 1.5
0 5 10 15 20
Focus position (mm)
Optical torque (pNmm)
Optical torque (pNmm)
0
100
200
300
400
500
600
700
800
(a)
Fig. 4.6. Simulated optical torque dependence on focal position with objective lens
NA=1.2 (a), and dependence on objective lens NA (b ) with focus above 5 µm, for
shuttlecock rotor with uniform light beam profile
Table 4.1. Conditions of torque simulation for an optical rotor
optical conditions
laser intensity profile uniformly filled
laser power 0−200 (typical 100) mW
objective NA 1.25
refractive index of the medium 1.33 (water)
refractive index of the rotor 1.6
focus above a rotor upper surface 0−20 (typical 5) µm
speed of light in vacuum 3 × 10
8
m/s
rotor size
diameter 10−50 (typical 20) µm
thickness 1−20 (typical 10) µm
wing width 2.7−5(typical3.3)µm
4.2 Theoretical Analysis I – Optical Torque 127
4.2.2 Optical Rotor with Slopes on the Light-Incident Surface
The characteristics of the optical trapping force and optical torque for a cylin-
drical optical rotor with slopes on the light-incident surface are analyzed using
a ray optics model for both parallel and focused laser beam illuminations. The
rotor is expected to be aligned with the light beam propagation axis. Since
the total illuminated light beam contributes to the rotation and the cylindri-
cal shape is effective in decreasing the viscous drag force, this new rotor is
expected to rotate much faster than the conventional one.
First, light-driven cylindrical rotors with various slope angles and height-
to-radius ratios are analyzed. Figure 4.4 shows that the optical pressure force
F perpendicular to the surface, at an arbitrary point on the top surface is
torsionally directed along the beam axis. Force F is decomposed into two
components: scattering force F
s
pointing in the direction of the beam axis
and gradient force F
g
pointing in the direction perpendicular to the beam
axis. Gradient force F
g
(not shown) is decomposed further into torque force
F
t
and radial force F
r
. On the lower surface, only scattering force F
b
is exerted,
and no z-axis torque exists because the surface is perpendicular to the optical
axis.
Parallel Beam Illumination
We assume that a circularly polarized Gaussian Nd:YAG laser beam (wave-
length λ =1.064 µm, power P = 100 mW) illuminates the rotor (refractive
index n
2
=1.5, density ρ =2.2gcm
−3
, diameter 2r =3µm and height
h =10µm) in water (n
1
=1.33). When vertically illuminated on the top
surface by a parallel beam, the incident angle a
1
is equal to a (the slope angle
of the rotor) and the optical pressure F at arbitrary point A is given by (4.2).
Quantities R and T are derived from the Fresnel reflection and transmission
coefficients using (3.2) and (3.3). Scattering force F
s
and torque force F
t
at
point A are given by
F
s
= F cos(a) (4.5)
F
t
= F
g
sin(θ)=F sin(a)sin(θ) (4.6)
Therefore, torque T
q
at point A is
T
q
= rF
t
= Q
torque
(n
1
P/c), (4.7)
where Q
t
is the torque efficiency in unit of m.
When vertically illuminated by a parallel beam, all the refracted light is
reflected by the side surface, which leads to the incident angle to the bottom
surface being (a
1
− a
2
). Therefore, optical pressure F
b
at the bottom surface
is given by
F
b
= {(n
2
/n
1
)(1 + R
)cos(a − a
2
) − T
cos(a
3
)}(n
2
P
/c), (4.8)
128 4 Optical Rotor
where a
3
is the refraction angle for the incident angle of (a − a
2
),P
is the
incident light power at the bottom, R
is the reflectivity and T
is the trans-
mittance at the bottom. The total trapping force is given as the total sum
F
trap
=
(F
s
+ F
b
)dS, (4.9)
and total torque M
opt
acting on the rotor is given as the sum
M
opt
=
n
1
c
P
Q
torque
dS. (4.10)
Figure 4.7 shows the dependence of trapping force F
trap
on slope angle
a. We have defined the positive axial trapping force to be in the +z direc-
tion. The curves show F
trap
on the top (upper), bottom (lower), and both
surfaces (total). Since all the rays refracted at the top surface are reflected
from the side surface, scattering force F
b
on the flat bottom is always greater
than scattering force F
s
on the top. Thus the net trapping force (F
b
− F
s
),
always positive, pushes the rotor away, which leads to two-dimensional (2-D)
trapping.
Figure 4.8 shows the dependence of the rotation rate on the slope angle.
Assuming that the rotor is cylindrical, we can approximate the rotation rate
by M
opt
= M
drag
(= 4πµr
2
hω), where M
opt
is the optical torque of (4.10), µ
is the medium viscosity (µ = 1 mPa s), r is the radius, h is the height of the
rotor and ω is the angular velocity.
Focused Beam Illumination
A ray tracing method considering the beam waist is employed to analyze the
optical forces exerted by a focused laser beam. Figure 4.9 shows ray tracing for
the rotor illuminated with a focused beam. An incident ray repeats reflection
Slope angle (deg)
020406080
-40
-20
20
40
60
0
-60
Lower
Total
Upper
Trapping force (pN)
Fig. 4.7. Dependence of trapping forces on slope angle
4.2 Theoretical Analysis I – Optical Torque 129
Slope angle (deg)
0
20 40 60 80
0
400
800
1,200
1,600
2,000
2,400
Diameter 2 mm
3
6
Parallel beam
Rotation rate (rpm)
Fig. 4.8. Dependence of rotation rate on slope angle, with rotor diameter as a
parameter (P = 100 mW)
(a) (b)
Objective
z
f
Trapping
efficiency
(i)
(ii)
(iii)
Beam waist z
f
z
Fig. 4.9. Ray tracing for the rotor illuminated with a focused beam (a), and trap-
ping efficiency along the light beam axis (b)
and refraction on each surface of the rotor. Since optical torque, that is, optical
pressure times radius, is exerted on the light-incident surface, the minimum
radius of the waist should be considered in the numerical analysis, particularly
for the cylindrical rotor with slopes.
When the rotor is illuminated by a focused laser beam, the individual rays
propagate parabolically near the waist, as shown in Fig. 4.10. The Gaussian
beam radius along the z-directed propagation axis is given by
W (z)=W
0
1+
z − z
f
Z
0
2
, (4.11)
130 4 Optical Rotor
z
l
W(z)
tW(z)
tW
0
W
0
z = z
f
q
Fig. 4.10. Ray optics model for a focused laser beam considering beam waist. The
ray of tW (z) passes tW
0
at the beam waist (z = z
f
) where 0 ≤ t ≤ 1
where W
0
is the minimum waist radius, z
f
is the minimum waist position and
2Z
0
corresponds to the depth of focus. An arbitrary point on the ray, angle θ
in the xy plane, can be described as
{W (z)cosθ, W(z)sinθ,z}. (4.12)
Ray vector I of tW(z) that passes through tW
0
(0 ≤ t ≤ 1) on the beam
waist (z = z
f
) plane can be expressed as
I = {tW
(z)cosθ, tW
(z)sinθ, z}, (4.13)
where W
(z)isthez derivative of W (z). Reflected ray vector l
r
and refracted
ray vector l
t
on the incident plane can be written, using vector I of the incident
tW (z)rayas
I
r
= I − 2(I •n) n, (4.14)
I
t
= I +(I • n)
tan (θ
2
)
tan (θ
1
)
− 1
n , (4.15)
where n defines the vector normal to the interface, θ
1
is the angle of incidence
and θ
2
is the angle of refraction. The optical forces at each point are calculated
using these ray vectors as follows.
We traced the rays until they hit the bottom surface and computed the
optical pressure on each surface. The light reflected from the bottom causes
an error in the optical pressure. The ratios of such light power to the input