Báo cáo y học: "Predicting AIDS-related events using CD4 percentage or CD4 absolute counts" pps
Bạn đang xem bản rút gọn của tài liệu. Xem và tải ngay bản đầy đủ của tài liệu tại đây (231.22 KB, 6 trang )
BioMed Central
Page 1 of 6
(page number not for citation purposes)
AIDS Research and Therapy
Open Access
Research
Predicting AIDS-related events using CD4 percentage or CD4
absolute counts
Yasmin Pirzada, Sadik Khuder and Haig Donabedian*
Address: College of Medicine, University of Toledo, Department of Internal Medicine, 3120 Glendale Ave, Toledo, OH 43614, USA
Email: Yasmin Pirzada - ; Sadik Khuder - ; Haig Donabedian* -
* Corresponding author
Abstract
Background: The extent of immunosuppression and the probability of developing an AIDS-
related complication in HIV-infected people is usually measured by the absolute number of CD4
positive T-cells. The percentage of CD4 positive cells is a more easily measured and less variable
number. We analyzed sequential CD4 and CD8 numbers, percentages and ratios in 218 of our HIV
infected patients to determine the most reliable predictor of an AIDS-related event.
Results: The CD4 percentage was an unsurpassed predictor of the occurrence of AIDS-related
events when all subsets of patients are considered. The CD4 absolute count was the next most
reliable, followed by the ratio of CD4/CD8 percentages. The value of CD4 percentage over the
CD4 absolute count was seen even after the introduction of highly effective HIV therapy.
Conclusion: The CD4 percentage is unsurpassed as a parameter for predicting the onset of HIV-
related diseases. The extra time and expense of measuring the CD4 absolute count may be
unnecessary.
Background
The great majority of clinical laboratories use single-plat-
form flow cytometry which directly measures the percent-
age of lymphocytes which are CD4 positive [1]. In order
to calculate the absolute CD4 T-cell cell count, a complete
blood cell count must be done to determine the absolute
white blood cell count. The absolute white blood cell
number per microliter must then be multiplied by the
fraction of white blood cells which are lymphocytes as
determined by a manual differential count. The resulting
lymphocyte count per microliter is multiplied by the
measured CD4 percentage to yield an absolute CD4 count
per microliter of blood. This method introduces two
sources of measurement errors (WBC measurement and
differential count). It also requires the drawing of blood
into another tube as flow cytometry and CBC tubes
require different anticoagulants. Pan-leukocyte gating
with CD45 antibody is now standard procedure and it
reduces the error in the CD4 determination, but it does
not eliminate the variability inherent in the calculations.
In addition to extra blood drawn, extra work performed
and the introduction of extra measurement errors, there is
a problem with the variability of the absolute CD4 count
throughout a 24 hour day in both normal and HIV-
infected patients [2]. The Centers for Disease Control def-
inition of AIDS allows the measurement of the CD4 per-
centage as an option for the diagnosis of AIDS [3] and as
an option for instituting pneumocystis prophylaxis (but
not for toxoplasma or MAI prophylaxis) [4]. Since the var-
iance of the measurement of CD4 percentage is about
one-half of that of the CD4 absolute count [5], utilization
Published: 17 August 2006
AIDS Research and Therapy 2006, 3:20 doi:10.1186/1742-6405-3-20
Received: 05 May 2006
Accepted: 17 August 2006
This article is available from: />© 2006 Pirzada et al; licensee BioMed Central Ltd.
This is an Open Access article distributed under the terms of the Creative Commons Attribution License ( />),
which permits unrestricted use, distribution, and reproduction in any medium, provided the original work is properly cited.
AIDS Research and Therapy 2006, 3:20 />Page 2 of 6
(page number not for citation purposes)
of CD4 percentage could be superior to reliance on the
CD4 absolute count.
Masur et al [6] showed that the CD4 percentage is a valid
predictor of the probability of developing pneumocystis
pneumonia. A study of HIV positive Australian men with-
out AIDS found that the time to develop AIDS could be
predicted by the CD4 count, CD4 percentage and the rate
of change for each [7]. This study excluded patients with
AIDS and preceded the era of effective HIV therapy. A
recently published study [8] showed that the CD4 per-
centage adds predictive value when disease progression is
studied in HIV-infected people with more than 350 CD4
positive cells per microliter.
In order to better clarify the roles of the CD4 percentage
and the CD4 absolute count in the care of HIV patients in
the era of highly effective HIV therapy, we reviewed the
clinical records of 218 of our HIV-infected patients to
determine whether the CD4 percentage is superior to the
CD4 absolute count in predicting the development of an
HIV-related complication. If the CD4 percentage were
superior or equivalent, unnecessary expense, time and
measurement error could be prevented by measuring only
the CD4 percentage.
Methods
Two hundred and eighteen records of HIV-infected
patients followed at the Medical University of Ohio were
analyzed. The names of all HIV-infected patients seen at
our institution were listed alphabetically and all retrieva-
ble charts which contained sufficient data for analysis
were included. One hundred twenty-two patients were
first seen after the advent of effective HIV therapy (after
January 1, 1995). The remainder were first seen prior to
January 1, 1995. We assume that all patients followed
after January 1, 1995 were prescribed effective therapy as
they were all seen by our infectious disease attending phy-
sicians; but we can not be certain that the patients were
taking their therapy continuously or correctly. As such, the
demographic expedient of a temporal divide was used.
All patients had a complete blood count as well as flow
cytometry performed at times deemed appropriate by
their physician. The flow cytometry was gated on light-
scattering characteristics of the leukocytes and the identity
of the lymphocytes confirmed by CD45 antibody positiv-
ity to exclude cellular debris.
The absolute lymphocyte count, CD4 absolute count,
CD4 percentage, CD8 absolute count, the CD8 percentage
and the CD4/CD8 ratio of the absolute counts and the
ratio of the percentages were recorded at the first visit and
on subsequent visits until an AIDS-related event occurred
or until the most recent recorded laboratory result. There
were 140 AIDS-related events among the 218 patients
(Table 1).
Survival model methods were used to analyze the data.
Before applying survival models, we compared the patient
groups with and without AIDS-related events with regard
to age and gender distribution. The number of months
between the first clinic visit and the event or the end of the
study was calculated. The median times to an AIDS-
related event were calculated if appropriate and analyzed
using the Cox regression model. We calculated R
2
as pro-
posed by Cox and Snell [9] and used it to evaluate the use-
fulness of various measures in predicting the occurrence
of an event. The R
2
statistic reflects the strength of associ-
ation between the measured variable and the time to
occurrence of an AIDS-associated event.
The number of months to an event were plotted against
the CD4 count and the CD4 percentage for the time peri-
ods before and after 1995. A curve-fitting program was
used to determine the best fit of a continuous curve to the
data. The F statistic was used to compare pairs of fitted
curves to determine which curve best fitted the plotted
points.
Results
Our patients' ages ranged from 21 to 72 and 83% were
male. African Americans made up 34% of our population,
Hispanics 4% and Caucasians 62%. These percentages
reflect the prevalence of HIV infection in the USA. Nine-
Table 1: The incidence of AIDS-related events
Pneumocystis pneumonia 24
Candidal esophagitis 22
Cryptococcal meningitis or fungemia 11
AIDS wasting syndrome 9
Cytomegaloviral retinitis 9
Non-Hodgkin lymphoma 8
Mycobacterium avium bacteremia 8
Dementia or myelopathy 7
Kaposi sarcoma 6
Cerebral toxoplasmosis 5
Pancytopenia (RBC, WBC, Platelets) 5
Progressive multifocal leukoencephalopathy 5
Cytomegaloviral colitis 4
Tuberculosis 3
M. avium pneumonia 3
Cytomegaloviral pneumonia 2
Cardiomyopathy 2
Cytomegaloviral esophagitis 1
Microsporidial colitis 1
Cryptosporidial enteritis 1
M. avium colitis 1
Persistent herpes simplex 1
Aspergillosis 1
Disseminated cytomegalovirus infection 1
Total Events 140
AIDS Research and Therapy 2006, 3:20 />Page 3 of 6
(page number not for citation purposes)
teen percent of our male patients were infected via a het-
erosexual route and 6% were intravenous drug abusers.
Only 3% our female patients were IVDU's. The number of
measurements for each patient varied from 1 to 22,
depending on the frequency of clinic visits and the rapid-
ity of development of an AIDS-related illness.
We found that the absolute lymphocyte count was the
best predictor of the time to an AIDS-related event (Table
2) with an R
2
of 0.887 and a p < 0.0001. The CD4 percent-
age was a close second with an R
2
of 0.857. The CD4 abso-
lute count was of similar value with an R
2
of 0.813. The
ratios of CD4 % to CD8 % and CD4 absolute to CD8
absolute counts were significantly predictive of the time to
an event, but less so than the CD4 percentage alone. The
CD8 percentage alone had the least predictive value.
The absolute lymphocyte count has been cited as a cost-
effective means of following the progression of HIV dis-
ease, especially in areas where flow cytometry is unafford-
able [10]. We were surprised at the power of the absolute
lymphocyte count, but we did not pursue its use further
since flow cytometry is universally accepted in the devel-
oped world as necessary to monitor the progression of
HIV infection.
Since the survival of HIV infected patients improved
greatly with the advent of more effective therapies after
December 1994, we compared the predictive value of
CD4 absolute and CD4 percentage values in patients first
followed before 1995 with those first followed in 1995 or
after (Table 3). Ninety-six patients were first seen before
1995 and 122 after January 1, 1995. When patients are
segregated in this manner, the CD4 percentage is superior
to the CD4 absolute count in patients in the highly effec-
tive therapy era (R
2
= 0.696). Note that the R
2
values are
lower due to the fewer patients analyzed. Before 1995, the
CD4 absolute count has slightly more predictive value
than the CD4 percentage (R
2
= 0.550 vs 0.513).
We also analyzed the predictive value of the CD4 absolute
count and percentage when the CD4 count was stratified
as less than 201 and 201 to 350 at the first measurement.
These data (Table 4) show that the CD4 percentage
remains the best predictor of an adverse event when the
CD4 count is between 201 and 350, but when the count
drops below 201, the CD4 absolute count has more pre-
dictive value.
In order to examine the time to an event, not just its occur-
rence, we plotted the CD4 count and the CD4 percentage
against the time to an event. This was done for patients
first seen prior to 1995 and for those first seen after 1995
(Figure 1). Those patients who presented with an AIDS-
related event were censored from the curves. The compu-
ter-fitted curves are not monotonic, but display the
expected relationship of increasing time to event with
increasing CD4 absolute count or CD4 percentage. For
both pre and post 1995 sets of curves, the CD4 percentage
more accurately predicts the time to an event than does
the CD4 absolute count. The F-statistic is a measure of rel-
ative goodness of fit between two curves and the p values
of the F statistic are p = 0.0002 and 0.0006 in favor of the
CD4 percentage for both groups of patients.
Discussion
In spite of several studies over the last twenty years, the
relative value of the CD4 percentage and CD4 absolute
count in predicting the onset of AIDS-related events is not
settled. A recently published study by Gebo et al of Johns
Hopkins patients [11] attempts to resolve this issue using
an analysis of repeated binary variables. This study found
that for any CD4 percentage quartile, the CD4 absolute
count has additional predictive value. Our study looked at
the time interval between each measurement and the
occurrence of the first AIDS-related event, whereas the
Gebo study looked at the presence or absence of multiple
Table 4:
Chi-Square R
2
P-Value
CD4 201–350
CD4 percentage 2.94 0.05 0.087
CD4 absolute 0.15 0.0001 0.703
CD4 <201
CD4 percentage 9.84 0.193 0.002
CD4 absolute 17.44 0.50 <0.0001
Table 2:
Chi-Square R
2
P-Value
Absolute lymphocyte 44.3 0.887 <0.0001
CD4 percentage 42.1 0.857 <0.0001
CD4 absolute 38.9 0.813 <0.0001
CD8 percentage 3.7 0.015 0.0542
CD8 absolute 26.5 0.547 0.0001
CD4/CD8 percentage 35.8 0.761 <0.0001
CD4/CD8 absolute 33.6 0.720 <0.0001
Table 3:
Chi-Square R
2
P-Value
Before 1995
CD4 percentage 16.2 0.513 <0.0001
CD4 absolute 16.9 0.550 <0.0001
After 1995
CD4 percentage 25.5 0.696 <0.0001
CD4 absolute 22.2 0.596 <0.0001
AIDS Research and Therapy 2006, 3:20 />Page 4 of 6
(page number not for citation purposes)
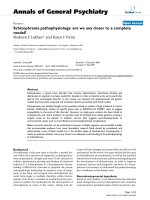
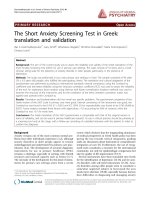
The time to event in months is plotted against the CD4 absolute (A and C) or the CD4 percentage (B and D)Figure 1
The time to event in months is plotted against the CD4 absolute (A and C) or the CD4 percentage (B and D). The patients
who initially presented with an AIDS-related event were censored. The curves were plotted for patients initially seen before
1995 (A and B) and after 1995 (C and D).
B
C
A
D
AIDS Research and Therapy 2006, 3:20 />Page 5 of 6
(page number not for citation purposes)
events for up to 6 months after the laboratory measure-
ment. We believe our time to event analysis has more rel-
evance to the clinician and the patient since it informs
them about the expected time interval in which to inter-
vene. This is important in counseling patients who may
have concerns about the negative aspects of HIV therapy
and want to know how long they can wait before institut-
ing therapy. With the exception of patients who have a
CD4 absolute count below 200 and thus have AIDS by the
Centers for Disease Control's definition [12], the CD4
percentage is superior or equivalent to the CD4 absolute
count in various subsets of HIV infected patients. If only
patients who meet the CDC definition of AIDS are ana-
lyzed (CD4 count <200), the CD4 absolute count is a bet-
ter predictor of the true to onset of an event. This may be
due to the absolute lymphopenia seen in very ill AIDS
patients which is best reflected in the absolute count.
A recent French study of HIV therapy-naïve patients
between 1996–2002 used a survival analysis to determine
the relative value of the CD4 percentage and count in
describing the probability of an AIDS-related event or
death. [13] They could not show any difference between
the CD4 percentage or count in their survival curves.
We believe that the surprising power of the absolute lym-
phocyte count in predicting the time to an AIDS-related
event stems both from the lymphopenia seen in malnutri-
tion associated with advanced AIDS as well as the deple-
tion of the CD4 positive population. Since the
management of AIDS is dependent on CD4 enumeration,
we do not advocate the use of the absolute lymphocyte
count as a predictor of AIDS-related events.
We analyzed our data graphically in Figure 1 in order to
show the distribution of the time to event for any given
CD4 measurement. Figure 1 is divided into pre and post
1995 patients to give a more relevant analysis for the
present effective therapy era. As expected, there is a con-
siderable scatter in the number of months to an event for
any given CD4 measurement, but the pairs of curves for
CD4 percentage and CD4 absolute count are similar in
shape when compared for both time periods. The F statis-
tic shows that the fit is better in both cases when the CD4
percentage is plotted against the time to event.
The average slopes of the pre-1995 curves are steeper than
the post-1995 curves. This is most evident when the CD4
absolute curves are compared (1A and 1C). Why is an
event more likely for a given CD4 value after 1995? Since
these curves record only those patients who attained an
event endpoint, the post-1995 curves represent those
patients who probably were not compliant with their
medication and who may have engaged in activities which
increased their probability of reaching an event. The pre-
1995 curves include patients who were taking no medica-
tion or relatively ineffective medication. Compliance
issues were therefore less important and the pre-1995
curves probably reflect a broader cross-section of our
patients.
Conclusion
The time interval between laboratory testing and the
development of an AIDS-related disease is adequately pre-
dicted by the CD4 percentage when our 218 patients are
taken as a whole. When different subsets are examined,
the CD4 percentage is better or equal to the CD4 absolute
count with the exception of those with a CD4 count below
201. In that subset the CD4 absolute count is the best pre-
dictor, but the CD4 percentage is still an accurate predic-
tor.
We conclude that the CD4 percentage may be used
instead of the CD4 count to predict the time to an AIDS-
related event. The extra work and expense of the CD4
absolute count determination may not be necessary.
Abbreviations
CD Clusters of differentiation
HIV Human immunodeficiency virus
Competing interests
The author(s) declare that they have no competing inter-
ests.
Authors' contributions
All authors have read and approved the final manuscript.
References
1. CDC: CD4 and T-cell determinations. Report of results for
the performance evaluations survey conducted in October
2003. CDC model performance evaluation program .
2. Malone JL, Simms TE, Gray GC, Wagner KF, Burge JR, Burke DS:
Sources of variability in repeated T-helper lymphocyte
counts from human immunodeficiency virus type 1-infected
patients: Total lymphocyte count fluctuations and diurnal
cycle are important. J Acquired Immune Deficiency Syndromes 1990,
3:144-151.
3. CDC: Revised classification system for HIV infection and
expanded surveillance case definition for AIDS among ado-
lescents and adults. MMWR 1992, 41:RR-17.
4. CDC: Guidelines for preventing opportunistic infections
among HIV-infected persons-2002. MMWR 2002, 55:RR-08.
5. Stein DS, Korvick JA, Vermund SH: CD4+ lymphocyte cell enu-
meration for prediction of clinical course of human immun-
odeficiency virus disease: a review. J Infect Diseases 1992,
165:352-363.
6. Masur H, Ognibene FP, Yarchoan R, Shelhamer JH, Baird BF, Travis
W, Suffredini AF, Deyton L, Kovacs JA, Falloon J, Davey R, Polis M,
Metcalf J, Baseler M, Wesley R, Gill V, Fauci A, Lane HC: CD4 counts
as predictors of opportunistic pneumonias in human immu-
nodeficiency virus (HIV) infection. Ann Int Med 1989,
111:223-231.
7. Burcham J, Marmor M, Dubin N, Tindall B, Cooper DA, Berry G,
Penny R: CD4% is the best predictor of development of AIDS
in a cohort of HIV-infected homosexual men. AIDS 1991,
5:365-372.
Publish with BioMed Central and every
scientist can read your work free of charge
"BioMed Central will be the most significant development for
disseminating the results of biomedical research in our lifetime."
Sir Paul Nurse, Cancer Research UK
Your research papers will be:
available free of charge to the entire biomedical community
peer reviewed and published immediately upon acceptance
cited in PubMed and archived on PubMed Central
yours — you keep the copyright
Submit your manuscript here:
/>BioMedcentral
AIDS Research and Therapy 2006, 3:20 />Page 6 of 6
(page number not for citation purposes)
8. Hulgan T, Raffanti S, Kheshti A, Blackwell RB, Rebeiro PF, Barkanic G,
Ritz B, Sterling TR: CD4 lymphocyte percentage predicts dis-
ease progression in HIV-infected patients initiating highly
active antiretroviral therapy with CD4 lymphocyte counts
>350 lymphocytes/mm
3
. J Infect Diseases 2005, 192:950-957.
9. Cox DR, Snell EJ: The analysis of binary data. 2nd edition. Lon-
don: Chapman & Hall; 1989.
10. Beck EJ, Kupek EJ, Gompels MM, Pinching AJ: Correlation between
total and CD4 lymphocyte counts in HIV infection: not mak-
ing the good an enemy of the not so perfect. Int J STD AIDS
1996, 7:422-428.
11. Gebo KA, Gallant JE, Keruly JC, Moore RD: Absolute CD4 vs CD4
percentage for predicting the risk of opportunistic illness in
HIV infection. J Acquir Immune Defic Syndrome 2004, 36:1028-1033.
12. CDC: 1993 Revised classification system for HIV infection
and expanded surveillance case definition for AIDS among
adolescents and adults. MMRW 1992, 41:RR-17.
13. Bonnet F, Thiebaut R, Chene G, Nean D, Pellegrin JL, Mercie P, Beylot
J, Dabis F, Salamon R, Morlat P, Groupe d'Epidemiologic Clinicque du
SIDA en Aquitaine (GECSA): Determinants of clinical progres-
sion in antiretroviral-naïve HIV-infected patients starting
highly active antiretroviral therapy. Aquitaine Cohort,
France 1996–2002. HIV Medicine 2005, 6:198-205.