Báo cáo y học: "Utilization and spending trends for antiretroviral medications in the U.S. Medicaid program from 1991 to 2005" docx
Bạn đang xem bản rút gọn của tài liệu. Xem và tải ngay bản đầy đủ của tài liệu tại đây (314.48 KB, 8 trang )
BioMed Central
Page 1 of 8
(page number not for citation purposes)
AIDS Research and Therapy
Open Access
Research
Utilization and spending trends for antiretroviral medications in the
U.S. Medicaid program from 1991 to 2005
Yonghua Jing
1
, Patricia Klein
1
, Christina ML Kelton
2
, Xing Li
1
and
Jeff J Guo*
1,3,4
Address:
1
College of Pharmacy, University of Cincinnati Medical Center, Cincinnati, Ohio, USA,
2
College of Business, University of Cincinnati,
Cincinnati, Ohio, USA,
3
Institute for the Study of Health, University of Cincinnati, Cincinnati, Ohio, USA and
4
Professor of Pharmacoeconomics
& Pharmacoepidemiology, Division of Pharmacy Practice and Administrative Sciences, University of Cincinnati College of Pharmacy, 3225 Eden
Ave., Cincinnati, OH 45267-0004, USA
Email: Yonghua Jing - ; Patricia Klein - ; Christina ML Kelton - ;
Xing Li - ; Jeff J Guo* -
* Corresponding author
Abstract
Background: HIV/AIDS incidence and mortality rates have decreased in the U.S. since 1996.
Accompanying the longer life spans of those diagnosed with the disease, however, is a tremendous
rise in expenditures on medication. The objective of this study is to describe the trends in
utilization of, spending on, and market shares of antiretroviral medications in the U.S. Medicaid
Program. Antiretroviral drugs include nucleoside reverse transcriptase inhibitors (NRTIs),
protease inhibitors (PIs), nonnucleoside reverse transcriptase inhibitors (NNRTIs), and fusion
inhibitors (FIs).
Methods: Utilization and payment data from 1991 to 2005 are provided by the Centers for
Medicare & Medicaid Services. Descriptive summary analyses were used to assess quarterly
prescription numbers and amounts of payment.
Results: The total number of prescriptions for antiretrovirals increased from 168,914 in 1991 to
2.0 million in 1998, and 3.0 million in 2005, a 16.7-fold increase over 15 years. The number of
prescriptions for NRTIs reached 1.6 million in 2005. Prescriptions for PIs increased from 114 in
1995 to 932,176 in 2005, while the number of prescriptions for NNRTIs increased from 1,339 in
1996 to 401,272 in 2005. The total payment for antiretroviral drugs in the U.S. Medicaid Program
increased from US$ 30.6 million in 1991 to US$ 1.6 billion in 2005, a 49.8-fold increase. In 2005,
NRTIs as a class had the highest payment market share. These drugs alone accounted for US$ 787.9
million in Medicaid spending (50.8 percent of spending on antiretrovirals). Payment per prescription
for each drug, with the exception of Agenerase
®
, increased, at least somewhat, over time. The
relatively expensive drugs in 2005 included Trizivir
®
($1040) and Combivir
®
($640), as well as
Reyataz
®
($750), Lexiva
®
($700), Sustiva
®
($420), Viramune
®
($370), and Fuzeon
®
($1914).
Conclusion: The tremendous growth in antiretroviral spending is due primarily to rising
utilization, secondarily to the entry of newer, more expensive antiretrovirals, and, finally, in part to
rising per-prescription cost of existing medications.
Published: 16 October 2007
AIDS Research and Therapy 2007, 4:22 doi:10.1186/1742-6405-4-22
Received: 2 June 2007
Accepted: 16 October 2007
This article is available from: />© 2007 Jing et al; licensee BioMed Central Ltd.
This is an Open Access article distributed under the terms of the Creative Commons Attribution License ( />),
which permits unrestricted use, distribution, and reproduction in any medium, provided the original work is properly cited.
AIDS Research and Therapy 2007, 4:22 />Page 2 of 8
(page number not for citation purposes)
Background
Since the first reported case in June 1981, approximately
1.7 million people in the United States have been infected
with HIV, including more than 550,000 who have already
died and an estimated 1.2 million living with HIV/AIDS
in 2005 [1-4]. AIDS cases increased rapidly in the 1980s
and peaked in 1992 (an estimated 78,000 cases diag-
nosed) before stabilizing in 1998; since then, approxi-
mately 40,000 AIDS cases have been diagnosed annually,
although, over the last several years, there is some indica-
tion that diagnoses are again on the rise [5]. The HIV/
AIDS-related mortality rate rose steadily through the
1980s, peaking in 1994–1995 [6] and declining since
then.
There is no known cure for AIDS. Patients infected with
HIV rely on antiretroviral treatment, a life-long disease
management strategy, costing between US$10,000 and
US$15,000 per year [7]. Once drugs from several antiret-
roviral drug classes were available beginning in 1996, the
introduction of therapies incorporating combinations of
drugs from two or three different drug classes has led to a
wide range of possible antiretroviral therapy combina-
tions. These new combinations, often referred to as highly
active antiretroviral therapy (HAART), have been shown
to have a significant impact both on markers of disease
progression (viral load and CD4 T-cell counts) [8-10] and
on HIV/AIDS-associated mortality and morbidity [6,11-
14]. National guidelines for the treatment of HIV infec-
tion recommend HAART as first-choice therapy [15].
Accompanying HAART and the longer survival rates
offered by HAART has been a marked rise in expenditures
on antiretroviral medications. The U.S. Medicaid Program
bears a substantial burden in HIV/AIDS expense coverage,
especially in the latter stages of the disease when individ-
uals are too ill to work. The objective of this study is to
describe the trends of utilization of and spending on
antiretroviral drug classes as well as individual antiretrovi-
ral medications in the U.S. Medicaid Program. These
results provide useful information to policy makers and
health professionals interested in cost-effectiveness and
cost-containment strategies along with their usual con-
cerns of safety and efficacy.
Methods
We study utilization, spending, and market share for each
of the antiretrovirals listed in Table 1[16]. Each drug is
classified as a nucleoside reverse transcriptase inhibitor
(NRTI), a protease inhibitors (PI), a nonnucleoside
reverse transcriptase inhibitor (NNRTI), or a fusion inhib-
itor (FI). Its manufacturer, approval date, and time to
approval (after new drug application submission) are all
identified. Note the relatively short pre-approval periods
for all of the drugs due to the AA priority status for AIDS
therapy applications [17]. (As of 2003, the average time to
approval for all drugs was around one and a half years
[18].)
Retrospective descriptive summary analyses were con-
ducted with the purpose of describing the trends in utili-
zation of and spending on antiretroviral medications over
the last 15 years. Pharmacy utilization and expenditure
data, from 1991 quarter 1 through 2005 quarter 4, were
taken from the national Medicaid pharmacy files pro-
vided by the Centers for Medicare & Medicaid Services
(CMS). These files contain number of outpatient prescrip-
tions and payment amounts for all National Drug Code
(NDC) drug forms paid for by any state (except Arizona,
but including the District of Columbia) Medicaid pro-
gram [19]. The national files are huge databases represent-
ing aggregation across all the states and are subject to
occasional coding error, which we corrected to the best of
our ability. Prescription and expenditure data were then
aggregated across all NDCs for each of the drugs listed in
Table 1. Per-prescription spending (which is referred to
loosely as "price" throughout this article) was calculated
as total expenditure for the drug divided by total number
of prescriptions. Note that per-prescription spending
exceeds actual acquisition cost to Medicaid due to federal
and state rebates received by Medicaid from the drug man-
ufacturers.
Quarterly market shares for four classes of antiretroviral
medications are calculated as both the percentage of total
antiretroviral prescription numbers and the percentage of
total antiretroviral expenditures in the U.S. Medicaid mar-
ket. We refer to these market shares as the prescription
market share and the payment market share, respectively.
All expenditure values are expressed in current U.S. dol-
lars.
Results
The total number of antiretroviral prescriptions paid for
by Medicaid increased from 168,914 in 1991 to 3.0 mil-
lion in 2005, showing a 16.7-fold increase over 15 years
(see Table 2). In 1996, and again in 1997, utilization of
antiretrovirals increased by more than 100 percent in a
single year. The number of prescriptions for NRTIs
increased from 168,914 in 1991 to 1.6 million in 2005.
Prescriptions for PIs increased from 114 in 1995 to
932,176 in 2005. The number of prescriptions for NNRTIs
increased from 1,339 in 1996 to 401,272 in 2005. The
prescriptions for the most recent class of antiretrovirals,
the FIs, increased from 6,683 in 2003 to 20,391 in 2005,
representing a 205.1 percent increase in just two years. As
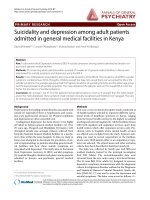
shown in Figure 1, in 2005 quarter 4, the three NRTI mar-
ket leaders were Viread
®
with 62,513 prescriptions, Com-
bivir
®
with 56,735 prescriptions, and Truvada
®
with
54,788 prescriptions. Included in "Other NRTIs" (each
AIDS Research and Therapy 2007, 4:22 />Page 3 of 8
(page number not for citation purposes)
Table 1: Antiretroviral Medications Purchased by the U.S. Medicaid Program from 1991 to 2005
Brand Name Generic Name(s) Manufacturer Approval Date Time to Approval
Nucleoside Reverse Transcriptase Inhibitors (NRTIs)
Combivir lamivudine and zidovudine GlaxoSmithKline 27-Sep-97 3.9 months
Emtriva emtricitabine, FTC Gilead Sciences 02-Jul-03 10 months
Epivir lamivudine, 3TC GlaxoSmithKline 17-Nov-95 4.4 months
Epzicom abacavir and lamivudine GlaxoSmithKline 02-Aug-04 10 months
Hivid zalcitabine, dideoxycytidine, ddC Hoffmann-La Roche 19-Jun-92 7.6 months
Retrovir zidovudine, azidothymidine, AZT, ZDV GlaxoSmithKline 19-Mar-87 3.5 months
Trizivir abacavir, zidovudine, and lamivudine GlaxoSmithKline 14-Nov-00 10.9 months
Truvada tenofovir disoproxil fumarate and emtricitabine Gilead Sciences, Inc. 02-Aug-04 5 months
Videx EC enteric coated didanosine, ddI EC Bristol Myers-Squibb 31-Oct-00 9 months
Videx didanosine, dideoxyinosine, ddI Bristol Myers-Squibb 9-Oct-91 6 months
Viread tenofovir disoproxil fumarate, TDF Gilead 26-Oct-01 5.9 months
Zerit stavudine, d4T Bristol Myers-Squibb 24-Jun-94 5.9 months
Ziagen abacavir sulfate, ABC GlaxoSmithKline 17-Dec-98 5.8 months
Protease Inhibitors (PIs)
Agenerase amprenavir, APV GlaxoSmithKline 15-Apr-99 6 months
Aptivus tipranavir, TPV Boehringer Ingelheim 22-Jun-05 6 months
Crixivan indinavir, IDV Merck 13-Mar-96 1.4 months
Fortovase saquinavir (no longer marketed) Hoffmann-La Roche 7-Nov-97 5.9 months
Invirase saquinavir mesylate, SQV Hoffmann-La Roche 6-Dec-95 3.2 months
Kaletra lopinavir and ritonavir, LPV/RTV Abbott Laboratories 15-Sep-00 3.5 months
Lexiva Fosamprenavir Calcium, FOS-APV GlaxoSmithKline 20-Oct-03 10 months
Norvir ritonavir, RTV Abbott Laboratories 1-Mar-96 2.3 months
Reyataz atazanavir sulfate, ATV Bristol-Myers Squibb 20-Jun-03 6 months
Viracept nelfinavir mesylate, NFV Agouron Pharmaceuticals 14-Mar-97 2.6 months
Nonnucleoside Reverse Transcriptase Inhibitors (NNRTIs)
Rescriptor delavirdine, DLV Pfizer 4-Apr-97 8.7 months
Sustiva efavirenz, EFV Bristol Myers-Squibb 17-Sep-98 3.2 months
Viramune nevirapine, NVP Boehringer Ingelheim 21-Jun-96 3.9 months
Fusion Inhibitors
Fuzeon enfuvirtide, T-20 Hoffmann-La Roche & Trimeris 13-Mar-03 6 months
Source: Food And Drug Administration: [16]
Table 2: Annual Medicaid Prescriptions and Prescription Market Shares for Antiretroviral Medications: 1991 – 2005
Year Number of Prescriptions Prescription Market Share
Annual
Rx
Percent
Annual
Increase
NNRTI NRTI PI FI NNRTI NRTI PI FI
1991 168,914 168,914 100.0
1992 278,873 65.1 278,873 100.0
1993 354,082 27.0 354,082 100.0
1994 267,411 -24.5 267,411 100.0
1995 329,843 23.3 329,729 114 100.0
1996 792,949 140.4 1,339 665,261 126,349 0.2 83.9 15.9
1997 1,656,122 108.9 59,742 1,109,954 486,426 3.6 67.0 29.4
1998 1,985,866 19.9 140,839 1,162,838 682,189 7.1 58.6 34.4
1999 2,167,620 9.2 277,094 1,246,271 644,255 12.8 57.5 29.7
2000 2,345,000 8.2 346,993 1,342,463 655,544 14.8 57.2 28.0
2001 2,510,715 7.1 369,722 1,447,701 693,292 14.7 57.7 27.6
2002 2,588,815 3.1 381,667 1,571,995 635,153 14.7 60.7 24.5
2003 2,793,043 7.9 425,868 1,713,116 647,376 6,683 15.2 61.3 23.2 0.2
2004 3,068,032 9.8 426,253 1,780,188 844,116 17,475 13.9 58.0 27.5 0.6
2005 2,988,138 -2.6 401,272 1,634,299 932,176 20,391 13.4 54.7 31.2 0.7
Source: Centers for Medicare & Medicaid Services: State drug utilization data. [27].
AIDS Research and Therapy 2007, 4:22 />Page 4 of 8
(page number not for citation purposes)
with no more than 17,000 prescriptions in 2005 quarter
4) are the two original NRTIs, Retrovir
®
and Videx
®
, which
still play some role in the Medicaid market. In 2005 quar-
ter 4, Medicaid prescriptions for Retrovir
®
totaled 9,970,
while those for Videx
®
plus didanosine totaled 28,213.
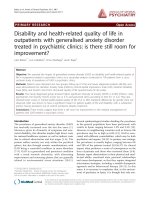
Figure 2 shows the three PI market leaders. In 2005 quar-
ter 4, there were 58,605 prescriptions for Norvir
®
, 56,327
prescriptions for Kaletra
®
, and 51,973 prescriptions for
Reyataz
®
. Most of the "Other PIs" (again, each with no
more than 17,000 prescriptions in 2005 quarter 4), with
the exception of the newest entrant Aptivus
®
, have experi-
enced a declining number of prescriptions over time, as
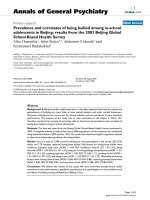
can be seen in Figure 2. Finally, Figure 3 identifies Sustiva
®
as the NNRTI market leader in 2005.
Total U.S. Medicaid expenditure on antiretroviral medica-
tions increased from US$ 30.6 million in 1991 to US$ 1.6
billion in 2005, a 49.8-fold increase (Table 3). In 2005,
NRTIs as a class had the highest payment market share,
accounting for US$ 787.9 million in Medicaid spending
(50.8 percent of total spending on antiretrovirals). PIs
came in second at US$ 563.5 million (36.3 percent), and
NNRTIs were third at US$ 161.6 million (10.4 percent of
spending). As of 2005, the FI class accounted for only a
2.5 percent payment market share. Figures 4, 5, and 6
show the trend of payments for each drug in the NRTI, PI,
and NNRTI classes, respectively; these figures tell a similar
story to that of Figures 1, 2, and 3. The three most costly
NRTIs in 2005 quarter 4 were Truvada®, Combivir®, and
Viread® (Figure 4). When the first generic antiretroviral,
didanosine (for Videx®), became available in 2004, the
spending on Videx® decreased from US$ 8.6 million in
the fourth quarter of 2004 to US$ 2.6 million in the
fourth quarter of 2005. (Note that Videx® is not shown
individually in Figure 4; it is part of the category "Other
NRTIs.") Meanwhile, the spending on generic didanosine
(also among the "Other NRTIs") increased from US$
15,207 in the fourth quarter of 2004 to US$ 3.2 million in
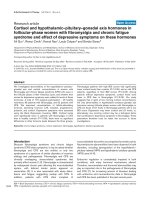
the fourth quarter of 2005. The three most costly PIs in
2005 were Reyataz®, Kaletra®, and Norvir® (Figure 5),
while Sustiva® was the market leader in the NNRTI class.
The spending on Sustiva® increased from US$ 3,431 in the
third quarter of 1998 to US$ 27.0 million in the fourth
quarter of 2005 (Figure 6). In 2005, Sustiva® accounted
for US$ 114.3 million in Medicaid spending (70.7 percent
of spending on NNRTIs) over four quarters.
The average payment per prescription for NRTIs increased
from US$ 181 in 1991 to US$ 482 in 2005 (Table 4). The
average per-prescription payment for PIs increased from
US$ 474 in 1995 to US$ 605 in 2005. The average for
Utilization of NNRTI Antiretrovirals by Quarter in Medicaid: 1991–2005Figure 3
Utilization of NNRTI Antiretrovirals by Quarter in Medicaid:
1991–2005.
0
10,000
20,000
30,000
40,000
50,000
60,000
70,000
80,000
1991Q1 1993Q1 1995Q1 1997Q1 1999Q1 2001Q1 2003Q1 2005Q1
Year and Quarter
Numbe r ofPrescr iptio ns
Rescriptor®
Sustiva®
Viramune®
Utilization of NRTI Antiretrovirals by Quarter in Medicaid: 1991–2005Figure 1
Utilization of NRTI Antiretrovirals by Quarter in
Medicaid: 1991–2005. Note: Other NRTIs include didano-
sine, Emtriva
®
, Hivid
®
, Retrovir
®
, and Videx
®
.
0
20,000
40,000
60,000
80,000
100,000
120,000
140,000
1991Q1 1993Q1 1995Q1 1997Q1 1999Q1 2001Q1 2003Q1 2005Q1
Year and Quarter
Number of Pr escriptions
Combivir®
Epivir®
Epzicom®
Trizivir®
Truvada®
Viread®
Zerit®
Ziagen®
Other NRTIs
Utilization of PI Antiretrovirals by Quarter in Medicaid: 1991–2005Figure 2
Utilization of PI Antiretrovirals by Quarter in Medic-
aid: 1991–2005. Note: Other PIs include Agenerase
®
, Apti-
vus
®
, Crixivan
®
, and Invirase/Fortovase
®
.
0
10,000
20,000
30,000
40,000
50,000
60,000
70,000
80,000
90,000
100,000
1991Q1 1993Q1 1995Q1 1997Q1 1999Q1 2001Q1 2003Q1 2005Q1
Year and Quarter
Number of Prescriptions
Kaletra®
Lexiva®
Norvir®
Reyataz®
Viracept®
Other PIs
AIDS Research and Therapy 2007, 4:22 />Page 5 of 8
(page number not for citation purposes)
NNRTIs increased from US$ 240 in 1996 to US$ 403 in
2005. The newest antiretroviral medication, Fuzeon®,
entered the Medicaid market with a very high price (US$
1784 in 2003); the price increased to US$ 1914 by 2005.
Spending per prescription for individual drugs can be cal-
culated straightforwardly by dividing spending (Figure 4,
5, or 6) by number of prescriptions (Figure 1, 2, or 3). At
the beginning of the study period, a single NRTI (Retro-
vir®) had payment per prescription of US$ 180 (slightly
below the US$ 200 price point). As newer NRTIs entered
the market, they did so around the US$ 200 level. How-
ever, four of the more recent NRTIs entered at higher price
points (Viread® and Ziagen® at around the US$ 400 level,
Combivir® at approximately the US$ 600 level, and
Trizivir® at around the US$ 900 level). The two most
recent entries, Truvada® in 2004 quarter 3 and Epzicom®
in 2004 quarter 4, entered at US$ 714 and US$ 674,
respectively. Once an NRTI enters the market, its per-pre-
scription payment is seen to rise over time, though not
that rapidly. For example, since Trizivir's® entry in 2000
quarter 4, its price has risen 21.4 percent (as of 2005 quar-
ter 4). Over the same five years, the price of Retrovir® has
risen 10.5 percent. In some ways, the prices in the PI class
have behaved similarly to those of the NRTIs. We see,
though with more variability over time, the upward trend
in individual prices, except for Viracept ® (high initial
price, followed by a considerable price drop, followed by
Payment for PI Antiretrovirals by Quarter inMedicaid: 1991–2005Figure 5
Payment for PI Antiretrovirals by Quarter inMedic-
aid: 1991–2005. Note: Other PIs include Agenerase
®
, Apti-
vus
®
, Crixivan
®
, and Invirase/Fortovase
®
.
$0
$5
$10
$15
$20
$25
$30
$35
$40
$45
1991Q1 1993Q1 1995Q1 1997Q1 1999Q1 2001Q1 2003Q1 2005Q1
Year and Quarter
Medicaid Payment in Mi ll ions of U.S. Dol lars
Kaletra®
Lexiva®
Norvir®
Reyataz®
Viracept®
Other PIs
Table 3: Annual Medicaid Payments and Payment Market Shares for Antiretroviral Medications: 1991 – 2005
Year Payment Amounts Payment Market Share
Annual Amount ($) Percent Annual
Increase
NNRTI NRTI PI FI NNRTI NRTI PI FI
1991 30,581,688 30,581,688 100.0
1992 49,145,345 60.7 49,145,345 100.0
1993 62,163,949 26.5 62,163,949 100.0
1994 48,314,392 -22.3 48,314,392 100.0
1995 62,667,235 29.7 62,613,187 54,047 99.9 0.1
1996 192,066,249 206.5 321,552 134,207,229 57,537,468 0.2 69.9 30.0
1997 460,706,553 139.9 13,537,612 237,889,361 209,279,580 2.9 51.6 45.4
1998 612,308,495 32.9 33,374,299 294,685,007 284,249,188 5.5 48.1 46.4
1999 717,516,585 17.2 80,748,122 358,063,912 278,704,550 11.3 49.9 38.8
2000 799,546,390 11.4 105,358,639 417,270,377 276,917,374 13.2 52.2 34.6
2001 936,652,425 17.1 115,254,370 501,229,292 320,168,762 12.3 53.5 34.2
2002 1,073,255,281 14.6 129,858,945 618,622,608 324,773,728 12.1 57.6 30.3
2003 1,190,098,926 10.9 153,303,569 689,086,945 335,785,345 11,923,067 12.9 57.9 28.2 1.0
2004 1,452,823,690 22.1 165,523,923 741,094,660 513,999,395 32,205,713 11.4 51.0 35.4 2.2
2005 1,552,004,168 6.8 161,640,662 787,864,253 563,473,942 39,025,310 10.4 50.8 36.3 2.5
Source: Centers for Medicare & Medicaid Services: State drug utilization data. [27].
Payment for NRTI Antiretrovirals by Quarter in Medicaid: 1991–2005Figure 4
Payment for NRTI Antiretrovirals by Quarter in
Medicaid: 1991–2005. Note: Other NRTIs include didano-
sine, Emtriva
®
, Hivid
®
, Retrovir
®
, and Videx
®
.
$0
$5
$10
$15
$20
$25
$30
$35
$40
$45
$50
1991Q1 1993Q1 1995Q1 1997Q1 1999Q1 2001Q1 2003Q1 2005Q1
Year and Quarter
Medicaid Payment in Millions of U.S. Dollars
Combivir®
Epivir®
Epzicom®
Trizivir®
Truvada®
Viread®
Zerit®
Ziagen®
Other NRTIs
AIDS Research and Therapy 2007, 4:22 />Page 6 of 8
(page number not for citation purposes)
a gradual increase over time), and Norvir® (gradual
decrease in price, followed by an abrupt price increase in
2004 quarter 1 and then followed by again a gradual
decline). In 2005 quarter 4, prices for a drug in the PI class
ranged from a little less than US$ 300 (Agenerase®) to
US$ 926 (Aptivus®, the latest entry to the PI class in 2005
quarter 3). (Neither of these drugs is featured individually
but contributes to the category "Other PIs.") Similarly to
the NRTIS, the later PI entrants (such as Lexiva®, Kaletra®,
and Reyataz®, and certainly Aptivus®) have entered at
higher price points than their earlier counterparts. Finally,
the data tell a similar story for the NNRTIs. Sustiva®, mar-
ket leader and latest entrant to the market, entered at a
higher price than either Rescriptor® (ignoring its price in
the first quarter for Medicaid) or Viramune®. Each of the
three drugs has shown a price increase over time. Since
1998 quarter 3, Rescriptor® has had a price increase of
37.3 percent, Sustiva® of 24.2 percent, and Viramune® of
62.0 percent, as of 2005 quarter 4.
Discussion
In the preceding section, we showed a substantial rise in
Medicaid expenditures on antiretroviral medications.
While most of that rise can be explained by the rise in uti-
lization of antiretroviral medicines (this utilization
increase is observed in the face of decreasing or stable
HIV/AIDS incidence rates in the U.S.), some is certainly
attributable to both the entry of newer, more expensive
drugs in all of the antiretroviral drug classes and price
increases of drugs once they are being marketed.
The first factor driving the increase in Medicaid prescrip-
tions over the past decade and a half is the move from
monotherapy to combination therapy. In a short period
of time after the approval of the PIs, HAART became the
standard treatment for those infected with HIV, implying
an increase in the use of double- and, more recently, tri-
ple-combination antiretroviral therapy regimens, with
drugs across antiretroviral drug classes, among HIV-
infected persons. Medicaid patients consistently, however,
have lower use rates for the newer antiretroviral drugs
than the general population [20,21]; estimates for various
states indicate that HAART use among HIV-positive
patients on Medicaid in 1998 ranged from 37 percent in
Texas to almost 70 percent in New Jersey [22,23].
Secondly, rising utilization can be explained by declining
mortality rates, leading to individuals' requiring more pre-
scriptions over life's course. Using data from a random-
assignment clinical trial, it was found that those assigned
HAART therapy had a 58 percent lower mortality rate than
those in the control group [24]. Survival data for patients
in non-experimental settings have demonstrated that
patients using HAART therapy have substantially lower
mortality rates than those not using it.
During the study period, more than twenty marketed
antiretrovirals were supplied by nine manufacturers. The
data indicate that new entry occurs over time at higher and
higher price points. Price differences among the antiretro-
virals are explained to some degree by differences in effec-
tiveness and safety profiles. Newer drugs that offer added
dosing convenience and improved safety profiles are
priced higher than previously popular drugs that are being
used less often as their drawbacks become better defined
and drug resistance is developed [15]. The data indicate as
Table 4: Annual Medicaid Payment per Prescription for
Antiretroviral Medications: 1991 – 2005
Year Average Per-Rx $ Payment
NNRTI NRTI PI FI
1991 181.0
1992 176.2
1993 175.6
1994 180.7
1995 189.9 474.1
1996 240.1 201.7 455.4
1997 226.6 214.3 430.2
1998 237.0 253.4 416.7
1999 291.4 287.3 432.6
2000 303.6 310.8 422.4
2001 311.7 346.2 461.8
2002 340.2 393.5 511.3
2003 360.0 402.2 518.7 1784.1
2004 388.3 416.3 608.9 1843.0
2005 402.8 482.1 604.5 1913.8
Source: Centers for Medicare & Medicaid Services: State drug
utilization data. [27]
Payment for NNRTI Antiretrovirals by Quarter in Medicaid: 1991–2005Figure 6
Payment for NNRTI Antiretrovirals by Quarter in Medicaid:
1991–2005.
$0
$5
$10
$15
$20
$25
$30
$35
1991Q1 1993Q1 1995Q1 1997Q1 1999Q1 2001Q1 2003Q1 2005Q1
Year and Quarter
Medicaid P aym ent in Millions of U.S. Do llars
Rescriptor®
Sustiva®
Viramune®
AIDS Research and Therapy 2007, 4:22 />Page 7 of 8
(page number not for citation purposes)
well that payment per prescription has risen over time for
existing drugs in the market. The rising demand generated
by both combination therapy and higher survival rates
has overwhelmed any downward pressures on price.
Once a drug goes off patent, generic versions of the drug
quickly enter the market. The number of entrants depends
on the size of the market. A large number of generic pro-
ducers will ideally drive price down to a level that is close
to marginal cost. However, while didanosine (since 2004
quarter 4) and zidovudine (since 2005 quarter 4) are now
available as generic drugs, low-cost versions of these two
NRTIs have not yet made a big impact on the expenditure
on antiretroviral medication for Medicaid. At this point,
there are very few generic manufacturers. As of 2005 quar-
ter 4, only one generic producer supplied didanosine to
Medicaid. In 2005 quarter 4, the number of prescriptions
for Videx
®
(including Videx EC
®
) was still 12,128 (pay-
ment per prescription was $218). Comparatively, the
number of prescriptions for the generic form of Videx
®
,
didanosine, was 16,085; spending per prescription was
$201, not much lower than the brand-name price. Four
generic producers sold zidovudine in 2005 quarter 4. That
quarter, the average price of zidovudine, across the four
manufacturers and all their NDCs, was $211. Compared
to the price of Retrovir
®
, $248, the generic producers were
selling their drug for 85 percent of the brand-name price.
Study limitations
Drug use was inferred from aggregate prescription data,
themselves based on adding up prescriptions and pay-
ments from Medicaid claims data; it was not possible to
review patient-specific clinical information. We were una-
ble to analyze the use of antiretrovirals as a function of
disease treated, and unable to link the utilization with
patient demographics or history of clinical conditions and
comorbidities. We did not link the utilization of antiretro-
virals to the prevalence rate of HIV or AIDS.
Policy implications
Medicaid plays a critical role in financing AIDS care by
providing a comprehensive benefit package that includes
prescription drugs [25]. The rising cost of antiretroviral
medications has been a significant challenge for all state
Medicaid programs in the United States. Because the
antiretrovirals are protected by patents, with the recent
exceptions of didanosine and zidovudine, aggressive
generic substitution policies cannot be implemented to
reduce Medicaid spending for this class of drugs. Other
policies, however, include preferred drug lists, prior
authorization, copays, and generally tighter controls on
high-cost drugs [26]. Some states, including California
and Florida, both of which are among the top three states
in terms of numbers of people with HIV/AIDS, are look-
ing to increase substantially copays for certain groups of
individuals on Medicaid. With the relatively high number
of prescriptions people with HIV/AIDS need to fill, how-
ever, such a copay increase could constitute a significant
barrier to obtaining all the drugs they need [26].
From 2001 through 2004, there were 5,660 new HIV/
AIDS diagnoses reported to the Centers for Disease Con-
trol for persons 60 years old or older [3]. Moreover, one
consequence of the expanded life span offered by antiret-
roviral treatment is that more elderly individuals will be
coping with HIV/AIDS in the future. With the January
2006 implementation of a Medicare Part D prescription
drug benefit, older people living with HIV/AIDS will be
able to receive drug coverage from Medicare. Though
drugs will be paid for differently under Medicare, Medic-
aid's experience with antiretrovirals during the last 15
years may shed some light on what will happen to Medi-
care spending over the next decade and a half, at least for
this relatively small component of the overall Medicare
budget.
Conclusion
In this paper, we have documented the rise in spending on
antiretrovirals by the U.S. Medicaid Program since 1991.
We have shown that although most of the rise can be
explained by rising utilization, some is due to rising prices
of both newer medications and those already established
in the market. Medicaid will struggle for many years to
come to keep costs contained to the greatest extent possi-
ble, making sure that access to drugs is not compromised.
While there may be some relief from generic medications,
the rate of innovation remains strong in the antiretroviral
drug class, and we predict that, at least for the near future,
costs will keep rising.
Competing interests
The author(s) declare that they have no competing inter-
ests.
Authors' contributions
YJ, JJG, and CMLK designed the study. YJ, PK, and XL ana-
lyzed the data. All five authors drafted and approved this
version of the manuscript.
Acknowledgements
This study was presented at the American Pharmaceutical Association
Annual Meeting, San Francisco, CA, USA, March 17–21, 2006, and at the
Annual Meeting of the International Society for Pharmacoeconomics and
Outcomes Research, Arlington, VA, USA, May 19–22, 2007.
References
1. Centers for Disease Control and Prevention: Pneumocystis pneu-
monia-Los Angeles. MMWR 1981, 30:250-252.
2. The Kaiser Family Foundation: Fact sheet: the HIV/AIDS epi-
demic in the United States. [ />3029.cfm].
Publish with BioMed Central and every
scientist can read your work free of charge
"BioMed Central will be the most significant development for
disseminating the results of biomedical research in our lifetime."
Sir Paul Nurse, Cancer Research UK
Your research papers will be:
available free of charge to the entire biomedical community
peer reviewed and published immediately upon acceptance
cited in PubMed and archived on PubMed Central
yours — you keep the copyright
Submit your manuscript here:
/>BioMedcentral
AIDS Research and Therapy 2007, 4:22 />Page 8 of 8
(page number not for citation purposes)
3. Centers for Disease Control and Prevention: Epidemiology of
HIV/AIDS-United States, 1981–2005. MMWR 2006,
55(21):589-592.
4. Centers for Disease Control and Prevention: HIV/AIDS surveil-
lance report 2004. 2005 [ />lance/resources/reports/2004report/default.htm]. Atlanta, Georgia
5. Glynn MK, Rhodes P: Estimated HIV prevalence in the United
States at the end of 2003. Presentation National HIV Prevention Con-
ference 2005.
6. National Center for Health Statistics: Health, United States.
2005.
7. Yazdanpanah Y: Costs associated with combination antiretro-
viral therapy in HIV-infected patients. J Antimicrob Chemother
2004, 53:558-561.
8. Collier AC, Coombs RW, Schoenfeld DA, Bassett RL, Timpone J,
Baruch A, Jones M, Facey K, Whitacre C, McAuliffe VJ, Friedman HM,
Merigan TC, Reichman RC, Hooper C, Corey L: Treatment of
human immunodeficiency virus infection with saquinavir,
zidovudine, and zalcitabine. N Engl J Med 1996,
334(16):1011-1017.
9. Cameron DW, Heath-Chiozzi M, Danner S, Cohen C, Kravcik S,
Maurath C, Sun E, Henry D, Rode R, Potthoff A, Leonard J: Ran-
domised placebo-controlled trial of ritonavir in advanced
HIV-1 disease. Lancet 1998, 351:543-549.
10. Weverling GJ, Lange JM, Jurriaans S, Prins JM, Lukashov VV, Noter-
mans DW, Roos M, Schuitemaker H, Hoetelmans RM, Danner SA,
Goudsmit J, de Wolf F: Alternative multidrug regimen provides
improved suppression of HIV-1 replication over triple ther-
apy. AIDS 1998, 12:F117-F122.
11. Hoyert DL, Heron MP, Murphy SL, Kung HC: Deaths: final data for
2003. Natl Vital Stat Rep 2006, 54(13):1-120.
12. Coombs RW, Welles SL, Hooper C, Reichelderfer PS, D'Aquila RT,
Japour AJ, Johnson VA, Kuritzkes DR, Richman DD, Kwok S, Todd J,
Jackson JB, DeGruttola V, Crumpacker CS, Kahn J: Association of
plasma human immunodeficiency virus type 1 RNA level
with risk of clinical progression in patients with advanced
infection. AIDS Clinical Trials Group (ACTG) 116B/117
Study Team. ACTG Virology Committee Resistance and
HIV-1 RNA Working Groups. J Infect Dis 1996, 174(4):704-712.
13. Katzenstein DA, Hammer SM, Hughes MD, Gundacker H, Jackson JB,
Fiscus S, Rasheed S, Elbeik T, Reichman R, Japour A, Merigan TC, Hir-
sch MS: The relation of virologic and immunologic markers to
clinical outcomes after nucleoside therapy in HIV-1 infected
adults. N Engl J Med 1996, 335:1091-1098.
14. Cascade Collaboration: Survival after introduction of HAART
in people with known duration of HIV-1 infection. Lancet
2000, 355:1158-1159.
15. Guidelines for the use of antiretroviral agents in HIV-1-
infected adults and adolescents [u-
idelines/GuidelineDetail.aspx?MenuItem=Guide
lines&Search=Off&GuidelineID=7&ClassID=1]. October 10, 2006
16. Food And Drug Administration: [ />scripts/cder/drugsatfda/].
17. Food and Drug Administration: Expanded access and expedited
approval of new therapies related to HIV/AIDS. [http://
www.fda.gov/oashi/aids/expanded.html].
18. Nature reviews drug discovery, 2003 approvals: a year of
innovation and upward trends Nature 2004, 3:103-105 [http://
www.nature.com/drugdisc/news/articles/boxes/nrd1327_bx1.html].
19. Centers for Medicare & Medicaid Services: Medicaid drug rebate
program overview. [ />bateProgram].
20. Bozzette SA, Joyce G, McCaffrey DF, Leibowitz AA, Morton SC,
Berry SH, Rastegar A, Timberlake D, Shapiro MF, Goldman DP, HIV
Cost and Services Utilization Study Consortium: HIV Cost and
Services Utilization Study Consortium. Expenditures for the
care of HIV-infected patients in the era of highly active
antiretroviral therapy. N Engl J Med 2001, 344(11):817-823.
21. Shapiro MF, Morton SC, McCaffrey DF, Senterfitt JW, Fleishman JA,
Perlman JF, Athey LA, Keesey JW, Goldman DP, Berry SH, Bozzette
SA: Variations in the care of HIV-infected adults in the
United States: results from the HIV Cost and Services Utili-
zation Study. JAMA 1999, 281(24):2305-2315.
22. Kahn JG, Zhang X, Cross LT, Palacio H, Birkhead GS, Morin SF:
Access to and use of HIV antiretroviral therapy: variation by
race/ethnicity in two public insurance programs in the U.S.
Public Health Reports 2002, 117(3):252-262. discussion 231–232
23. Sambamoorthi U, Collins S, Crystal S: Dually eligible individuals
with AIDS: characteristics and health services use. J Health
Soc Policy 2001, 14(1):19-35.
24. Hammer SM, Squires KE, Hughes MD, Grimes JM, Demeter LM, Cur-
rier JS, Eron JJ Jr, Feinberg JE, Balfour HH Jr, Deyton LR, Chodakewitz
JA, Fischl MA: A controlled trial of two nucleoside analogues
plus indinavir in persons with human immunodeficiency
virus infection and CD4 cell counts of 200 per cubic millime-
ter or less. N Engl J Med 1997, 337(11):725-733.
25. The Kaiser Family Foundation: Medicaid at a glance. [http://
www.kff.org/medicaid/7235.cfm].
26. An overview of AIDS drug access in the United States [http:/
/www.thebody.com/iapac/may04_suppl/overview.html]
27. Centers for Medicare & Medicaid Services: State drug utilization
data. [ />SDUD/list.asp#TopOfPage].