Báo cáo y học: " The intracellular detection of MIP-1beta enhances the capacity to detect IFN-gamma mediated HIV-1-specific CD8 T-cell responses in a flow cytometric setting pro" ppsx
Bạn đang xem bản rút gọn của tài liệu. Xem và tải ngay bản đầy đủ của tài liệu tại đây (554.35 KB, 13 trang )
BioMed Central
Page 1 of 13
(page number not for citation purposes)
AIDS Research and Therapy
Open Access
Methodology
The intracellular detection of MIP-1beta enhances the capacity to
detect IFN-gamma mediated HIV-1-specific CD8 T-cell responses
in a flow cytometric setting providing a sensitive alternative to the
ELISPOT
Sarah Kutscher
1
, Claudia J Dembek
1
, Simone Allgayer
2,3
, Silvia Heltai
4,5
,
Birgit Stadlbauer
2,8
, Priscilla Biswas
6
, Silvia Nozza
7
, Giuseppe Tambussi
7
,
Johannes R Bogner
9
, Hans J Stellbrink
10
, Frank D Goebel
9
, Paolo Lusso
4
,
Marco Tinelli
11
, Guido Poli
5,12
, Volker Erfle
1,2
, Heike Pohla
2,8
,
Mauro Malnati
4
and Antonio Cosma*
1,2
Address:
1
Institute of Virology, Helmholtz Zentrum München, German Research Center for Environmental Health, 85764 Neuherberg, Germany,
2
Clinical cooperation group "Immune monitoring", Helmholtz Zentrum München, German Research Center for Environmental Health, 85764
Neuherberg, Germany,
3
Institute of Virology, Technical University, 81675 Munich, Germany,
4
Human Virology Unit, San Raffaele Scientific
Institute, 20132 Milan, Italy,
5
AIDS Immunopathogenesis Unit, San Raffaele Scientific Institute, 20132 Milan, Italy,
6
Laboratory of Clinical
Immunology, San Raffaele Scientific Institute, 20132 Milan, Italy,
7
Department of Infectious Diseases, San Raffaele Scientific Institute, 20132
Milan, Italy,
8
Laboratory for Tumor Immunoloy, LIFE-Zentrum, Ludwig-Maximilians-Universität München, 81377 Munich, Germany,
9
Department of Infectious Diseases, Med. Poliklinik, University Hospital of Munich, 80336 Munich, Germany,
10
IPM Study Center, 20146
Hamburg, Germany,
11
Division of Infectious and Tropical Diseases, Hospital of Lodi, 26866 Lodi, Italy and
12
Vita-Salute San Raffaele University,
School of Medicine, 20132, Milano, Italy
Email: Sarah Kutscher - ; Claudia J Dembek - ;
Simone Allgayer - ; Silvia Heltai - ; Birgit Stadlbauer -
muenchen.de; Priscilla Biswas - ; Silvia Nozza - ; Giuseppe Tambussi - ;
Johannes R Bogner - ; Hans J Stellbrink - ;
Frank D Goebel - ; Paolo Lusso - ; Marco Tinelli - ;
Guido Poli - ; Volker Erfle - ; Heike Pohla - ;
Mauro Malnati - ; Antonio Cosma* -
* Corresponding author
Abstract
Background: T-cell mediated immunity likely plays an important role in controlling HIV-1
infection and progression to AIDS. Several candidate vaccines against HIV-1 aim at stimulating
cellular immune responses, either alone or together with the induction of neutralizing antibodies,
and assays able to measure CD8 and CD4 T-cell responses need to be implemented. At present,
the IFN-γ-based ELISPOT assay is considered the gold standard and it is broadly preferred as
primary assay for detection of antigen-specific T-cell responses in vaccine trials. However, in spite
of its high sensitivity, the measurement of the sole IFN-γ production provides limited information
on the quality of the immune response. On the other hand, the introduction of polychromatic flow-
cytometry-based assays such as the intracellular cytokine staining (ICS) strongly improved the
capacity to detect several markers on a single cell level.
Published: 6 October 2008
AIDS Research and Therapy 2008, 5:22 doi:10.1186/1742-6405-5-22
Received: 1 September 2008
Accepted: 6 October 2008
This article is available from: />© 2008 Kutscher et al; licensee BioMed Central Ltd.
This is an Open Access article distributed under the terms of the Creative Commons Attribution License ( />),
which permits unrestricted use, distribution, and reproduction in any medium, provided the original work is properly cited.
AIDS Research and Therapy 2008, 5:22 />Page 2 of 13
(page number not for citation purposes)
Results: The cumulative analysis of 275 samples from 31 different HIV-1 infected individuals using
an ICS staining procedure optimized by our laboratories revealed that, following antigenic
stimulation, IFN-γ producing T-cells were also producing MIP-1β whereas T-cells characterized by
the sole production of IFN-γ were rare. Since the analysis of the combination of two functions
decreases the background and the measurement of the IFN-γ+ MIP-1β+ T-cells was equivalent to
the measurement of the total IFN-γ+ T-cells, we adopted the IFN-γ+ MIP-1β+ data analysis system
to evaluate IFN-γ-based, antigen-specific T-cell responses. Comparison of our ICS assay with
ELISPOT assays performed in two different experienced laboratories demonstrated that the IFN-
γ+ MIP-1β+ data analysis system increased the sensitivity of the ICS up to levels comparable to the
sensitivity of the ELISPOT assay.
Conclusion: The IFN-γ+ MIP-1β+ data evaluation system provides a clear advantage for the
detection of low magnitude HIV-1-specific responses. These results are important to guide the
choice for suitable highly sensitive immune assays and to build reagent panels able to accurately
characterize the phenotype and function of responding T-cells. More importantly, the ICS assay can
be used as primary assay to evaluate HIV-1-specific responses without losing sensitivity in
comparison to the ELISPOT assay.
Background
Vaccine development has become more complex in the
last decades, pursuing new strategies for stimulating
immune responses against infectious agents of viral, bac-
terial or parasitic origin as well as against cancer. A striking
example is the long-winded search for an effective HIV-1
vaccine that would be crucial, together with antiretroviral
therapy, to limit and possibly stop the worldwide AIDS
pandemic. Several candidate HIV-1 vaccines that aim to
stimulate cellular immune responses have been tested in
phase I and II clinical trials [1-3]. An accurate evaluation
of the cellular immune response will be key to select vac-
cine candidates for successive phase III clinical trials.
Therefore, methods that qualify and quantify antigen-spe-
cific, functional T cells in a precise, sensitive, and robust
way will be essential. At present, the standard assays that
are commonly used for this purpose are IFN-γ ELISPOT,
HLA class I and class II multimer staining and ICS. The
ELISPOT assay is currently considered the gold standard
in vaccine trials due to its sensitivity and extensive stand-
ardization and validation [4-7]. In fact, several reports
demonstrated that the ELISPOT assay is more sensitive in
detecting weak responses when compared to the ICS assay
[8-11], a feature that represents an important advantage
for the detection and measurement of the immune
response in vaccine trials [12]. The most commonly used
ELISPOT assay measures IFN-γ secretion by total PBMC
stimulated by specific antigens. Albeit ELISPOT assays
being able to measure the secretion of two different
cytokines have been recently established [13], it is
unlikely that future development will increase the simul-
taneous measurement of cytokines for this kind of assays.
On the other hand, the introduction of new reagents,
instruments and software, strongly improved the capacity
of flow cytometry based assays such ICS and multimer
staining to simultaneously measure several parameters in
the same sample [14-16]. However, between ICS and mul-
timer staining, the former seems to be more suited to be
employed in vaccine trials since it does not require previ-
ous HLA typing and a priori knowledge of specific epitopes
[17,18]. Hence, it is generally accepted that ICS provides
more information regarding the quality of the immune
response whereas ELISPOT grants a high capacity of
detecting low magnitude responses, while multimer stain-
ing is the method of choice for a detailed analysis of the
immune response in a selected and limited number of
samples.
In spite of an intense activity in the development and test-
ing of new vaccines against HIV-1, clear immunological
correlates of protection do not still exist although there is
strong evidence that CD4 and CD8 T-cells play a role in
the control of viral replication [19]. However, neither the
magnitude of the immune response (measured as produc-
tion of IFN-γ) nor the breadth of the recognised epitopes
constitute per se valid correlates of protection [20-22].
Recently, studies have shown that polyfunctional CD8 T-
cell responses are preferentially observed in long term
non-progressors (LTNP) when compared to persons with
progressive disease [23]. Furthermore, antigen-specific
terminally differentiated CD8 T-cells, defined by the line-
age markers CCR7 and CD45RA, have been preferentially
found in long-term non-progressors [24] and early infec-
tions with future control of HIV-1 viremia [25]. These
findings highlight the importance of developing assays
able to simultaneously measure several parameters in the
same sample and strongly suggest the use of flow cytome-
try to monitor immune responses.
In this regard, we have developed a 9-colour ICS that
allows the simultaneous determination of the function
and the memory phenotype of antigen specific CD4 and
AIDS Research and Therapy 2008, 5:22 />Page 3 of 13
(page number not for citation purposes)
CD8 T-cells. The assay has the capacity to detect the
cytokines IFN-γ and IL-2, the chemokine MIP-1β and the
activation marker CD154. For the characterization of the
memory phenotype, we used CD45RA, an isoform of a
membrane phosphatase that is expressed by both naïve
and terminally differentiated T-cells [26]. Here, we com-
pared the sensitivity of our recently established 9-colour
ICS with ELISPOT assays performed in two different expe-
rienced laboratories. In our experimental setting, taking
advantage of the simultaneous detection of IFN-γ and
MIP-1β producing T-cells, we demonstrated a similar or
superior capacity of our ICS assay to detect low magnitude
IFN-γ-mediated responses.
Results
The simultaneous evaluation of IFN-
γ
+ MIP-1
β
+ T-cells
increases the capacity to detect IFN-
γ
responses in ICS
The 9 colour ICS assay established in our laboratory is
routinely used to measure HIV-1 specific immune
responses in different clinical settings. The cumulative
analysis of 275 samples obtained from 31 HIV-1 positive
individuals stimulated with peptides derived from 5 dif-
ferent HIV-1 proteins (Table 1) revealed an interesting fea-
ture of IFN-γ-based responses. Upon antigenic
stimulation the majority of the IFN-γ producing CD8 T-
cells were also producing MIP-1β (IFN-γ+ MIP-1β+ CD8
T-cells in %: mean ± SD, 0.245 ± 0.6341), whereas CD8 T-
cells characterized by the sole production of IFN-γ were
rarely detected (IFN-γ+ MIP-1β- CD8 T-cells in %: mean ±
SD, 0.016 ± 0.0652) (Figure 1A and 1B). This trend was
observed for all the CD8 T-cell responses whereas the few
detected CD4 T-cell responses were more heterogeneous,
since antigen-specific cells producing IFN-γ but not MIP-
1β were detectable (IFN-γ+ MIP-1β+ CD4 T-cells in %:
mean ± SD, 0.014 ± 0.0500; IFN-γ+ MIP-1β- CD4 T-cells
in %: mean ± SD, 0.006 ± 0.0328; Figure 1C and 1D). The
analysis of T-cells positive for both markers is of particular
interest, since the simultaneous evaluation of two func-
tions is supposed to decrease the non-specific background
[23]. In order to investigate this observation in our exper-
imental setting, we analyzed 52 mock stimulated samples
from 31 HIV-1 positive subjects. Mock stimulated samples
were run for each analyzed patient to measure spontane-
ous cytokine production and unspecific antibody stain-
ing. They were processed as the other samples but in the
absence of antigenic peptides. The measured background
was significantly reduced (around 4-fold lower; p <
0.0001, Wilcoxon matched pairs test) in the IFN-γ+ MIP-
1β+ CD8 T-cells when compared to the total IFN-γ+ CD8
T-cells (Figure 2A). Similarly, we observed a 7-fold
decrease (p < 0.0001, Wilcoxon matched pairs test) of the
non-specific background in IFN-γ+ MIP-1β+ CD4 T-cells
when compared to total IFN-γ+ CD4 T-cells (Figure 2B).
Representative plots of responding CD8 T-cells and their
negative control are shown in Figure 2C.
A linear regression analysis was performed to examine the
correlation between percentages of total IFN-γ+ and per-
centages of IFN-γ+ MIP-1β+ CD8 and CD4 T-cells in sam-
ples stimulated with HIV-1-derived peptides. Percentages
of total IFN-γ+ and IFN-γ+ MIP-1β+ CD8 T-cells showed a
goodness of fit of r
2
= 0.9929 and a slope of 1.052 demon-
strating an almost perfect linearity of the two measure-
ments (Figure 3A). The goodness of fit was slightly lower
for CD4 T-cells; although it was still characterized by an r
2
value of 0.7817 (Figure 3B). The slope was 1.190, con-
firming the presence of HIV-1 specific CD4 T-cells produc-
ing IFN-γ but not MIP-1β, as previously shown (Figure 1C
and 1D).
Since the numbers of IFN-γ+ MIP-1β+ T-cells were essen-
tially equivalent to those of total IFN-γ+ T-cells whereas
the background was strongly decreased in the former, we
made the assumption that the evaluation of double posi-
tive IFN-γ+ MIP-1β+ T-cells could represent an interesting
option to increase the sensitivity of the ICS assay in the
detection of IFN-γ mediated HIV-1-specific responses.
In order to compare the sensitivity of the two modalities
to evaluate the IFN-γ T-cell response, we analyzed the pre-
viously described 275 independent samples (Figure 4A).
We calculated the 90
th
percentile of the negative values
Table 1: Characteristics of the peptide pools used in this study
Pool Antigen HIV-1 subtype Length (aa) Overlap (aa) # of peptides
1Nef LAI 20 10 20
2Tat LAI 20 10 8
3Rev LAI 20 10 11
4p24 LAI 20 10 22
5p17 SF2 15 5 13
6Nef LAI 8–11 NA 16
7 Nef (1–96) Bru variable variable 15
8 Nef (95–205) Bru variable variable 15
9 Tat BH10 variable variable 11
aa = Amino acids; NA = not applicable
AIDS Research and Therapy 2008, 5:22 />Page 4 of 13
(page number not for citation purposes)
after background subtraction and this value was consid-
ered as a threshold. Samples were considered positive
when higher than the threshold and at least 2-fold higher
than their respective negative control. In the CD8 T-cell
population, 187 positive responses were detected using
the IFN-γ+ MIP-1β+ data evaluation, while only 146 pos-
itive responses were detected using the total IFN-γ+ data
evaluation. The difference was significant performing a
Fisher's exact test (p = 0.0005). The difference between
positive CD4 T-cell responses calculated using the two
modalities was not significant. When CD8 and CD4 T-cell
responses were considered together, the difference
achieved significance with a p value of 0.0058 (Fisher's
exact test). The contingency tables in Figure 4B show that
the IFN-γ+ MIP-1β+ data evaluation allowed the detection
of 41 CD8 responses that were otherwise missed by eval-
uation of the total IFN-γ+ T-cells. As expected, the simul-
taneous detection of IFN-γ+ and MIP-1β+ did not increase
the capacity to detect antigen-specific CD4 T-cell
responses. In fact, 11 CD4 responses were exclusively
detected by the total IFN-γ+ data evaluation whereas 5
were exclusively observed with the simultaneous detec-
tion of IFN-γ+ and MIP-1β+.
Evaluation of IFN-
γ
+ MIP1
β
+ cells increases the sensitivity
of the ICS in comparison to the ELISPOT
ICS is generally considered less sensitive than ELISPOT in
detecting low magnitude responses [8-10]. Therefore, we
tested whether the simultaneous detection of MIP-1β and
IFN-γ might increase its sensitivity in comparison to two
ELISPOT assays performed in independent laboratories.
Each laboratory used its own ELISPOT method, including
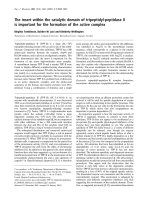
IFN-γ and MIP1-β expression in CD8 and CD4 T-cells stimulated with HIV-1-derived antigensFigure 1
IFN-γ and MIP1-β expression in CD8 and CD4 T-cells stimulated with HIV-1-derived antigens. Percentages of
IFN-γ+ MIP-1β- and IFN-γ+ MIP-1β+ CD8 (A) or CD4 (C) T-cells are shown for a total of 275 samples. The mean is depicted
for each T-cell population. Representative pseudo-colour dot plots of data gated on living CD8+ CD3+ lymphocytes (B) or liv-
ing CD4+ CD3+ lymphocytes (D) from 4 different patients are shown. In each plot the percentage of IFN-γ+ MIP-1β-, IFN-γ+
MIP-1β+ and IFN-γ- MIP-1β+ is indicated in the bottom-right corner. The pools used for PBMC stimulation are described in
Table 1. TL10, TPGPGVRYPL.
B
IFN-
MIP-1
pool 1
pool 1
TL10 TL10
D
IFN-
MIP-1
pool 4pool 1
pool 1
pool 7
0.04
0.23
0.17
0.36
1.27
0.03
0.12
0.34
0.06
0.04
0.16
0.05
0.51
1.75
0.03 3.24
2.70
0.06 0.25
0.42
0.04 0.89
0.76
0.02
A
C
AIDS Research and Therapy 2008, 5:22 />Page 5 of 13
(page number not for citation purposes)
Figure 2 (see legend on next page)
WRWDO,)1
0,3
,
)
1
S
EDFNJURXQGLQRI&'7FHOOV
WRWDO,)1
0,3
,
)
1
S
EDFNJURXQGLQRI&'7FHOOV
$
%
&
AIDS Research and Therapy 2008, 5:22 />Page 6 of 13
(page number not for citation purposes)
a different ELISPOT reader and a different procedure to
determine positive responses (see Methods). To facilitate
the comparison with the ELISPOT, ICS results were
expressed as the sum of the CD8 and CD4 responses and
a response in ICS was considered positive when a CD8 or
a CD4 response was scored as positive.
Laboratory 1 analyzed 67 samples from 17 HIV-1 infected
subjects stimulated with 14 different peptide formula-
tions derived from two different HIV-1 proteins. Correla-
tion analysis of the responses measured by ELISPOT and
by ICS expressed in terms of IFN-γ+ MIP-1β+ CD8 T-cells
or total IFN-γ+ CD8 T-cells demonstrated in both cases a
significant correlation (Figure 5A). The ELISPOT detected
50 positive responses in 67 samples, while the ICS posi-
tive responses expressed as IFN-γ+ MIP-1β+ CD8 or CD4
T-cells were 55 and the ICS positive responses expressed as
total IFN-γ+ CD8 or CD4 T-cells were 45. By measuring
IFN-γ+ MIP-1β+ we detected 6 positive responses that
were otherwise missed by ELISPOT whereas, in contrast,
only 1 response detected by ELISPOT was missed in our
ICS determination. By determination of the total IFN-γ+
cells, we were able to detect 4 positive responses that were
missed by the ELIPOT, but the ELISPOT was able to detect
9 responses missed by the ICS. Of note, 8 out of 10 posi-
tive responses that were additionally detected using the
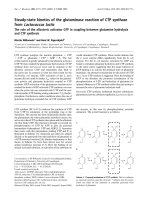
Magnitude of IFN-γ+ MIP-1β+ T-cells and IFN-γ+ T-cells in mock stimulated samplesFigure 2 (see previous page)
Magnitude of IFN-γ+ MIP-1β+ T-cells and IFN-γ+ T-cells in mock stimulated samples. Percentages of total IFN-γ+
and IFN-γ+ MIP-1β+ CD8 (A) or CD4 (B) T-cells are shown. The lines indicate the median percentage of the observed back-
ground. P values were determined by Wilcoxon matched pairs test. In (C) representative data from one study subject are
shown. PBMC are gated on CD8+ CD3+ lymphocytes and were stimulated as indicated at the top of the figure. The peptide
LDLWIYHTQGYFPDWQNY (LY18), included in pool 8, was here used alone. Data were analyzed with the IFN-γ+ MIP-1β+
(upper row) or the total IFN-γ+ (bottom row) data analysis system. The percentage of IFN-γ+ MIP-1β+ and total IFN-γ+ CD8
T-cells is indicated in the upper-right corner of each plot. Samples were scored as positive or negative (upper-left corner)
according to the following procedure. After background subtraction, the 90 percentile of the negative values was calculated
and this value was considered as a threshold. Samples were considered positive when higher than the threshold and at least 2
times higher than their respective mock stimulated control.
Linear regression analysisFigure 3
Linear regression analysis. Linear regression analysis between frequencies of IFN-γ+ MIP-1β+ T-cells and total IFN-γ+ T-
cells is shown for CD8 (A) and CD4 (B) T-cells. The slope (s) and the goodness of fit (r
2
) are indicated in each graph. The
regression line is depicted in each graph.
U
V
,)1 0,3 LQRI&'7FHOOV
WRWDO,)1 LQRI&'7FHOOV
U
V
,)1 0,3 LQRI&'7FHOOV
WRWDO,)1 LQRI&'7FHOOV
$
%
AIDS Research and Therapy 2008, 5:22 />Page 7 of 13
(page number not for citation purposes)
IFN-γ+ MIP-1β+ data evaluation were also scored positive
using ELISPOT demonstrating an improvement of the
concordance between the assays.
Laboratory 2 analyzed 29 samples obtained from 3 HIV-1
infected subjects stimulated with 18 different peptide for-
mulations derived from 5 HIV-1 proteins using an ELIS-
POT assay approved by the Cancer Vaccine Consortium
Number of detected positive responsesFigure 4
Number of detected positive responses. (A) The histogram plots show the number of positive CD8, CD4 or total T-cell
responses detected with the IFN-γ+ MIP-1β+ and the total IFN-γ+ data evaluation systems. The p values (Fisher's exact test)
are shown for each graph. Not significant difference (ns). (B) 2 × 2 contingency tables comparing the two data evaluation sys-
tems are shown for CD8 and CD4 T-cell responses.
WRWDO
WRWDO
0,3
,
)1
WRWDO,
)1
S
QXPEHURISRVLWLYHUHVSRQVHV
0,3
,
)1
WRWDO,
)1
QV
QXPEHURISRVLWLYHUHVSRQVHV
0,3
,
)1
WRWDO,
)1
S
QXPEHURISRVLWLYHUHVSRQVHV
$
%
,&6,)1
0,3 ,&6,)1 0,3
,&6WRWDO,)1
,&6WRWDO,)1
&' &' 7RWDO7FHOOV
&' &'
AIDS Research and Therapy 2008, 5:22 />Page 8 of 13
(page number not for citation purposes)
Comparison between the ICS and two independently performed ELISPOT assaysFigure 5
Comparison between the ICS and two independently performed ELISPOT assays. The two ICS data evaluation
systems are compared with ELISPOT assays performed by laboratory 1 (A) and laboratory 2 (B). Correlations between fre-
quencies of responding T-cells detected by ELISPOT and by ICS using the IFN-γ+ MIP-1β+ or the total IFN-γ+ data evaluation
system are determined by Spearman's rank correlation. r and p values are shown in each graph. 2 × 2 contingency tables com-
paring the positive T-cell responses detected by ELISPOT and by ICS with the two data evaluation systems are also shown.
$
%
S
U
(/,6327LQ6)8
3%0&
,&6,)1 0,3
LQRI7FHOOV
S
U
(/,6327LQ6)8
3%0&
,&6WRWDO,)1
LQRI7FHOOV
S
U
(/,6327LQ6)8
3%0&
,&6,)1 0,3
LQRI7FHOOV
S
U
(/,6327LQ6)8
3%0&
,&6WRWDO,)1
LQRI7FHOOV
,&6,)1 0,3
,&6,)1
WRWDO
(/,6327
(/,6327
,&6,)1 0,3
,&6,)1
WRWDO
(/,6327
(/,6327
WRWDO
WRWDO
WRWDO
WRWDO
AIDS Research and Therapy 2008, 5:22 />Page 9 of 13
(page number not for citation purposes)
[27]. As observed in the results generated from the first
laboratory, the correlation with the ELISPOT results was
significant for both ICS methodologies (Figure 5B). A
total of 29 positive responses were detected by ELISPOT,
while 27 and 20 positive responses were detected by ICS
using the IFN-γ+ MIP-1β+ and the total IFN-γ+ methods,
respectively. Only 2 positive responses were lost by the
IFN-γ+ MIP-1β+ data evaluation system, whereas 9
responses were lost by the total IFN-γ+ data evaluation
system in comparison to the ELISPOT performed in labo-
ratory 2. These combined results of the 2 laboratories
demonstrated that the new evaluation method based on
the simultaneous detection of IFN-γ and MIP-1β increased
the capacity of the ICS to detect low-magnitude responses.
Influence of the variation in cell number input in the ICS
assay
Cell counting is a basic technique in use in all cell culture
laboratories. Nevertheless, it constitutes an important
source of experimental error [27]. The number of cells per
sample is a critical parameter in the ELISPOT assay, since
results are directly calculated from the total amount of
cells seeded in each well. In contrast, in the ICS assay
responding cells are calculated as a percentage of CD4 or
CD8 T-cells and therefore the results are independent
from the total number of cells used in each experimental
sample. However, variation in the cell number might still
affect the experimental outcome because of changes in the
proportion between the amount of cells, growth factors
and stimulants. Therefore, we tested the impact of varying
the amount of PBMC per experimental sample in our 9-
colour ICS assay. Stimulation with 2 different peptides
representing optimal CD8 epitopes was performed using
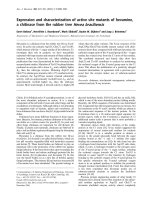
0.45, 0.91, 1.82 and 3.66 million of cells/well, while the
amount of peptides was kept constant at 2 μg/ml. There
was neither a trend nor a high variation between the
results for either the total IFN-γ+ response as well as for
the combined IFN-γ and MIP-1β positive cells (Figure 6).
Of note, the background levels were not affected by the
number of cells seeded per well.
Discussion
In the present study, we provide experimental evidence in
support of a combined 9-colour IFN-γ and MIP-1β ICS
Variation in the number of cells/well in ICS assayFigure 6
Variation in the number of cells/well in ICS assay. Different amounts of PBMC were stimulated with 2 different Nef
derived optimal CD8 epitopes (FLKEKGGL, FL8 and RRQDILDLWIY, RY11). Analyzed responses are shown on the x axis.
5<
,)
1
)/,)
1
0
,35<
,)
1
0,
3
)/,)
1
FHOOVZHOO
FHOOVZHOO
FHOOVZHOO
FHOOVZHOO
UHVSRQVHLQRI&'7FHOOV
AIDS Research and Therapy 2008, 5:22 />Page 10 of 13
(page number not for citation purposes)
method that, unlike commonly used methods based on
the flow-cytometric detection of IFN-γ, achieves sensitivity
comparable to that typical of ELISPOT assays.
ELISPOT and ICS assays are widely used to measure spe-
cific immune responses in different experimental settings.
IFN-γ ELISPOT is considered the gold standard for the
evaluation of the immune response in vaccination trials
even though accumulating evidence demonstrates that
the measurement of a single immunological marker does
not provide sufficient information about the efficacy of a
specific immune response [9,28,29]. In addition, recent
disappointing results of phase III efficacy HIV-1 vaccina-
tion trials [30] underscored the need for a better evalua-
tion of the immune response in phase I and II clinical
trials. A supporting issue in favour of the use of the IFN-γ
ELISPOT as primary assay in vaccine trials is its supposed
higher sensitivity in comparison to other immune moni-
toring assays such as ICS [8-10,12]. Here, we demon-
strated that the use of a combined detection of IFN-γ and
MIP-1β could scale-up the sensitivity of ICS assays to lev-
els comparable to those of IFN-γ-based ELISPOT. In this
regard, the key observation is that the majority of the IFN-
γ producing T-cells are simultaneously producing MIP-1β
rendering this new modality of evaluation equivalent to
the measurement of the total IFN-γ producing T-cells with
the relevant advantage of a consistent decrease of the
background that in turn increases the sensitivity of the
assay.
It is unlikely that the increased sensitivity of the IFN-γ+
MIP-1β+ data evaluation is due to false positive detec-
tions, since simultaneous unspecific binding of two anti-
bodies to the same cell is less probable than unspecific
binding of a single antibody. In addition, the majority of
samples scored as positive with the IFN-γ+ MIP-1β+ data
evaluation were scored as positive using the ELISPOT as
well, indicating that the increased sensitivity was not due
to a higher number of false positive detections but due to
a better capacity of the IFN-γ+ MIP-1β+ data evaluation to
discriminate positive responses in comparison to the total
IFN-γ+ data evaluation.
Our results provide support for an expanded use of poly-
chromatic flow cytometry as primary assay in vaccine tri-
als. The ICS method optimized in our laboratory allows
the simultaneous measurement of several fluorescence
markers without losing sensitivity in comparison to the
gold standard IFN-γ ELISPOT. In our setting, we used a 9
colour ICS; however, the same method can be applied to
any staining combination including IFN-γ and MIP-1β in
combination with the appropriate lineage markers. Thus,
for investigators with no access to sophisticated flow
cytometers, a simplified panel can be used for immune-
monitoring purpose as alternative to the ELISPOT not los-
ing sensitivity and with the advantage to discriminate
CD4 and CD8 mediated responses. In alternative, more
complex staining combinations could be designed for lab-
oratory facilities where complex instrumentation is avail-
able, provided the inclusion of the simultaneous
measurement of IFN-γ and MIP-1β.
Our present study was limited to the analysis of the HIV-
1-specific T-cell responses. Nevertheless, this method can
be extended to other specific immune responses if T-cells
expressing IFN-γ and MIP-1β represent the majority of the
total IFN-γ producing T-cells. In this regard, a possible
extension of our methodology is the coupling of an acti-
vation marker (i.e. CD69, CD154, etc.) to the measure-
ment of cytokines or chemokines (i.e, IFN-γ, IL-2 and
MIP-1β). As a general rule, targeting 2 or more molecules
on the same cell population should increase the sensitiv-
ity of the assay for the selected cell population. Since flow
cytometry has been recently advanced by the develop-
ment of new instrumentation and reagents, the inclusion
of more markers in a single sample should aim not only
to increase the amount of information per cell but also to
increase the sensitivity for populations of special interest.
Finally, in the present study we demonstrate that the
number of cells used in each sample does not affect the
readout of the ICS. Since the procedure of manual cell
counting is a usual source of experimental error and the
number of cells directly affects the ELISPOT readout, our
data support the concept of a reduced experimental error
associated with the use of ICS assays and strengthens the
idea to apply ICS as primary assay in vaccine trials.
Conclusion
The simultaneous detection of IFN-γ and MIP-1β provides
a clear advantage for the detection of low HIV-1 specific
responses compared to the classical way to analyze the
total IFN-γ producing T-cells by ICS. The comparison with
the results generated by ELISPOT independently by two
experienced laboratories demonstrates that the combined
IFN-γ+ MIP-1β+ evaluation system allows for the detec-
tion of low HIV-1 specific IFN-γ responses to a similar or
even higher extent, as they can be detected using ELISPOT
assays. The application of the IFN-γ+ MIP-1β+ method in
other diseases and immunological fields remains to be
assessed. These findings are important to guide the choice
for suitable immune assays and to build reagent panels
able to accurately characterize the phenotype and func-
tion of responding T-cells in a highly sensitive way.
Methods
Study samples
PBMC obtained from 31 HIV-1 infected individuals were
analyzed in the present study. Their median CD4 T-cell
count was 502 cells/μl (range 229 to 1,042). Twenty-one
AIDS Research and Therapy 2008, 5:22 />Page 11 of 13
(page number not for citation purposes)
study subjects were under antiretroviral therapy and 16 of
them had undetectable viral load. When detectable the
median viral load was 2,581 RNA copies/ml (range 151 to
50,577). Six of the study subjects under antiretroviral
therapy with undetectable (< 50 copies of RNA/ml) viral
load underwent treatment interruption and their range of
viremia was then from 600 to 49,600 RNA copies/ml at
the time of sampling.
Peptides
As shown in Table 1, nine different HIV-1 derived peptide
pools were used to stimulate PBMC: (1) 20-mer peptides
overlapping by 10 amino acids spanning the HIV-1 LAI
Nef protein; (2) 20-mer peptides overlapping by 10
amino acids spanning the HIV-1 LAI Tat protein; (3) 20-
mer peptides overlapping by 10 amino acids spanning the
HIV-1 LAI Rev protein; (4) 20-mer peptides overlapping
by 10 amino acids spanning the HIV-1 LAI p24 protein;
(5) 15-mer peptides overlapping by 5 amino acids span-
ning the HIV-1 SF2 p17 protein; (6) pool of 16 Nef
derived peptides corresponding to previously described
optimal CD8 epitopes [31]; (7) variable length overlap-
ping peptides spanning the 1 to 96 region of HIV-1 Bru
Nef; (8) variable length overlapping peptides spanning
the 96 to 205 region of HIV-1 Bru Nef and (9) variable
length overlapping peptides spanning HIV-1 BH10 Tat.
Pool 1 to 6 and 7 to 9 were previously described by Cosma
et al [32] and Vardas et al. [33], respectively. Several pep-
tides contained in the pools 7, 8 and 9 were used alone in
some experiments. The following peptides corresponding
to previously described optimal CD8 epitopes [31] were
also used in some stimulation experiments: FLKEKGGL
(FL8), TPGPGVRYPL (TL10), YPLTFGWCY and
RRQDILDLWIY (RY11). All the peptide pools were tested
for specificity in healthy subjects in previous studies
[32,33].
Intracellular cytokine staining
Cryopreserved PBMC were used for the ICS assay. After
thawing, 10
6
PBMC were resuspended in 150 μl RPMI
1640 (Cambrex, Taufkirchen, Germany) supplemented
with 10% FCS. The stimulation was performed with 0.4
μg peptide/10
6
cells in the presence of 1.3 μg/ml anti
CD28 and 1.3 μg/ml anti CD49d costimulatory antibod-
ies (Becton Dickinson, Heidelberg, Germany). Following
60 min incubation, 10 μg/ml of Brefeldin A (Sigma-
Aldrich, Taufkirchen, Germany) were added to the cell
suspension and the incubation carried out for additional
4 h. Stimulated cells were then resuspended in Stain
Buffer (0,2% BSA, 0,09% Na Azide in DPBS; Becton Dick-
inson) and incubated with the photoreactive fluorescent
label ethidium monoazide (EMA; Molecular Probes/Invit-
rogen, Karlsruhe, Germany) to asses their viability. After
washing, cells were fixed and permeabilized using the BD
Cytofix/Cytoperm™ Kit (Becton Dickinson). Then, the fol-
lowing fluorochrome-conjugated antibodies were added:
CD8-PacB (DAKO cytomation, Hamburg, Germany),
CD3-AmCyan, CD4-PerCP, CD45RA-PECy7, CD154-
FITC, IFN-γ-Al700, IL-2-APC and MIP1β-PE (Becton Dick-
inson). Incubation was carried out on ice for 30 min and
after washing, cells were acquired using an LSRII flow
cytometer (Becton Dickinson) equipped with a high
throughput system. Sample analysis was performed using
FlowJo version 8.5.3 (Tree Star, Ashland, OR). The gating
strategy is shown in Additional file 1. Lymphocytes were
gated on a forward scatter area versus side scatter area
pseudo-colour dot plot and dead cells were removed
according to EMA staining. CD3+ events were gated versus
IFN-γ, IL-2, MIP-1β and CD154 to account for down-reg-
ulation. CD3+ events were then combined together using
the Boolean operator "Or". The same procedure was used
to subsequently gate CD8+ events. CD4+ events were
excluded before creating a gate for each function or phe-
notype. After background subtraction, the 90 percentile of
the negative values was calculated and this value was con-
sidered as a threshold. Samples were considered positive
when higher than the threshold and at least 2 times higher
than their respective mock stimulated control.
ELISPOT assay (laboratory 1)
Laboratory 1 used the TriSpot™ Human IFN-γ/IL-2 ELIS-
POT Kit (Endogen, Rockford, IL/USA) according to the
manufacturer instructions. Briefly, PBMC from ACD
whole blood were separated on Lymphoprep™ (Axis-
Shield PoC, Oslo, Norway), washed in RPMI medium
(RPMI 1640, supplemented with 100 U/ml penicillin,
100 μg/ml streptomycin and 2 mM L-glutamine, all from
BioWhittaker Europe, Verviers, Belgium) and counted by
Trypan Blue exclusion for assessing viability. After resus-
pension in complete medium (RPMI medium supple-
mented with 10% heat inactivated fetal bovine serum,
BioWhittaker), PBMC were transferred to the ELISPOT
plate with a concentration of 0.8 to 2 × 10
5
cells/well in
duplicate. Peptides were added at a final concentration of
3 μg/ml each. PBMC in medium alone or stimulated with
phytohemagglutinin (PHA-P, Sigma) at 5 μg/ml were
used as negative and positive controls, respectively. Incu-
bation was carried out at 37°C in a 5% CO
2
incubator for
18 hours. The resulting spots were counted using the
Automated ELISA-Spot Assay Video Analysis System Eli-
Scan with the software Eli.Analyse V4.2 (A.EL.VIS, Hanno-
ver, Germany). PBMC from each study subject were mock
stimulated in duplicate and the mean background value
subtracted from the mean of the duplicate samples.
Responses were empirically scored as positive when the
stimulated sample minus background value was > 50 SFU
per 10
6
PBMC and higher than the mean value of the neg-
ative controls plus 2 standard deviations. Only spots pos-
itive for IFN-γ production were taken in consideration for
the present study.
AIDS Research and Therapy 2008, 5:22 />Page 12 of 13
(page number not for citation purposes)
ELISPOT assay (laboratory 2)
Frozen PBMC were thawed, washed with CTL Wash™ Sup-
plement culture medium (Cellular Technology Ltd.,
Cleveland, Ohio) plus benzonase nuclease (50 U/ml;
Novagen, Madison, WI), rested for 3 h at 37°C, counted
and seeded at 1 to 2 × 10
5
cells in triplicates on antibody
precoated PVDF plates (Mabtech AB, Nacka, Sweden). The
capture antibody (Mabtech) was the IFN-γ-specific clone
1-D1K. Beforehand, the plates were incubated at 37°C in
RPMI 1640 culture medium supplemented with 2 mM L-
glutamine, 1 mM sodium pyruvate, penicillin/streptomy-
cin (100 U/ml) and 10% human AB serum (BioWhittaker,
Verviers, Belgium) to block unspecific binding. The PBMC
were stimulated directly with different peptides and pep-
tide pools (2 μg/ml), and assessed in the ELISPOT assay
after 24 h of culture in CTL Test™ medium. The develop-
ment of the spots was performed as described previously
[34] with the following exceptions: the plates were exten-
sively washed first with PBS/0.05% Tween20, then with
only PBS, incubated with a directly streptavidin-alkaline
phosphatase (ALP) conjugated biotinylated detection
antibody clone 7-B6-1 (Mabtech), washed again and a
ready-to-use BCIP/NBT-plus substrate solution was used
(Mabtech). Spots were counted using the AID reader sys-
tem ELR03 with the software version 4.0 (AID Autoim-
mun Diagnostika GmbH, Strassberg, Germany).
Responses were scored as positive if the test wells con-
tained a mean number of spot-forming units (SFU) higher
than the mean value plus 2 standard deviations in nega-
tive control wells. The present ELISPOT standard opera-
tion procedure was approved by the international panel
analysis of the Cancer Vaccine Consortium [27].
Statistical analysis
All statistical tests were performed with PRISM
®
5.01
(GraphPad Software Inc., San Diego, CA). The signifi-
cance level was 0.05 for all statistical tests.
Competing interests
The authors declare that they have no competing interests.
Authors' contributions
SK and AC conceived the study. SK, CJD, SA, SH and BS
performed experiments. SN, GT, JRB, HJS, FDG, MT and
GP participated to the collection of patient samples. SK,
CJD, SA, SH, BS, PB, HP, MM and AC analyzed data. PL
and VE contributed to research and critical discussion. SK
and AC wrote the paper. All authors provided editorial
comments and assistance.
Additional material
Acknowledgements
This work was supported by the AIDS Vaccine Integrated Project (AVIP;
contract LSHP-CT-2004-503487) and by the VI° Italian National AIDS
research program of the Istituto Superiore di Sanità, Rome, Italy. Peptides
were provided by the Centre for AIDS reagents through the EU Program
EVA Centre for AIDS Reagents, NIBSC, UK. We thank Prof. Ulrike Protzer
and Prof. Dolores Schendel for their valuable support.
References
1. Hanke T, McMichael AJ, Dorrell L: Clinical experience with plas-
mid DNA- and modified vaccinia virus Ankara-vectored
human immunodeficiency virus type 1 clade A vaccine focus-
ing on T-cell induction. J Gen Virol 2007, 88:1-12.
2. Gudmundsdotter L, Sjodin A, Bostrom AC, Hejdeman B, Theve-Palm
R, Alaeus A, Lidman K, Wahren B: Therapeutic immunization for
HIV. Springer Semin Immunopathol 2006, 28:221-30.
3. Yang OO: Aiming for successful vaccine-induced HIV-1-spe-
cific cytotoxic T lymphocytes. Aids 2008, 22:325-31.
4. Russell ND, Hudgens MG, Ha R, Havenar-Daughton C, McElrath MJ:
Moving to human immunodeficiency virus type 1 vaccine
efficacy trials: defining T cell responses as potential corre-
lates of immunity. J Infect Dis 2003, 187:226-42.
5. Janetzki S, Schaed S, Blachere NE, Ben-Porat L, Houghton AN, Pana-
geas KS: Evaluation of Elispot assays: influence of method and
operator on variability of results. J Immunol Methods 2004,
291:175-83.
6. Samri A, Durier C, Urrutia A, Sanchez I, Gahery-Segard H, Imbart S,
Sinet M, Tartour E, Aboulker JP, Autran B, Venet A: Evaluation of
the interlaboratory concordance in quantification of human
immunodeficiency virus-specific T cells with a gamma inter-
feron enzyme-linked immunospot assay. Clin Vaccine Immunol
2006, 13:684-97.
7. Gudmundsdotter L, Bernasconi D, Hejdeman B, Sandstrom E, Alaeus
A, Lidman K, Ensoli B, Wahren B, Butto S: Cross-clade immune
responses to Gag p24 in patients infected with different HIV-
1 subtypes and correlation with HLA class I and II alleles.
Vaccine 2008, 26(40):5182-5187.
8. Tassignon J, Burny W, Dahmani S, Zhou L, Stordeur P, Byl B, De
Groote D: Monitoring of cellular responses after vaccination
against tetanus toxoid: comparison of the measurement of
IFN-gamma production by ELISA, ELISPOT, flow cytome-
try and real-time PCR. J Immunol Methods 2005, 305:188-98.
Additional file 1
Gating strategy. Representative example showing the gating strategy of
the 9 colour ICS applied on a PBMC sample stimulated with peptide pool
6. Lymphocytes are gated on a forward scatter area (FSC-A) versus side
scatter area (SSC-A) pseudo-colour dot plot (A) and dead cells are
removed according to EMA staining (B). CD3+ events are gated versus
CD154 (C), IFN-
γ
(D), IL-2 (E) and MIP-1
β
(F) to account for down-
regulation. CD3+ events are then combined together using the Boolean
operator "Or". The same procedure is used to subsequently gate CD8+ (G,
H, I and J) and CD4+ (K, L, M and N) events. CD4+ events are excluded
from the CD8+ population using the exclusion gate in O before creating
a gate for each function or phenotype (P, Q, R, S and T). CD8+ events
are excluded from the CD4+ population using the exclusion gate in O
before creating a gate for each function or phenotype (U, V, W, X and Y).
Click here for file
[ />6405-5-22-S1.pdf]
Publish with BioMed Central and every
scientist can read your work free of charge
"BioMed Central will be the most significant development for
disseminating the results of biomedical research in our lifetime."
Sir Paul Nurse, Cancer Research UK
Your research papers will be:
available free of charge to the entire biomedical community
peer reviewed and published immediately upon acceptance
cited in PubMed and archived on PubMed Central
yours — you keep the copyright
Submit your manuscript here:
/>BioMedcentral
AIDS Research and Therapy 2008, 5:22 />Page 13 of 13
(page number not for citation purposes)
9. Tobery TW, Dubey SA, Anderson K, Freed DC, Cox KS, Lin J,
Prokop MT, Sykes KJ, Mogg R, Mehrotra DV, Fu TM, Casimiro DR,
Shiver JW: A comparison of standard immunogenicity assays
for monitoring HIV type 1 gag-specific T cell responses in
Ad5 HIV Type 1 gag vaccinated human subjects. AIDS Res
Hum Retroviruses 2006, 22:1081-90.
10. Karlsson AC, Martin JN, Younger SR, Bredt BM, Epling L, Ronquillo R,
Varma A, Deeks SG, McCune JM, Nixon DF, Sinclair E: Comparison
of the ELISPOT and cytokine flow cytometry assays for the
enumeration of antigen-specific T cells. J Immunol Methods
2003, 283:141-53.
11. Rehermann B, Naoumov NV: Immunological techniques in viral
hepatitis. J Hepatol 2007, 46:508-20.
12. Goonetilleke N, Moore S, Dally L, Winstone N, Cebere I, Mahmoud
A, Pinheiro S, Gillespie G, Brown D, Loach V, Roberts J, Guimaraes-
Walker A, Hayes P, Loughran K, Smith C, De Bont J, Verlinde C, Voo-
ijs D, Schmidt C, Boaz M, Gilmour J, Fast P, Dorrell L, Hanke T,
McMichael AJ: Induction of multifunctional human immunode-
ficiency virus type 1 (HIV-1)-specific T cells capable of prolif-
eration in healthy subjects by using a prime-boost regimen
of DNA- and modified vaccinia virus Ankara-vectored vac-
cines expressing HIV-1 Gag coupled to CD8+ T-cell epitopes.
J Virol 2006, 80:4717-28.
13. Boulet S, Ndongala ML, Peretz Y, Boisvert MP, Boulassel MR, Trem-
blay C, Routy JP, Sekaly RP, Bernard NF: A dual color ELISPOT
method for the simultaneous detection of IL-2 and IFN-
gamma HIV-specific immune responses. J Immunol Methods
2007, 320:18-29.
14. Perfetto SP, Chattopadhyay PK, Roederer M: Seventeen-colour
flow cytometry: unravelling the immune system. Nat Rev
Immunol 2004, 4:648-55.
15. Horton H, Thomas EP, Stucky JA, Frank I, Moodie Z, Huang Y, Chiu
YL, McElrath MJ, De Rosa SC: Optimization and validation of an
8-color intracellular cytokine staining (ICS) assay to quantify
antigen-specific T cells induced by vaccination. J Immunol
Methods 2007, 323:39-54.
16. Nomura LE, Emu B, Hoh R, Haaland P, Deeks SG, Martin JN, McCune
JM, Nixon DF, Maecker HT: IL-2 production correlates with
effector cell differentiation in HIV-specific CD8+ T cells. AIDS
Res Ther 2006, 3:18.
17. Kern F, LiPira G, Gratama JW, Manca F, Roederer M: Measuring
Ag-specific immune responses: understanding immun-
opathogenesis and improving diagnostics in infectious dis-
ease, autoimmunity and cancer.
Trends Immunol 2005,
26:477-84.
18. Sun Y, Iglesias E, Samri A, Kamkamidze G, Decoville T, Carcelain G,
Autran B: A systematic comparison of methods to measure
HIV-1 specific CD8 T cells. J Immunol Methods 2003, 272:23-34.
19. Deeks SG, Walker BD: Human immunodeficiency virus con-
trollers: mechanisms of durable virus control in the absence
of antiretroviral therapy. Immunity 2007, 27:406-16.
20. Addo MM, Yu XG, Rathod A, Cohen D, Eldridge RL, Strick D, John-
ston MN, Corcoran C, Wurcel AG, Fitzpatrick CA, Feeney ME, Rod-
riguez WR, Basgoz N, Draenert R, Stone DR, Brander C, Goulder PJ,
Rosenberg ES, Altfeld M, Walker BD: Comprehensive epitope
analysis of human immunodeficiency virus type 1 (HIV-1)-
specific T-cell responses directed against the entire
expressed HIV-1 genome demonstrate broadly directed
responses, but no correlation to viral load. J Virol 2003,
77:2081-92.
21. Masemola A, Mashishi T, Khoury G, Mohube P, Mokgotho P, Vardas
E, Colvin M, Zijenah L, Katzenstein D, Musonda R, Allen S, Kumwenda
N, Taha T, Gray G, McIntyre J, Karim SA, Sheppard HW, Gray CM:
Hierarchical targeting of subtype C human immunodefi-
ciency virus type 1 proteins by CD8+ T cells: correlation with
viral load. J Virol 2004, 78:3233-43.
22. Gea-Banacloche JC, Migueles SA, Martino L, Shupert WL, McNeil AC,
Sabbaghian MS, Ehler L, Prussin C, Stevens R, Lambert L, Altman J,
Hallahan CW, de Quiros JC, Connors M: Maintenance of large
numbers of virus-specific CD8+ T cells in HIV-infected pro-
gressors and long-term nonprogressors. J Immunol 2000,
165:1082-92.
23. Betts MR, Nason MC, West SM, De Rosa SC, Migueles SA, Abraham
J, Lederman MM, Benito JM, Goepfert PA, Connors M, Roederer M,
Koup RA: HIV nonprogressors preferentially maintain highly
functional HIV-specific CD8+ T cells. Blood 2006, 107:4781-9.
24. Addo MM, Draenert R, Rathod A, Verrill CL, Davis BT, Gandhi RT,
Robbins GK, Basgoz NO, Stone DR, Cohen DE, Johnston MN, Flynn
T, Wurcel AG, Rosenberg ES, Altfeld M, Walker BD: Fully differen-
tiated HIV-1 specific CD8+ T effector cells are more fre-
quently detectable in controlled than in progressive HIV-1
infection. PLoS ONE 2007, 2:e321.
25. Northfield JW, Loo CP, Barbour JD, Spotts G, Hecht FM, Klenerman
P, Nixon DF, Michaelsson J: Human immunodeficiency virus
type 1 (HIV-1)-specific CD8+ T(EMRA) cells in early infec-
tion are linked to control of HIV-1 viremia and predict the
subsequent viral load set point. J Virol 2007, 81:5759-65.
26. Sallusto F, Lenig D, Forster R, Lipp M, Lanzavecchia A: Two subsets
of memory T lymphocytes with distinct homing potentials
and effector functions. Nature 1999, 401:708-12.
27. Janetzki S, Panageas KS, Ben-Porat L, Boyer J, Britten CM, Clay TM,
Kalos M, Maecker HT, Romero P, Yuan J, Kast WM, Hoos A: Results
and harmonization guidelines from two large-scale interna-
tional Elispot proficiency panels conducted by the Cancer
Vaccine Consortium (CVC/SVI). Cancer Immunol Immunother
2008, 57:303-15.
28. Makedonas G, Betts MR: Polyfunctional analysis of human t cell
responses: importance in vaccine immunogenicity and natu-
ral infection. Springer Semin Immunopathol 2006, 28:209-19.
29. Seder RA, Darrah PA, Roederer M: T-cell quality in memory and
protection: implications for vaccine design. Nat Rev Immunol
2008, 8:247-58.
30. Sekaly RP: The failed HIV Merck vaccine study: a step back or
a launching point for future vaccine development? J Exp Med
2008, 205:7-12.
31. Korber B BC, Haynes B, Moore J, Koup R, Kuiken C, Walker B, Wat-
kins D: HIV Molecular Immunology. Los Alamos, NM: Los Ala-
mos National Laboratories; 2001.
32. Cosma A, Nagaraj R, Buhler S, Hinkula J, Busch DH, Sutter G, Goebel
FD, Erfle V: Therapeutic vaccination with MVA-HIV-1 nef elic-
its Nef-specific T-helper cell responses in chronically HIV-1
infected individuals. Vaccine 2003, 22:21-9.
33. Vardas E, Butto S, Glashoff R, Malnati MS, Poli G, Clerici M: Prepar-
ing for phase II/III HIV vaccine trials in Africa. Microbes Infect
2005, 7:1436-44.
34. Pohla H, Frankenberger B, Stadlbauer B, Oberneder R, Hofstetter A,
Willimsky G, Pezzutto A, Dorken B, Blankenstein T, Schendel DJ: All-
ogeneic vaccination for renal cell carcinoma: development
and monitoring. Bone Marrow Transplant 2000, 25(Suppl 2):S83-7.