Hypoglycemia induced changes in cholinergic receptor expression in the cerebellum of diabetic rats ppt
Bạn đang xem bản rút gọn của tài liệu. Xem và tải ngay bản đầy đủ của tài liệu tại đây (779.93 KB, 9 trang )
Antony et al. Journal of Biomedical Science 2010, 17:7
/>The cost of publication in Journal of Biomedical Science
is bourne by the National Science Council, Taiwan.
Open Access
RESEARCH
© 2010 Antony et al; licensee BioMed Central Ltd. This is an Open Access article distributed under the terms of the Creative Commons
Attribution License ( which permits unrestricted use, distribution, and reproduction in
any medium, provided the original work is properly cited.
Research
Hypoglycemia induced changes in cholinergic
receptor expression in the cerebellum of diabetic
rats
Sherin Antony, Peeyush Kumar T, Jobin Mathew, TR Anju and CS Paulose*
Abstract
Glucose homeostasis in humans is an important factor for the functioning of nervous system. Hypoglycemia and
hyperglycemia is found to be associated with central and peripheral nerve system dysfunction. Changes in
acetylcholine receptors have been implicated in the pathophysiology of many major diseases of the central nervous
system (CNS). In the present study we showed the effects of insulin induced hypoglycemia and streptozotocin induced
diabetes on the cerebellar cholinergic receptors, GLUT3 and muscle cholinergic activity. Results showed enhanced
binding parameters and gene expression of Muscarinic M1, M3 receptor subtypes in cerebellum of diabetic (D) and
hypoglycemic group (D + IIH and C + IIH). α7nAchR gene expression showed a significant upregulation in diabetic
group and showed further upregulated expression in both D + IIH and C + IIH group. AchE expression significantly
upregulated in hypoglycemic and diabetic group. ChAT showed downregulation and GLUT3 expression showed a
significant upregulation in D + IIH and C + IIH and diabetic group. AchE activity enhanced in the muscle of
hypoglycemic and diabetic rats. Our studies demonstrated a functional disturbance in the neuronal glucose
transporter GLUT3 in the cerebellum during insulin induced hypoglycemia in diabetic rats. Altered expression of
muscarinic M1, M3 and α7nAchR and increased muscle AchE activity in hypoglycemic rats in cerebellum is suggested
to cause cognitive and motor dysfunction. Hypoglycemia induced changes in ChAT and AchE gene expression is
suggested to cause impaired acetycholine metabolism in the cerebellum. Cerebellar dysfunction is associated with
seizure generation, motor deficits and memory impairment. The results shows that cerebellar cholinergic
neurotransmission is impaired during hyperglycemia and hypoglycemia and the hypoglycemia is causing more
prominent imbalance in cholinergic neurotransmission which is suggested to be a cause of cerebellar dysfunction
associated with hypoglycemia.
Introduction
Hypoglycemic brain injury is a common and serious com-
plication of insulin therapy in diabetic individuals [1,2].
Studies suggest that acute or chronic hypoglycemia leads to
neurological dysfunction and injury. Severe hypoglycemia
triggers a cascade of events in vulnerable neurons that cul-
minate in cell death even after glucose normalization [3-5].
Children and adults exposed to hypoglycemia can develop
long-term impairment of cognitive function [6] and are at
risk of epilepsy.
Altered neurotransmitter action appears to play a role in
hypoglycemic brain dysfunction [7-9]. Muscarinic acetyl-
choline receptors play important roles in many fundamental
central functions including higher cognitive processes and
modulation of extrapyramidal motor activity. Synaptic ACh
levels are known to be regulated by the activity of presyn-
aptic muscarinic autoreceptors mediating inhibition of ACh
release. In terms of the contribution of cholinergic cerebel-
lar abnormalities to mental function, early reports of cere-
bellar abnormalities in autism [10] and of intellectual and
behavioural abnormalities in patients with cerebellar dam-
age [11] originally suggested a cognitive role for the cere-
bellum. Since then, many studies have confirmed that the
cerebellum contributes to cognitive and other non-motor
functions. There is thus increasing evidence that the cere-
* Correspondence:
1
Molecular Neurobiology and Cell Biology Unit, Centre for Neuroscience,
Department of Biotechnology, Cochin University of Science and Technology,
Cochin - 682 022, Kerala, India
Antony et al. Journal of Biomedical Science 2010, 17:7
/>Page 2 of 9
bellum is involved in cognition, behaviour and emotion
[12]. Cerebellar dysfuncton is associated with poor fine
motor skills, hypotonia [13]. Alterations in glucose utiliza-
tion are known to occur in the important regions of brain
connected with learning and memory [14,15].
Receptors activate a multitude of signaling pathways
important for modulating neuronal excitability, synaptic
plasticity and feedback regulation of ACh release [16]. In
the cerebellum, nicotinic acetylcholine receptors mediate
the release of glutamate [17], GABA [18,19] and norepi-
nephrine [20]. Thus, these receptors significantly influence
the activity within the cerebellar circuitry, and any deregu-
lation of this activity contributes to functional disorders
involving the cerebellum.
The altered levels of neurotransmitter in specific brain
areas in patients with diabetes mellitus [21] and in animals
with experimental diabetes [22-27] have been documented
and implicated in the CNS disorders. Recently we have
reported that muscarinic M1 receptor gene expressions
were decreased in the cerebral cortex, brainstem, hypothal-
amus and pancreatic islets of STZ induced diabetic rats and
insulin modulates the binding parameters and gene expres-
sion [28,29].
Moderate hypoglycemia is known to have significant
impact on functions of the central nervous system, and any
differential effect of hypoglycemia on the peripheral ner-
vous system may offer insights into the metabolic require-
ments of central and peripheral neurons [30]. In a case of
episodic bilateral cerebellar dysfunction caused by hypo-
glycemia, quantitative dynamic PET study demonstrated
decreased glucose uptake-to-utilization ratio and increased
leak of glucose in the cerebellum indicating that cerebellum
is not invariably resistant to hypoglycemia [31]. Studies
from our laboratory have demonstrated that cerebellum is
susceptible to hypoglycemia [32,33]. Studies on damages
of the central nervous system under conditions of hypogly-
cemia are very important for clinical medicine. The main
objective of the present study was to determine whether
hypoglycemia as a consequence of insulin therapy in diabe-
tes altered the binding parameters of Muscarinic M1, M3
receptors and gene expression of α7nAchR, AchE, ChAT
and GLUT3 in the cerebellum and AchE activity in the
muscle of experimental rats.
Materials and methods
Male adult Wistar rats of 200-250 g body weight were used
for all experiments. Animals were divided into the follow-
ing groups as (i) control (C), (ii) diabetic (D), (iii) insulin-
induced hypoglycemia in diabetic rats (diabetic + IIH) and
(iv) insulin-induced hypoglycemia in control rats (control +
IIH). Each group consisted of 6-8 rats. They were housed in
separate cages under 12-h light and 12-h dark periods and
were maintained on standard food pellets and water ad libi-
tum. All animal care and procedures were in accordance
with Institutional and National Institute of Health guide-
lines.
Diabetes was induced in rats by single intrafemoral injec-
tion of streptozotocin (Sigma Chemical Co., St. Louis, MO)
freshly dissolved in 0.1 M citrate buffer, pH 4.5, under
anesthesia. Streptozotocin was given at a dose of 55 mg/kg
body weight [34,35]. The diabetic + IIH group received
daily 2 doses (10 Unit/kg body weight) and control + IIH
group received daily 2 doses (1.5 Unit/kg body weight) of
regular human insulin (Actrapid) [36]. Diabetic + IIH and
control + IIH group had daily two episodes of insulin-
induced hypoglycemia for 10 days. Control rats were
injected with citrate buffer. Glucose was measured by
GOD-POD glucose estimation kit (Biolab Diagnostics Pvt
Ltd). Rats were sacrificed by decapitation on the 10
th
day of
the experiment. The cerebellum was dissected out quickly
over ice according to the procedure of Glowinski and
Iversen [37] and the tissues collected were stored at -80°C
until assayed.
Muscarinic M1 and M3 Receptor Binding Studies in the
Cerebellum
Muscarinic M1 and M3 receptor binding assays were done
using specific antagonists [
3
H]QNB and [
3
H]DAMP in the
cerebellum of rat groups respectively [38]. The tissues were
homogenised in a polytron homogeniser with 20 volumes
of cold 50 mM Tris-HCl buffer, pH 7.4 containing 1 mM
EDTA. The supernatant was then centrifuged at 30,000 × g
for 30 minutes and the pellets were suspended in appropri-
ate volume of Tris-HCl- EDTA buffer. Muscarinic M1
binding assay was done using different concentrations i.e.,
0.1-2.5 nM of [
3
H] QNB in the incubation buffer, pH 7.4 in
a total incubation volume of 250 μl containing appropriate
protein concentrations (200-250 μg). Nonspecific binding
for muscarinic M1 receptor was determined using 100 μM
of pirenzepine (Sigma Chemical Co.). Muscarinic M3 bind-
ing assay was done using different concentrations i.e., 0.1-
2.5 nM of [
3
H] DAMP in the incubation buffer, pH 7.4 in a
total incubation volume of 250 μl containing appropriate
protein concentrations (200- 250 μg). Nonspecific binding
for muscarinic M3 receptor was determined using 100 μM
of 4-DAMP mustard.
Tubes were incubated at 22°C for 60 minutes and filtered
rapidly through GF/C filters (Whatman). The filters were
washed quickly by three successive washing with 5.0 ml of
ice cold 50 mM Tris-HCl buffer pH 7.4. Bound radioactiv-
ity was counted with cocktail-T in a Wallac 1409 liquid
scintillation counter.
Analysis of gene expression by Real-time PCR
RNA was isolated from the cerebellum using Tri reagent.
Total cDNA synthesis was performed using ABI PRISM
cDNA Archive kit. Real-Time PCR assays were performed
in 96-well plates in ABI 7300 Real-Time PCR instrument
Antony et al. Journal of Biomedical Science 2010, 17:7
/>Page 3 of 9
(Applied Biosystems). PCR analyses were conducted with
gene-specific primers and fluorescently labeled Taq for
Muscarinic M1, M3, α7nAchR, ChAT, AchE and GLUT3
mRNA (designed by Applied Biosystems). Endogenous
control, β-actin was labeled with a report dye (VIC). All
reagents were purchased from Applied Biosystems.
The thermocycling profile conditions were as follows:
50°C for 2 min -Activation, 95°C for 10 min - Initial Dena-
turation, 95°C for 15 s - Denaturation 40 cycles, 50°C for
30 s - Annealing, 60°C for 1 min - Final Extension. The
ΔΔCT method of relative quantification was used to deter-
mine the fold change in expression. This was done by first
normalizing the resulting threshold cycle (CT) of the target
mRNAs to the CT-values of the internal control β-actin in
the same samples (ΔCT = CT Target - CT β-actin). It was
further normalized with the control (ΔΔCT = ΔCT - CT
Control). The fold change in expression was then obtained
(2
-ΔΔCT
).
Acetylcholine Esterase Assay in the muscle of control and
experimental rats
Acetylcholine esterase assay was done using the spectro-
photometric method of Ellman et al [39]. The homogenate
(10%) was prepared in 30 mM sodium phosphate buffer,
pH 8.0. One ml of 1% Triton X 100 was added to the homo-
genate to release the membrane bound enzyme and centri-
fuged at 12,500 × g for 30 minutes at 4°C. Different
concentrations of acetylthiocholine iodide were used as
substrate. The mercaptan formed as a result of the hydroly-
sis of the ester reacting with an oxidising agent 5,5' -dithio-
bis (2-Nitrobenzoate) was read at 412 nm.
Protein Determination
Protein was measured by the method of Lowry et al [40]
using bovine serum albumin as standard.
Statistical Analysis
Statistical evaluations were done with analysis of variance
(ANOVA), using GraphPad Instat (version 2.04a, San
Diego, USA).
Results
Blood glucose level in diabetic, Diabetic + IIH and Control +
IIH Rats
Blood glucose level of all rats before streptozotocin admin-
istration and control rats during the treatment period was
within the normal range (80-105 mg/dl). Streptozotocin
administration to rats brought about significant (P < 0.001)
increase in blood glucose level when compared to control
(Table 1). The insulin induced hypoglycemic group showed
a significant (P < 0.001) reduction in blood glucose level.
Enhanced Muscarinic M1, M3 receptor binding in the
Cerebellum of Diabetic, Diabetic + IIH and Control + IIH
Rats
Scatchard analysis of [
3
H] QNB Binding against
Pirenzepine to study muscarinic M1 receptor binding
parameters showed a significant increase in B
max
in the cer-
ebellum of hypoglycemic (P < 0.001) and diabetic (P <
0.001) rats when compared to control. Diabetic hypoglyce-
mic and control hypoglycemic group showed a significant
increase (P < 0.001) in B
max
compared to diabetic rats. Con-
trol hypoglycemic group showed a significant increase (P <
0.001) when compared to Diabetic hypoglycemic group.
The K
d
value of both diabetic hypoglycemic and Control
hypoglycemic groups showed an increase (P < 0.01) when
compared to control and diabetic group (Table 2).
Scatchard analysis of [3H] DAMP Binding against 4-
DAMP parameters showed to study muscarinic M3 recep-
tor binding showed a significant increase in B
max
in the cer-
ebellum of hypoglycemic (P < 0.01) and diabetic (P <
0.001) rats when compared to control. Diabetic hypoglyce-
mic and control hypoglycemic group showed a significant
increase (P < 0.01) in B
max
compared to diabetic rats. Kd of
Control hypoglycemic group showed a significant decrease
(P < 0.01) when compared to diabetic and diabetic hypogly-
cemic group (Table 3).
Increased AchE activity in the muscle of Diabetic, Diabetic +
IIH and Control + IIH Rat
AchE activity in the muscle showed a significant increase
(p < 0.001) in insulin induced hypoglycemia in both dia-
betic and control rats when compared to control and signifi-
Table 1: Blood glucose levels of Control, Diabetic, Diabetic
+ IIH and Control + IIH rats
Animal Status Blood Glucose (mg/dL)
Control 108 ± 5.77
Diabetic 257 ± 3.18
a
D+IIH 47 ± 3.05
a b
C+IIH 44 ± 1.45
a b
Values are Mean ± S.E.M. of 4-6 separate experiments. Each group
consists of 6-8 rats.
a p < 0.001 when compared to control, b p < 0.001 when
compared to Diabetic (D).
IIH- Insulin Induced Hypoglycemia.
Antony et al. Journal of Biomedical Science 2010, 17:7
/>Page 4 of 9
cant increase (p < 0.01) when compared to diabetic rats
(Table 4).
Up regulation of Muscarinic M1, M3, α7nAchR, AchE, GLUT3
mRNA and down regulation of ChAT gene expression in
cerebellum of Diabetic, Diabetic + IIH and Control + IIH Rat
Real-time PCR analysis of Muscarinic M1 receptor mRNA
showed a significant up regulation (p < 0.001) in diabetic
and hypoglycemic rats when compared to control. Diabetic
hypoglycemic and control hypoglycemic group showed a
significant up regulation (p < 0.01) when compared to dia-
betic group. Control hypoglycemic showed a significant up
regulation (p < 0.001) when compared to diabetic hypogly-
cemic group. (Fig: 1). Real-time PCR analysis of Muscar-
inic M3 receptor mRNA showed a significant up regulation
(p < 0.001) in diabetic and hypoglycemic rats when com-
pared to control. Diabetic hypoglycemic and control hypo-
glycemic group showed a significant up regulation (p <
0.001) when compared to diabetic group (Fig: 2)
α7nAchR mRNA expression showed a significant (P <
0.001) up regulation in diabetic rats when compared to con-
trol. The diabetic hypoglycemic and control hypoglycemic
rats showed a significant up regulation (P < 0.001) when
compared to control. Control hypoglycemic group showed
a significant increase (P < 0.001) when compared to dia-
betic hypoglycemic groups. (Fig: 3).
AchE mRNA expression showed an increased gene
expression (P < 0.001) in diabetic and hypoglycemic group
when compared to control. The diabetic hypoglycemic and
control hypoglycemic rat group showed an increased gene
expression (P < 0.001) when compared to diabetic group.
Control hypoglycemic group showed a significant increase
(P < 0.001) when compared to diabetic hypoglycemic
groups. (Fig: 4).
Table 2: Scatchard analysis of [
3
H] QNB binding against pirenzepine in the cerebellum of Control, Diabetic, Diabetic + IIH
and Control + IIH Group of rats
Experimental Group Bmax
(fmoles/mg protein)
Kd
(nM)
Control 127 ± 12.4 0.40 ± 0.03
Diabetic 183 ± 11.5
a
0.41 ± 0.02
D + IIH 245 ± 10.5
ab
0.50 ± 0.03
d
C + IIH 296 ± 9.8
abc
0.54 ± 0.02
d
Values are Mean ± S.E.M. of 4-6 separate experiments. Each group consists of 6-8 rats. a p < 0.001 when compared to control, b p < 0.001 when
compared to Diabetic, c p < 0.01 when compared to D + IIH, d p < 0.01 when compared to diabetic. IIH- Insulin Induced Hypoglycemia.
Table 3: Scatchard analysis of [
3
H] DAMP binding against 4 DAMP in the cerebellum of Control, Diabetic, Diabetic + IIH and
Control + IIH Group of rats
Experimental Group Bmax
(fmoles/mg protein)
Kd
(nM)
Control 12 ± 1.5 0.46 ± 0.02
Diabetic 17 ± 0.5
a
0.45 ± 0.02
D + IIH 20 ± 0.4
ab
0.43 ± 0.01
C + IIH 22 ± 0.5
ab
0.36 ± 0.01
c
Values are Mean ± S.E.M. of 4-6 separate experiments. Each group consists of 6-8 rats. a p < 0.01 when compared to control, b p < 0.01 when
compared to Diabetic, c p < 0.01 when compared to C, D, D + IIH, IIH- Insulin Induced Hypoglycemia.
Antony et al. Journal of Biomedical Science 2010, 17:7
/>Page 5 of 9
ChAT expression showed a significant decrease (P <
0.001) in diabetic rats when compared to control. The dia-
betic hypoglycemic and control hypoglycemic rats showed
a significant downregulation (P < 0.001) when compared to
control. (Fig: 5).
GLUT3 mRNA in the cerebellum showed a significant up
regulation in gene expression (P < 0.001) in diabetic rats
and hypoglycemic group when compared to control. The
diabetic hypoglycemic and control hypoglycemic rats also
showed a significant increased (P < 0.001) gene expression
compared to diabetic (Fig: 6).
Discussion
Hypoglycemia impose alterations upon both the central
(CNS) and peripheral (PNS) nervous systems which leads
to brain damage and long-term cognitive impairment. The
brain and other tissues require glucose in order to function
properly. Neurotransmitters show significant alterations
during hyperglycemia and cause degenerative changes in
neurons of the central nervous system [41,42]. Severe
hypoglycemia with brain dysfunction limits intensified
therapy in patients with insulin dependent diabetes mellitus,
despite evidence that such therapy reduces the risk of
chronic complications of the disease [43].
Table 4: Acetylcholine esterase activity in the muscle of Control and experimental rats
Animal status Vmax
(Enzyme Units/mg ptn)
Km
(mM)
Control 8.40 ± 0.02 0.20 ± 0.04
Diabetic 6.58 ± 0.07
a
0.22 ± 0.06
D + IIH 16.00 ± 0.06
ab
0.20 ±0.04
C + IIH 15.15 ± 0.08
ab
0.20 ± 0.10
Values are Mean ± S.E.M. of 4-6 separate experiments. Each group consists of 6-8 rats. a p < 0.001 when compared to control, b p < 0.01 when
compared to Diabetic. IIH- Insulin Induced Hypoglycemia.
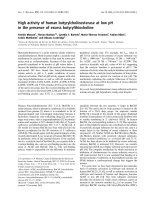
Figure 1 Representative graph showing Real Time PCR amplifica-
tion of muscarinic M1 mRNA from the cerebellum of Control, Dia-
betic, Diabetic + IIH and Control + IIH Rats. The ΔΔCT method of
relative quantification was used to determine the fold change in ex-
pression with β-actin CT value as the internal control and Control CT
value as the calibrator. C- Control, D- Diabetic, D + IIH - Insulin induced
hypoglycemia in diabetic, C + IIH - Insulin induced hypoglycemia in
control. Values are mean ± S.D. of 4-6 separate experiments. Each
group consisted of 6-8 rats. a p < 0.001 when compared to control, b p
< 0.01 when compared to Diabetic, c p < 0.001 when compared to D
+ IIH.
0
0.5
1
1.5
2
2.5
C D D + IIH C + IIH
Log RQ
a
abc
ab
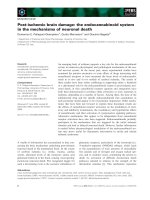
Figure 2 Representative graph showing Real Time PCR amplifica-
tion of muscarinic M3 mRNA from the cerebellum of Control, Dia-
betic, Diabetic + IIH and Control + IIH Rats. The ΔΔCT method of
relative quantification was used to determine the fold change in ex-
pression with β-actin CT value as the internal control and Control CT
value as the calibrator. C- Control, D- Diabetic, D + IIH - Insulin induced
hypoglycemia in diabetic, C + IIH - Insulin induced hypoglycemia in
control. Values are mean ± S.D. of 4-6 separate experiments. Each
group consisted of 6-8 rats. a p < 0.001 when compared to control. b p
< 0.001 when compared to Diabetic.
0
0.5
1
1.5
2
2.5
C D D + IIH C + IIH
Log RQ
a
ab ab
Antony et al. Journal of Biomedical Science 2010, 17:7
/>Page 6 of 9
In our earlier studies, we reported the glutamate mediated
excitotoxicity in the cerebellum of insulin induced hypogly-
cemic and streptozotocin induced diabetic rats [32]. In the
present study, we have demonstrated the role of cholinergic
receptors during recurrent hypoglycemia in diabetic rats.
Experimental evidence indicate the involvement of the cer-
ebellum in variety of human mental activities including lan-
guage, attention, cognitive affective syndromes [44] and
motor relearning [45]. The cerebellar vermis integrates and
processes the inputs from the vestibular, visual and proprio-
ceptive systems to coordinate muscle timing as a result of
which the centre of gravity stays within the limits of stable
upright standing [46]. Cerebellum participates in learning
and coordination of anticipatory operations which are nec-
essary for the effective and timely directing of cognitive
and non-cognitive resources [47]. Diabetes mellitus has
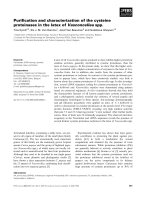
Figure 3 Representative graph showing Real Time PCR amplifica-
tion of α7nAchR mRNA from the cerebellum of Control, Diabetic,
Diabetic + IIH and Control + IIH Rats. The ΔΔCT method of relative
quantification was used to determine the fold change in expression
with β-actin CT value as the internal control and Control CT value as
the calibrator. C- Control, D- Diabetic, D + IIH - Insulin induced hypo-
glycemia in diabetic, C + IIH - Insulin induced hypoglycaemia in con-
trol. Values are mean ± S.D. of 4-6 separate experiments. Each group
consisted of 6-8 rats. a p < 0.001 when compared to control, b p <
0.001 when compared to Diabetic, c p < 0.001 when compared to D +
IIH.
0
1
2
3
4
5
6
7
C D D + IIH C + IIH
Log RQ
a
ab
abc
Figure 4 Representative graph showing Real Time PCR amplifica-
tion of AchE mRNA from the cerebellum of Control, Diabetic, Dia-
betic + IIH and Control + IIH Rats. The ΔΔCT method of relative
quantification was used to determine the fold change in expression
with β-actin CT value as the internal control and Control CT value as
the calibrator. C- Control, D- Diabetic, D + IIH - Insulin induced hypo-
glycemia in diabetic, C + IIH - Insulin induced hypoglycemia in control.
Values are mean ± S.D. of 4-6 separate experiments. Each group con-
sisted of 6-8 rats. a p < 0.001 when compared to control, b p < 0.001
when compared to Diabetic, c p < 0.001 when compared to D + IIH.
0
0.5
1
1.5
2
2.5
3
3.5
4
C D D + IIH C + IIH
Log RQ
a
ab
abc
Figure 5 Representative graph showing Real Time PCR amplifica-
tion of ChAT mRNA from the cerebellum of Control, Diabetic, Di-
abetic + IIH and Control + IIH Rats. The ΔΔCT method of relative
quantification was used to determine the fold change in expression
with β-actin CT value as the internal control and Control CT value as
the calibrator. Values are mean ± S.D. of 4-6 separate experiments. Each
group consisted of 6-8 rats. a p < 0.001 when compared to control, b p
< 0.001 when compared to Diabetic.
-2
-1.8
-1.6
-1.4
-1.2
-1
-0.8
-0.6
-0.4
-0.2
0
C D D + IIH C + IIH
Log RQ
a
a b
a b
Figure 6 Representative graph showing Real Time PCR amplifica-
tion of GLUT3 mRNA in the cerebellum of Control, Diabetic, Dia-
betic + IIH and Control + IIH Rats. The ΔΔCT method of relative
quantification was used to determine the fold change in expression
with β-actin CT value as the internal control and Control CT value as
the calibrator. C- Control, D- Diabetic, D + IIH - Insulin induced hypo-
glycemia in diabetic, C + IIH - Insulin induced hypoglycemia in control.
Values are mean ± S.D. of 4-6 separate experiments. Each group con-
sisted of 6-8 rats. a p < 0.001 when compared to control, b p < 0.001
when compared to Diabetic.
0
0.2
0.4
0.6
0.8
1
1.2
1.4
1.6
C D D + IIH C + IIH
Log RQ
a
a b
a b
Antony et al. Journal of Biomedical Science 2010, 17:7
/>Page 7 of 9
been reported to be accompanied by a number of behavioral
and hormonal abnormalities, including reduced locomotor
activity [48]. Acute hypo- and hyperglycemia have disrup-
tive effects on the central nervous system [49,50]. Compli-
cations associated with diabetes involve neuronal damage
which leads to altered neurotransmitter functions and
reduced motor activity.
Glucose sensitive neurons organize and respond to
changes in a number of hormonal, metabolic, transmitter,
and peptide signals which involve the regulation of energy
homeostasis and other biological functions [51]. Glucose
deprivation causes neuronal death affecting the cognitive
and memory ability. Hypoglycemia and glucose deprivation
causes mitochondrial damage [52]. GLUT3 is one of the
predominant glucose transporters located on neurons [53].
GLUT3 had its highest expression in brain and neural tissue
hence being called the brain glucose transporter [54]. Our
results shows an increased gene expression of GLUT3
expression in cerebellum of diabetic group and the hypo-
glycemic group showed a significant increase compared to
diabetic group which shows that cerebellar glucose trans-
port impairment is maximal during insulin induced hypo-
glycemia leading to neuronal dysfunction. Recent study
demonstrated decreased glucose uptake-to-utilization ratio
and increased leak of glucose in the cerebellum which
showed that the cerebellum is not invariably resistant to
hypoglycemia [55]. Disorders in the transport and metabo-
lism of glucose are an important signal for triggering the
apoptotic cascade [56].
Changes in acetylcholine receptor have been implicated
in the pathophysiology of many major diseases of the cen-
tral nervous system. As in brain injury associated with
ischaemia and neurodegenerative conditions, altered neu-
rotransmitter action appears to play a role in hypoglycemic
brain injury [7-9]. Cholinergic receptors activate a multi-
tude of signaling pathways important for modulating neu-
ronal excitability, synaptic plasticity and feedback
regulation of ACh release [16]. The Muscarinic acetylcho-
line receptors are widely distributed throughout the body,
but are predominantly expressed within the parasympa-
thetic nervous system and exert both excitatory and inhibi-
tory control over central and peripheral tissues. In the
present study, enhanced muscarinic M1 and M3 receptor
binding in the cerebellum of insulin induced hypoglycemia
in both diabetic and nondiabetic rats along with increased
AchE activity and decreased ChAT expression shows
altered acetylcholine metabolism in the cerebellum. Cogni-
tive deficits are reported to be connected with impairments
of the cholinergic system [57]. Muscarinic acetylcholine
receptor subtypes together with the activity of the cholinest-
erases (ChEs), mediate facilitation or depression of synap-
tic transmission [58] and AChE activity has been found to
determine the range of ACh concentrations. Previous
reports shows that insulin-induced hypoglycemia in normo-
thermic rats caused progressive neurological depression
and differentially altered regional cerebral acetylcholine
metabolism [59].
Neuronal nicotinic cholinergic receptors are crucial to
acetylcholine neurotransmission in CNS. Our results show
a significant upregulation in α7nAchR gene expression
induced by hypoglycemia in diabetes and control rats when
compared to diabetic rats which is suggested to cause nico-
tinic receptor mediated dysfunction. α7nAChRs are located
in brain areas important for cognition and dysfunction of
α7nAChRs in cerebellum is associated with cholinergic
deficit. In the cerebellum, nicotinic acetylcholine receptors
mediate the release of glutamate [17], GABA [18] and nor-
epinephrine [20]. Thus, these receptors significantly influ-
ence the activity within the cerebellar circuitry, and any
deregulation of this activity contributes to functional defi-
cit.
Acetylcholine mediated neurotransmission is involved in
neuromuscular functions cerebellar dysfunction is associ-
ated with poor fine motor skills and hypotonia [13]. Acetyl-
cholinesterase is critical for ensuring normal synaptic
transmission. It is found that patients who recover from
severe hypoglycemia are left with difficulties in cognition,
particularly short-term memory, out of proportion to gross
motor disability [4]. Our results showed an increased ace-
tylcholine esterase activity in the muscle of hypoglycemic
rats compared to diabetic group which shows neuromuscu-
lar dysfunction mediated by acetylcholine in the muscle of
experimental rats. Up regulation of glutamate receptor
activity causing motor dysfunction associated with cerebel-
lum was demonstrated by the rotarod test in our previous
studies [60]. Integrity of the neuromuscular junction is
altered during hypoglycemia as reported by Thomareis et al
[61]. It is observed that there is occurrence of seizures in
hypoglycemic state which is due to the decreased glucose
for the brain cells to function [62].
To summarise, our results shows dysfunction of cerebel-
lar cholinergic receptor due to impaired neuronal glucose
transport in the cerebellum during recurrent hypoglycemia
in diabetic rats. The receptor analysis and gene expression
studies along with muscle acetylcholine esterase activity
implicate a role for acetylcholine and cholinergic receptors
in the modulation of neuronal network excitability and neu-
romuscular dysfunction associated with hypoglycemia. Our
results supports previous reports that cerebellum is not
spared during recurrent hypoglycemia in diabetes. These
neurofunctional deficits are one of the key contributors to
motor deficits and cellular stress associated with hypogly-
cemia in diabetes which is suggested to cause more damage
at molecular level than hyperglycemia.
Abbreviations
AchE: acetycholine esterase; ChAT: choline acetyltransferase; α7nAchR: alpha7
nicotinic acetylcholine receptor; QNB: Quinuclidinyl benzilate; L: benzilic - 4,4';
Antony et al. Journal of Biomedical Science 2010, 17:7
/>Page 8 of 9
DAMP: 4- deoxy acetyl methyl piperidine mustard; D + IIH: Insulin induced
hypoglycemia in diabetes; C + IIH: Insulin induced hypoglycemia in Control.
Competing interests
The authors declare that they have no competing interests.
Authors' contributions
SA and CSP designed research. SA and PKT carried out experiments and
drafted the manuscript. JM and ATR helped in experiments. All authors read
and approved the final manuscript.
Acknowledgements
This work was supported by research grants from DBT, DST, ICMR, Govt. of India
and KSCSTE, Govt. of Kerala to Dr. C. S. Paulose. Sherin Antony thanks Council of
Scientific and Industrial Research (CSIR) for Senior Research Fellowship. Peey-
ush Kumar T thanks DST for SRF. Jobin Mathew thanks CSIR for SRF.
Author Details
Molecular Neurobiology and Cell Biology Unit, Centre for Neuroscience,
Department of Biotechnology, Cochin University of Science and Technology,
Cochin - 682 022, Kerala, India
References
1. Pramming S, Thorsteinsson B, Bendtson I, Binder C: Symptomatic
hypoglycaemia in 411 type 1 diabetic patients. Diabet Med 1991,
8:217-222.
2. Boyle NR, O' Connor A, Kempers S, Yeo R, Qualis C: Adaption in brain
glucose uptake following recurrent hypoglycemia. Proc Acad Sci USA
1994, 91:9352-9356.
3. Suh SW, Aoyama K, Chen Y, Garnier P, Matsumori Y, Gum E, Liu J, Swanson
RA: Hypoglycemic neuronal death and cognitive impairment are
prevented by poly (ADP-ribose) polymerase inhibitors administered
after hypoglycemia. J Neurosci 2003, 23:10681-10690.
4. Suh SW, Garnier P, Aoyama K, Chen Y, Swanson RA: Zinc release
contributes to hypoglycemia-induced neuronal death. Neurobiol Dis
2004, 16:538-545.
5. Suh SW, Aoyama K, Matsumori Y, Liu J, Swanson RA: Pyruvate
administered after severe hypoglycemia reduces neuronal death and
cognitive impairment. Diabetes 2005, 54:1452-1458.
6. Vannucci RC, Vannucci SJ: Hypoglycemic brain injury. Semin Neonatol
2001, 6:147-155.
7. Aral YZ, Gucuyener K, Atalay Y, Hasanoglu A, Turkyilmaz C, Sayal A,
Biberoglu G: Role of excitatory aminoacids in neonatal hypoglycemia.
Acta Paediatr Jpn 1998, 40:303-306.
8. Auer RN: Excitotoxic mechanisms and age-related susceptibility to
brain damage in ischemia, hypoglycemia and toxic mussel poisoning.
Neurotoxicol 1991, 12:541-546.
9. Auer RN, Siesjo BK: Hypoglycaemia: brain neurochemistry and
neuropathology. Baillieres Clin Endocrinol Metab 1993, 7:611-625.
10. Courchesne E: New Evidence of Cerebellar and Brainstem Hypoplasia in
Autistic Infants, Children and Adolescents: The MR Imaging Study by
Hashimoto and Colleagues. J Autism Dev Disord 1995, 25:19-22.
11. Botez-Marquard TC, Bard J, Léveillé MI, Botez : A severe frontal-parietal
lobe syndrome following cerebellar damage. Eur J of Neurol 2001,
8:347-353.
12. Schmahmann JD, Caplan David: Cognition, emotion and the cerebellum
Brain. 2006, 129:290-292.
13. Wassmer E, Davies Paul, William P, Whitehouse , Stuart H, Green : Clinical
spectrum associated with cerebellar hypoplasia. Pediatr Neurol 2003,
28:347-351.
14. Krebs DL, Parent MB: The enhancing effects of hippocampal infusions of
glucose are not restricted to spatial working memory. Neurobiol Learn
Mem 2005, 83:168-172.
15. McNay EC, Thomas M, Fries Paul E, Gold : Decreases in rat extracellular
hippocampal glucose concentration associated with cognitive
demand during a spatial task. Proc Natl Acad Sci USA 2000, 97:2881-2885.
16. Volpicelli LA, Levey AI: Muscarinic acetylcholine receptor subtypes in
cerebral cortex and hippocampus. Prog Brain Res 2004, 145:59-66.
17. Reno LA, Zago W, Markus RP: Release of [3H]-L-glutamate by stimulation
of nicotinic acetylcholine receptors in rat cerebellar slices. Neurosci
2004:647-653.
18. De Filippi G, Baldwinson T, Sher E: Evidence for nicotinic acetylcholine
receptor activation in rat cerebellar slices. Pharmacol Biochem Behav
2001, 70:447-455.
19. Rossi DJ, Hamann M, Attwell D: Multiple modes of GABAergic inhibition
of rat cerebellar granule cells. J Physiol 2003, 548:97-110.
20. O'Leary KT, Leslie FM: Developmental regulation of nicotinic
acetylcholine receptormediated [3H] norepinephrine release from rat
cerebellum. J Neurochem 2003, 84:952-959.
21. Lackovic Z, Salkovic M, Kuci Z, Relja M: Dopamine, norepinephrine and
serotonin in the brain of diabetic rats and man. Journal of
Neurochemistry 1985, 44:94-98.
22. Bitar M, Koulu M, Rapoport SI, Linnoila M: Diabetes induced alterations in
brain monoamine metabolism in rats. Journal of Pharmacology and
Experimental Therapeutics 1986, 236:432-437.
23. Saller CF: Dopaminergic activity is reduced in diabetic rats.
Neuroscience Letters 1984, 49:301-306.
24. Caulfield MP, Birdsall NJM: Classification of muscarinic acetylcholine
receptors. Pharmacol Rev 1998, 50:279-290.
25. Kwok RPS, Walls EK, Juoria AV: The concentrations of dopamine 5
Hydroxytryptamine and some of their acid metabolites in the brain of
genetically diabetic rats. Neurochemical Research 1985, 10:611-616.
26. Chen CC, Yang JC: Effects of short and long-lasting diabetes mellitus on
mouse brain monoamines. Brain Research 1991, 552:175-179.
27. Tasaka Y, Matsumoto H, Inove Y, Hirata Y: Brain catecholamine
concentrations in hyperosmolar diabetic and diabetic rats. Diabetes
Research 1992, 19:1-7.
28. Gireesh G, Kaimal SB, Kumar TP, Paulose CS: Decreased muscarinic M1
receptor gene expression in the hypothalamus, brainstem, and
pancreatic islets of streptozotocin-induced diabetic rats. J Neurosci Res
2007, 86:947-953.
29. Gireesh G, Reas SK, Jobin M, Paulose CS: Decreased muscarinic M1
receptor gene expression in the cerebral cortex of streptozotocin-
induced diabetic rats and Aegle marmelose leaf extract's therapeutic
function. J Ethnopharmacol 2007, 116:296-304.
30. Strachan MWJ, Ian JD, Fiona ME, Ewinga Stewart SC, Fergusona Matthew
JY, Brian MF: Acute hypoglycemia impairs the functioning of the central
but not peripheral nervous system. Physiol Behav 2001, 72:83-92.
31. Kim DE, Park SH, Kim SK, Nam HW, Lee YS, Chung JK, Roh JK:
Hypoglycemia-induced cerebellar dysfunction and quantitative
positron emission tomography study. Neurol 2000, 55:418-422.
32. Joseph A, Remya R, Paulose CS: Enhanced [3H] Glutamate Binding in the
Cerebellum of Insulin-Induced Hypoglycaemic and Streptozotocin-
Induced Diabetic Rats. Cell Mol Neurobiol 2007, 27:1085-1095.
33. Joseph A, Antony S, Paulose CS: Increased Glutamate Receptor Gene
Expression In The Cerebral Cortex Of Insulin Induced Hypoglycemic
And Streptozotocin-Induced Diabetic Rats. Neuroscience 2008,
156:298-304.
34. Hohenegger M, Rudas B: Kidney function in experimental diabetic
ketosis. Diabetol 1971, 7:334-338.
35. Arison RN, Ciaccio EI, Glitzer MS, Cassaro JA, Pruss MP: Light and electron
microscopy of lesions in rats rendered diabetic with streptozotocin.
Diabetes 1967, 16:51-56.
36. Flanagan DE, Evans ML, Monsod TP, Rife F, Heptulla RA, Tamborlane WV,
Sherwin RS: The influence of insulin on circulating ghrelin. Am J Physiol
Endocrinol Metab 2003, 284:E313-E316.
37. Glowinski J, Iversen LL: Regional studies of catecholamines in the rat
brain. The disposition of [3H] norepinephrine, [3H] dopamine and [3H]
dopa in various regions of the brain. J Neurochem 1966, 13:655-669.
38. Yamamura HI, Synder G: Binding of [
3
H] QNB in rat brain. Proc Natl Acad
Sci USA 1981, 71:1725-1729.
39. Ellman GL, Courteney KD, Andres V, Featherstone RMA: New and rapid
colorimetric determination of acetylcholinesterase activity. Biochem
Pharmacol 1961, 7:88-95.
40. Lowry OH, Roserbbrough N, Farr AL, Randall RJ: Protein measurement
with Folin phenol reagent. J Biol Chem 1951, 193:265-275.
41. Lackovic Z, Salkovic M, Kuci Z, Relja M: Effect of long-lasting diabetes
mellitus on rat and human brain monoamines. J Neurochem 1990,
541:43-147.
Received: 1 January 2010 Accepted: 5 February 2010
Published: 5 February 2010
This article is available from: 2010 Antony et al; licensee BioMed Central Ltd. This is an Open Access article distributed under the terms of the Creative Commons Attribution License ( ), which permits unrestricted use, distribution, and reproduction in any medium, provided the original work is properly cited.Journal of Biomedical Science 2010, 17:7
Antony et al. Journal of Biomedical Science 2010, 17:7
/>Page 9 of 9
42. Maran A, Cranston I, Lomas J, Macdonald I, Amiel SA: Protection by
lactate of cerebral function during hypoglycaemia. Lancet 1994,
343:16-20.
43. Gowen E, Miall C: Behavioural aspects of cerebellar function in adults
with Asperger syndrome. Cerebellum 2005, 4:1-11.
44. Imazumi H, Miyauchi S, Tamada T, Sasaki Y, Takino R, Putz B, Yoshioka T,
Kawato M: Human cerebellar activity reflecting an acquired internal
model of a new tool. Nature 2000, 3:192-195.
45. Diener H, Dichgans J, Guschlbauer B, Bacher M, Langenbach P:
Disturbances of motor preparation in basal ganglia and cerebellar
disorders. Prog Brain Res 1989, 80:481-488.
46. Allen G, Buxton RB, Wong EC, Courchesne E: Attentional activation of the
cerebellum independent of motor involvement. Science 1997,
275:1940-1943.
47. Marchall JF, Friedman MI, Heffner TG: Reduced anorexic and locomotor-
stimulant action of D-amphetamine in alloxan-diabetic rats. Brain Res
1976, 111:428-432.
48. Jacobson AM, Weinger K: Treating depression in diabetic patients, is
there an alternative to medications. Ann Intern Med 1998, 129:656-657.
49. Gispen WH, Biessels GJ: Cognition and synaptic plasticity in diabetes
mellitus. Trends in Neurosci 2000, 23:542-549.
50. Levin BE, Routh VH, Kang L, Sanders NM, Dunn Meynell AA: Diabetes 2004,
53:2521-2528.
51. Delgado Esteban M, Almeida A, Bolanos JP: Glucose prevents
glutathione oxidation and mitochondrial damage after glutamate
receptor stimulation in rat cortical primary neurons. J Neurochem 2000,
75:1618-1624.
52. McCall AL: The impact of diabetes on the CNS. Diabetes 1992,
41:557-570.
53. Gould GW, Holman GD: The glucose transporter family, structure,
function and tissue-specific expression. Biochem J 1993, 295:295-329.
54. Kim M, Zhao-Xue Yu, Bertil BF, Scott R: Susceptibility of the developing
brain to acute hypoglycemia involving A1 adenosine receptor
activation. Am J Physiol Endocrinol Metab 2005, 289:E562-E569.
55. Mueckler MM: Glucose Transport and Glucose Homeostasis: New
Insights from Transgenic Mice. News Physiol Sci 1995, 10:22-29.
56. Donat CK, Schuhmann MU, Voigt C, Nieber K, Deuther-Conrad W, Brust P:
Time dependent alterations of cholinergic markers after experimental
traumatic brain injury. Brain Res 2008, 1246:167-177.
57. Kuczewski N, Eugenio A, Dinesh G, Jürgen Wess, Luciano D: Acetylcholine
modulates cortical synaptic transmission via different muscarinic
receptors, as studied with receptor knockout mice. J Physiol 2005,
566:907-919.
58. Ghajar JB, Gibson GE, Duffy TE: Regional acetylcholine metabolism in
brain during acute hypoglycemia and recovery. J Neurochem 1985,
44:94-98.
59. Sang SW, Gum ET, Hamby AM, Chan PH, Swanson RA: Hypoglycaemic
neuronal death is triggered by glucose reperfusion and activation of
neuronal NADPH oxidase. J Clin Invest 2007, 117:910-918.
60. Joseph Anu, Kumar T Peeyush, Nandhu MS, Paulose CS: Enhanced
NMDAR1, NMDA2B and mGluR5 Receptors Gene Expression In The
Cerebellum Of Insulin Induced Hypoglycaemic And Streptozotocin
Induced Diabetic Rats. Eur J of Pharmacol 2010 in press.
61. Thomareis O, Parlapani A, Kovatsi L, Giala M: Effect of succinylcholine on
the neuromuscular junction of hypoglycemic rats. Methods Find Exp
Clin Pharmacol 2000, 22:155-158.
62. Gordon MJ: Hypoglycemia and seizures in large full-term neonates.
AAP Grand Rounds 2006, 16:43-44.
doi: 10.1186/1423-0127-17-7
Cite this article as: Antony et al., Hypoglycemia induced changes in cholin-
ergic receptor expression in the cerebellum of diabetic rats Journal of Bio-
medical Science 2010, 17:7