Novel biomarkers predict liver fibrosis in hepatitis C patients: alpha 2 macroglobulin, vitamin D binding protein and apolipoprotein AI pdf
Bạn đang xem bản rút gọn của tài liệu. Xem và tải ngay bản đầy đủ của tài liệu tại đây (1008 KB, 7 trang )
Ho et al. Journal of Biomedical Science 2010, 17:58
/>Open Access
RESEARCH
© 2010 Ho et al; licensee BioMed Central Ltd. This is an Open Access article distributed under the terms of the Creative Commons Attri-
bution License ( which permits unrestricted use, distribution, and reproduction in any
medium, provided the original work is properly cited.
Research
Novel biomarkers predict liver fibrosis in hepatitis
C patients: alpha 2 macroglobulin, vitamin D
binding protein and apolipoprotein AI
Ai-Sheng Ho
†1
, Chun-Chia Cheng
†2,3
, Shui-Cheng Lee
3
, Meng-Lun Liu
1
, Jing-Ying Lee
1
, Wen-Ming Wang
4,5,6
and Chia-
Chi Wang*
7
Abstract
Background: The gold standard of assessing liver fibrosis is liver biopsy, which is invasive and not without risk.
Therefore, searching for noninvasive serologic biomarkers for liver fibrosis is an importantly clinical issue.
Methods: A total of 16 healthy volunteers and 45 patients with chronic hepatitis C virus (HCV) were enrolled (F0: n =
16, F1: n = 7, F2: n = 17, F3: n = 8 and F4: n = 13, according to the METAVIR classification). Three serum samples of each
fibrotic stage were analyzed by two-dimension difference gel electrophoresis (2D-DIGE). The differential proteins were
identified by the cooperation of MALDI-TOF/TOF and MASCOT; then western blotting and Bio-Plex Suspension Array
were used to quantify the protein levels.
Results: Three prominent candidate biomarkers were identified: alpha 2 macroglobulin (A2M) is up regulated; vitamin
D binding protein (VDBP) and apolipoprotein AI (ApoAI) are down regulated. The serum concentration of A2M was
significantly different among normal, mild (F1/F2) and advanced fibrosis (F3/F4) (p < 0.01). The protein levels of VDBP
and ApoAI were significantly higher in normal/mild fibrosis, when compared to those in advanced fibrosis (both p <
0.01).
Conclusions: This study not only reveals three putative biomarkers of liver fibrosis (A2M, VDBP and ApoAI) but also
proves the differential expressions of those markers in different stages of fibrosis. We expect that combination of these
novel biomarkers could be applied clinically to predict the stage of liver fibrosis without the need of liver biopsy.
Introduction
In hepatitis C virus (HCV)-infected patients, liver fibrosis
is a noticeable disease and could progress to liver cirrho-
sis or hepatocellular carcinoma gradually. Although the
pathogenesis of HCV-infected fibrosis is poorly under-
stood, liver fibrosis may be a response of repair when liver
is injured or inflamed [1]. In addition, the detection of
early stage of liver fibrosis is very important before the
irreversible damage occurs. Liver biopsy followed by his-
tological examination is still the gold standard for the
assessment of liver fibrosis [2]. However, it has several
limits and disadvantages such as invasive character and
sampling error [3-5]. Therefore, it is necessary to have a
reliable and noninvasive assessment for liver fibrosis.
Two-dimension difference gel electrophoresis (2D-
DIGE), first proposed by Unlu et al [6], allow different
samples to be labeled with cy3 or cy5 flour in one gel. It
used cy2-labeled internal standard to tell the differences
and found out the reliable biomarkers among different
gels. Furthermore, multi-analyte profiling (xMAP) tech-
nique was used to quantify the concentration of putative
biomarkers. By using these methods, we could not only
identify but also quantify the candidate biomarkers,
which could be a serologic predictor for the severity of
liver fibrosis. In this study, we enrolled patients of chronic
HCV infection and healthy controls, and used proteomic
technique to analyze their sera. The aim is to search for
noninvasive serological biomarkers of liver fibrosis,
* Correspondence:
7
Division of Gastroenterology, Buddhist Tzu Chi General Hospital, Taipei
branch, Taiwan
†
Contributed equally
Full list of author information is available at the end of the article
Ho et al. Journal of Biomedical Science 2010, 17:58
/>Page 2 of 7
which could predict the stage of fibrosis without the need
of liver biopsy.
Materials and methods
Serum samples
Totally 61 serum samples from 45 patients of chronic
HCV infection and 16 healthy volunteers were obtained
from Cheng Hsin General Hospital in Taiwan (approval
No. 97016). The assessment of liver fibrosis was based on
liver biopsy and subsequent histological examination.
The stage was determined according to METAVIR classi-
fication [7]. The stages of liver fibrosis were distributed as
following in the chronic hepatitis C patients: F1, n = 7, F2,
n = 17, F3, n = 8 and F4, n = 13. The serum samples of
healthy control (F0 stage, n = 16) were obtained from
healthy volunteers who had no evidence of known hepati-
tis. Liver biopsy was not performed in these subjects due
to ethical issues.
Two dimension-difference gel electrophoresis
The serum samples were diluted 1:5 with lysis buffer (50
mM Tris-HCl, 8M urea, 4% (w/v) 3-[(3-Cholamidopro-
pyl) dimethylammonio]-1-propanesulfonate, and pH 8.5).
The protein concentration was measured (DC™ Protein
Assay Kit, Bio-Rad) and individual 50 μg of protein sam-
ple was allowed to label with 400 pmol of cy3 or cy5. In
addition, pooled internal standard (400 μg) was allowed
to label with 3200 pmol of cy2. Subsequently the solution
was added 1 μL of 10 mM lysine to stop the reaction. The
serum samples of labeled-cydyes and its arrangement are
presented in Table 1. Each mixture was added twofold
volume of sample buffer (8 M urea, 20 mM dithiothreitol,
4% (w/v) 3-[(3-Cholamidopropyl) dimethylammonio]-1-
propanesulfonate, 0.5% (v/v) IPG buffer and few bro-
mophenol blue) and performed with 18 cm, pH 4-7 IPG
strips for the isoelectric focusing (IEF) at 20°C (30000 Vh)
(IPGphor system, GE Healthcare). After equilibration,
the strips were overlaid on individual 12.5% polyacrylam-
ide gels and added 0.5% agarose to immobile the strips.
After electrophoresis, the cy2, cy3, and cy5-labeled
images were acquired (Typhoon TRIO Variable Mode
Imager, GE Healthcare) using 488, 532, and 633 nm lasers
with an emission filter of 520, 532, and 670 nm respec-
tively. All gels were analyzed by using DeCyder 6.5 soft-
ware (GE Healthcare) to select and match all protein
spots. The estimated number of spots was set at 10000.
Spot maps of the filtered gels were saved and imported to
Biological Variation Analysis program for inter-gel
matching and statistical analyses. The interesting protein
spots were selected according to one-way ANOVA with a
significant value of 0.05 or less.
In-gel tryptic digestion
The gels were stained with Sybro Ruby (sigma) for at least
four hours and then destained with 10% methanol/7%
acetic acid for exactly 30 min. The interesting proteins in
the gels were picked up manually on UV transilluminator
(Spectroline). Those gel particles were washed with 10%
methanol/7% acetic acid overnight to remove Sybro Ruby
chemicals thoroughly; 100 μL of 25 mM ammonium
bicarbonate in 50% acetonitrile for 15 min; 200 μL of 25
mM ammonium bicarbonate in deionized water for 15
min twice. The saturated gel particles were added enough
acetonitrile to shrink for 5 min. After drying down, the
gel particles were added 3 μL of 20 ng/μL trypsin in 25
mM ammonium bicarbonate at 4°C for 1 hour and subse-
quently added 3 μL of 25 mM ammonium bicarbonate to
keep the gels wet at 56°C for 1 hour. After In-gel digestion
the solution were added 2 μL of 100% acetonitrile with 1%
trifluoracetic acid and sonicated for 10 min to release
peptides from gel particles.
Mass spectrometric analysis for protein identification
Each trypsin-digested solution was mixed 1:1 with 10
mg/mL α-cyano-4-hydroxycinnamic acid in 50% ace-
tonitrile/0.1% trifluoracetic acid and spotted on
AnchorChip MALDI target (Bruker Daltonics GmbH,
Bremen, Germany). Peptides were analyzed with
MALDI-TOF/TOF UltraflexIII (Bruker Daltonics) by
peptide mass fingerprinting after calibration in positive
Table 1: Arrangement for protein samples labeled with three CyDye flours
Gel Cy2 Cy3 Cy5
1 Pool of samples F0 (1) F2 (1)
2 Pool of samples F3 (1) F0 (2)
3 Pool of samples F0 (3) F4 (1)
4 Pool of samples F2 (2) F1 (1)
5 Pool of samples F1 (2) F3 (2)
6 Pool of samples F4 (2) F1 (3)
7 Pool of samples F3 (3) F2 (3)
8 Pool of samples F0 (1) F4 (3)
Ho et al. Journal of Biomedical Science 2010, 17:58
/>Page 3 of 7
reflection mode under 20 KV and calculated the molecu-
lar weight with FlexAnalysis™ 3.0 software (Bruker Dal-
tonics). MASCOT 2.2 (Matrix Science) was used to
match the peptides with NCBI or Swiss-Prot database for
protein identification. The calculation was restricted to
human taxonomy, allowing carbamidomethyl cysteine as
a fixed modification and oxidized methionine as a vari-
able modification. The probability was based on Mowse
score calculated from -10 × Log (P), where P was the
probability that the observed match was a random event.
Protein scores greater than 56 were significant (p < 0.05).
Moreover, one of the major peptide peaks appeared on
the spectrum was used to confirm the searching result by
peptide fragment fingerprinting method.
Western blotting
Each serum sample was diluted 1:10 with sodium dodecyl
sulfate buffer (50 mM Tris-Cl, 8 M urea, 30% glycerol, 2%
sodium dodecyl sulfate, 20 mM dithiothreitol and 0.1%
bromophenol blue). The sample solutions were heated at
100°C for 5 min; and then 2 μL of samples (approximately
20-30 μg) were loaded to 4-12% sodium dodecyl sulfate-
polyacrylamide gel electrophoresis (SDS-PAGE, Invitro-
gen). The iblot (Invitrogen) was used for transforming the
proteins to polyvinylidene fluoride (PVDF). After using
0.5% milk to blot the PVDF for 30 min, the A2M, ApoAI
and VDBP were detected by rabbit anti-A2M antibody
(AbD serotec), chicken anti-ApoAI antibody (CHEMI-
CON) and rabbit anti-VDBP antibody (AbD serotec) for
two hour at room temperature. After washing three times
in PBS buffer (10 mM sodium phosphate, pH7.4 and 0.9%
sodium chloride), the second antibody conjugated with
horseradish peroxidase was added to incubate for one
hour. The ECL detection system (Millipore) was used and
the images were acquired by Imaging System (Gel Doc
XR System, Bio-Rad) depending on the moderate explor-
ing time.
Bio-plex suspension array system
Bio-Plex 200 Suspension Array System (Bio-Rad) was
based on flexible multi-analyte profiling (xMAP) tech-
nique developed by Luminex Corporation using the prin-
ciple of sandwich immunoassay. Individual serum sample
was diluted 100 thousands fold with Bio-Plex human
serum diluent. For A2M measurement, Bio-Plex Pro
Human Acute Phase 4-Plex Panel (cat. 171-A4009M, Bio-
Rad) was performed. For ApoAI and VDBP measure-
ment, there are many processes need to complete, includ-
ing antibody labeled with microsphere and biotin
individually. These experiments were completed by fol-
lowing the manual of Amine Coupling Kit (Bio-Rad) and
Lynx Rapid Biotin Antibody Conjugation Kit (AbD Sero-
tec) respectively. After pre-wet of 96-well plate, each 50
μL of diluted sample was incubated with 1.25 × 10
6
microspheres, which labeled with primary antibody, at
300 rpm for exactly 1 hour. Subsequently each 50 μL of
biotin-conjugated secondary antibody (2 μg/mL) was
added to incubate at 300 rpm for 30 min. Finally 50 μL of
streptavidin-Phycoerythrin was added to each well and
mixed at 300 rpm for 10 min. After drying up and wash-
ing, 125 μL of assay buffer was allowed to suspend each
well of microspheres. The protein concentration was
measured by Bio-Plex 200 Suspension Array System.
SPSS software (Ver.14.0; SPSS Inc.) was used to calculate
the p value and to present the curve of expressional trend
with Box-and-Whisker Plot.
Results
The serum samples labeled with cy2, cy3 or cy5 individu-
ally are presented in Table 1. From F0 to F4 fibrotic
stages, we selected three samples of each stage to do 2D-
DIGE experiments. For this purpose, 15 samples needed
to separate into eight gels, in which F0-1 was used in gel 1
and gel 8 for fitting the arranging design. This design
would not influence the data calculation. In this study we
did not use albumin/IgG removal kit to remove high
abundant albumin and IgG because we wanted to sim-
plify the experimental process. Moreover removing albu-
min protein would remove albumin-binding proteins in
the same time and influence the reproducibility.
After the protein matching and statistics calculation
with DeCyder 6.5 software, there were three putative pro-
teins selected (p ≤ 0.05). These protein locations in 2D-
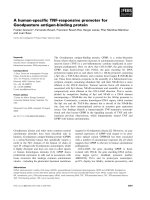
PAGE gel are shown in Fig. 1. The three putative proteins
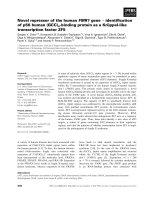
Figure 1 Three novel biomarkers of liver fibrosis, A2M, VDBP and
ApoAI, appear on the location of 162 kDa, 52 kDa and 28 kDa in
the 2D-DIGE gels. Observably there are several adjacent spots near
A2M, VDBP and ApoAI protein; the adjacent spots were identified as
same as A2M, VDBP or ApoAI respectively.
Ho et al. Journal of Biomedical Science 2010, 17:58
/>Page 4 of 7
were found out that they all appeared in eight gels (Fig.
2A, Fig. 2B and Fig. 2C). The three proteins were excised
from gels, digested with trypsin, and identified by the
cooperation of MALDI-TOF/TOF with MASCOT soft-
ware (link to NCBI database, http://
www.ncbi.nlm.nih.gov/). Alpha 2 macroglobulin (A2M) is
up regulated whereas vitamin D binding protein (VDBP)
and apolipoprotein AI (ApoAI) are down regulated in
hepatic fibrosis serum (Fig. 2D, Fig. 2E and Fig. 2F; Table
2). Meanwhile, we noticed that A2M protein had a series
of adjacent spots appeared in 2D-PAGE; besides, VDBP
and ApoAI had two and one adjacent spots respectively
(Fig. 1). Those different spots were identified as the same
results as A2M, VDBP or ApoAI respectively.
Although 2D-DIGE analyses already demonstrated that
the protein levels and expressional trends for each candi-
date biomarkers were apparently distinct in fibrotic
stages, using antibody to verify the result was important.
We selected two samples of each fibrotic stage to analyze
the protein expressions by using western blotting for veri-
fying the protein identification. A2M was detected having
higher protein expression in F1-F4 stage than in F0 stage
(Fig. 3A). Moreover, VDBP and ApoAI were down regu-
lated (Fig. 3A). Particularly the protein expression of
VDBP from mild fibrosis (F0/F1) to advanced fibrosis
(F2-F4) was decreased (Fig. 3A and Fig. 3C). The protein
expression of ApoAI was changeable only in F3/F4 com-
pared with that in F0-F2 stage (Fig. 3A and Fig. 3D).
We used Bio-Plex Suspension Array System to measure
the absolute protein concentration of A2M, VDBP and
ApoAI according to protein standard curve. We found
that the serum concentration of A2M from F0 to F4 was
increased significantly (F0: 4.3 ± 2.8, F1/F2: 7.2 ± 4.3, F3/
F4: 13.0 ± 6.8 mg/mL, p < 0.01) (Fig. 3B). The correlation
coefficient of A2M was 0.98. The result suggests that
A2M protein could distinguish the stages among normal
(F0), mild (F1/F2) and advanced fibrosis (F3/F4). The
serum concentration of VDBP was decreased from F0/F1
to F2-F4 stage (F0/F1: 1.2 ± 0.3 mg/mL, F2-F4: 0.6 ± 0.2
mg/mL, p < 0.01) (Fig. 3C). The result indicates that
VDBP protein could differentiate F0/F1 from F2-F4 stage.
The protein concentration of ApoAI was decreased in F3/
F4 stage (F0-F2: 2.0 ± 0.7 mg/mL, F3/F4: 1.1 ± 0.5 mg/
mL, p < 0.01) (Fig. 3D). This result implies that ApoAI
could be a biomarker to differentiate normal/mild (F0-
F2) from advanced fibrosis (F3/F4).
Discussion
Searching for novel serological biomarkers of HCV-
infected fibrosis is to avoid the use of invasive liver
biopsy. Developing an efficient and noninvasive method
for liver fibrosis is important for prognosis and treatment
plan in patients with chronic hepatitis C virus. A nonin-
vasive diagnosis of liver fibrosis could also enhance the
development of antifibrotic therapies. There are several
non-invasive methods to assess liver fibrosis in patients
with chronic hepatitis C, including FibroScan (FS) [8,9],
Fibrotest (FT) [10]. However, FS could not assess liver
fibrosis properly when patients were overweight or mor-
bid obese; besides, stiffness measurement is hard to
acquire in ascitic patients [8]. Ziol M et al. [11] indicated
that FS appeared as a reliable tool to detect significant
fibrosis or cirrhosis rather than early liver fibrosis. Cast-
Table 2: Protein spots identified by MALDI/TOF-TOF-MS
Protein
§
GenBank coverage ratio regulation
p value
¶
A2M gi:224053 29% 0.015
VDBP gi:18655424 38% 0.020
ApoAI gi:90109664 49% 0.027
§
A2M, alpha 2 macroglobulin; VDBP, vitamin D binding protein; ApoAI, apolipoprotien AI.
¶
The p value was calculated by one way ANOVA with
DeCyder 6.5 software. #, present in normal and each fibrotic stage but the protein expression in fibrotic stages (F1-F4) is higher than that in
normal control (F0); ∃, present in normal and each fibrotic stage but the protein expression in moderate/advanced fibrotic stages (F3/F4) is
lower than that in normal control/mild fibrotic stage (F0/F1).
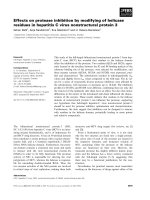
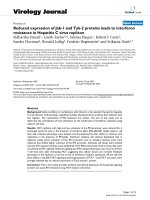
Figure 2 The protein expressions of A2M (A), VDBP (B) and ApoAI
(C) are presented in eight gels. The expressional trends of A2M (D),
VDBP (E) and ApoAI (F) were calculated with DeCyder 6.5 software.
A2M is an up-regulated protein; VDBP and ApoAI are down-regulated
proteins with hepatic fibrosis development.
Ho et al. Journal of Biomedical Science 2010, 17:58
/>Page 5 of 7
era L et al. [12] suggested that the combined use of FS and
FT to assess liver fibrosis could avoid liver biopsy in most
patients with chronic hepatitis C. In our study, although
two of the three identified biomarkers, A2M and ApoAI,
are the same as that in FT, ApoAI is decreased signifi-
cantly only in advanced fibrosis (F3/F4). This result sug-
gests ApoAI could only be an indictor for advanced
fibrosis or cirrhosis. In addition, this is the first report
that VDBP could be a biomarker of liver fibrosis in
patients with chronic hepatitis C.
A2M is a well-known biomarker of hepatic fibrosis [13]
and a significant component of measuring liver fibrosis in
FibroTest, FIBROSpect II, Fibrometer or Hepascore
[10,14-16]. A2M is able to inactivate an enormous variety
of proteinases and inhibit fibrinolysis by reducing plas-
min and kallikrein. In inflammatory or injured liver, the
increase of A2M inhibit catabolism of matrix proteins
and thus cause liver fibrosis [17-20]. Gangadharan B et al.
indicated that thioester cleavage of A2M may increase
gradually with the development of fibrosis [21]. In our
study, we consistently confirmed that serum concentra-
tion of A2M may be an indicator to predict liver fibrosis.
However, serum A2M level is increased in patients with
depression or nephrotic syndrome [22,23]. Therefore,
while using A2M as liver fibrosis biomarker, other bio-
markers are needed to decrease the interference of other
diseases such as nephrotic syndrome or depression.
VDBP is also known as Gc-globulin (group-specific
component globulin) which binds and transports vitamin
D metabolites [24,25]. The significant function of VDBP
is involved in actin scavenger system, thus to protect the
organism from the toxic effect of intravascular actin
polymerization [26]. Moreover, VDBP can also be con-
verted into a macrophage-activator factor, and actin-free
VDBP is associated with organ dysfunction in acute liver
failure [27,28]. However, this is the first study to validate
that the level of VDBP is negatively associated with the
development of liver fibrosis. ApoAI, applied also in
FibroTest and Fibrometer test [29,30], was a putative bio-
marker of HCV-infected fibrosis which was also verified
to be a protein with down regulation in liver hepatic
fibrosis in this study. Moreover, we found that the level of
ApoAI was changeable between F0-F2 and F3/F4 stage.
Our result demonstrates that ApoAI is a candidate bio-
marker of advanced fibrosis (F3/F4).
2D-DIGE technologies, a useful tool in proteomics
analysis recently, were used to search for reliable bio-
marker of liver fibrosis in our study. Cy2-labeled internal
standard can correct the analytical error among gels so
that more than two samples can be analyzed. Further-
more, the samples, which were labeled with high sensitive
CyDye, could pour together in one gel. Thus, thousands
of serum proteins could be easily analyzed and identified
as reliable biomarkers [31,32]. In addition, there were
several advantages for 2D-DIGE technique such as reduc-
ing variation among gels and increasing the reproducibil-
ity of proteins [33]. The sensitivity of CyDye flours (<0.05
ng) was better than silver staining or coomassine blue
staining [34,35]. Therefore 2D-DIGE was more powerful
than traditional two-dimension electrophoresis (2DE) in
biomarker discovery. However, it still had some limita-
tions in detecting the hydrophobic proteins, proteins big-
ger than 200 kDa, or those smaller than 10 kDa. Many
proteins of extreme acidity or basicity were also not pre-
sented in the gels [36]. Moreover, because CyDye flours
needed to conjugate with lysine residue of proteins, the
high abundant proteins with few or no lysine residues
were difficult to be detected.
The mean in distinct stages was used as cut-off value to
define the severity of liver fibrosis (A2M: <4.3 mg/mL,
score 0; 4.3-7.2 mg/ml, score 1; 7.2-13.0 mg/ml, score 2;
>13.0 mg/ml, score 3; VDBP: >1.2 mg/mL, score 0; 0.6-1.2
mg/ml, score 1; <0.6 mg/ml, score 2; ApoAI: >2.0 mg/mL,
score 0; 1.1-2.0 mg/ml, score 1; <1.1 mg/ml, score 2, Table
3). In this algorithm, the combining score of three bio-
markers from 0 to 3 represent normal (F0/F1); score from
4 to 7 represent liver fibrosis (F2-F4). The sensitivity and
specificity are 75% and 79% respectively. Furthermore,
the stages of liver fibrosis from F1 to F4 could be pre-
dicted accurately (the median of combining score: F0 = 2,
F1 = 2.5, F2 = 4, F3 = 4.5, F4 = 6). As we know, the main
problem of available serologic tests to predict the stage of
liver fibrosis is the tiny difference between F1 and F2; F2
and F3. The addition of these biomarkers especially
VDBP and ApoAI in the algorithm could be helpful to
separate these two stages of liver fibrosis. Whether com-
bining other known biomarkers of liver fibrosis such as
tissue inhibitor of metalloproteinases-1 (TIMP-1),
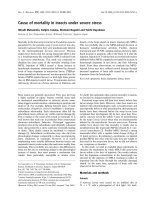
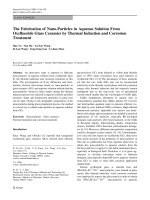
Figure 3 Verification of A2M, VDBP and ApoAI by western blot-
ting (A) and quantification of A2M (B), VDBP (C) and ApoAI (D) by
Bio-Plex Suspension Array System. A2M is increased in the F1-F4
stages; VDBP is decreased in the F2-F4 stage and ApoAI is decreased in
the F3/F4 stages. **p < 0.01.
Ho et al. Journal of Biomedical Science 2010, 17:58
/>Page 6 of 7
hyaluronic acid (HA), N-terminal propeptide of type III
procollagen (PIIINP) or YKL-40 [30,37,38] may increase
the sensitivity and specificity of this algorithm needs fur-
ther studies to confirm.
In summary, this study not only reveals three putative
biomarkers of liver fibrosis (A2M, VDBP and ApoAI) but
also proves the differential expressions in different stages
of fibrosis. Furthermore, we discovered a novel bio-
marker, VDBP, which is decreased in liver fibrosis (F2-
F4). In addition, the algorithm combining three biomark-
ers could be used clinically to predict the stage of liver
fibrosis and to reduce the use of liver biopsy.
Competing interests
The authors declare that they have no competing interests.
Authors' contributions
ASH assisted with diagnosis for patients and collection of fibrotic serum sam-
ples; CCC assisted with article writing, protein identification from the gel spots
and western blotting experiment; MLL and JYL assisted with preparation for
the serum samples and judgment for fibrotic stages; SCL and WMW were pro-
jective leaders and assisted with experimental design; CCW assisted with arti-
cle revising. All authors read and approved the final manuscript.
Acknowledgements
This project was supported by the grant NSC96-3111-P-042A-004-Y from
National Science Council of Republic of China and the founding of Cheng Hsin
Rehabilitation Medical Center.
Author Details
1
Division of Gastroenterology, Cheng Hsin General Hospital, Taipei, Taiwan,
2
Graduate Institute of Medical Sciences, College of Medicine, Taipei Medical
University, Taipei, Taiwan,
3
Institute of Nuclear Energy Research, Atomic Energy
Council, Taoyuan, Taiwan,
4
Division of Internal Medicine, Kaohsiung Municipal
Hsiao-Kang Hospital, Kaohsiung Medical University, Kaohsiung, Taiwan,
5
Division of Gastroenterology, Department of Internal Medicine, Kaohsiung
Medical University Hospital, Kaohsiung, Taiwan,
6
Department of Medicine,
Faculty of Medicine, College of Medicine, Kaohsiung Medical University,
Kaohsiung, Taiwan and
7
Division of Gastroenterology, Buddhist Tzu Chi
General Hospital, Taipei branch, Taiwan
References
1. Marcellin P: Hepatitis C: the clinical spectrum of the disease. J Hepatol
1999, 31(Suppl 1):9-16.
2. Afdhal NH, Nunes D: Evaluation of liver fibrosis: a concise review. Am J
Gastroenterol 2004, 99:1160-1174.
3. Thampanitchawong P, Piratvisuth T: Liver biopsy:complications and risk
factors. World J Gastroenterol 1999, 5:301-304.
4. Regev A, Berho M, Jeffers LJ, Milikowski C, Molina EG, Pyrsopoulos NT,
Feng ZZ, Reddy KR, Schiff ER: Sampling error and intraobserver variation
in liver biopsy in patients with chronic HCV infection. Am J
Gastroenterol 2002, 97:2614-2618.
5. Poynard T, Ratziu V, Bedossa P: Appropriateness of liver biopsy. Can J
Gastroenterol 2000, 14:543-548.
6. Unlu M, Morgan ME, Minden JS: Difference gel electrophoresis: a single
gel method for detecting changes in protein extracts. Electrophoresis
1997, 18:2071-2077.
7. Bedossa P, Poynard T: An algorithm for the grading of activity in chronic
hepatitis C. The METAVIR Cooperative Study Group. Hepatology 1996,
24:289-293.
8. Sandrin L, Fourquet B, Hasquenoph JM, Yon S, Fournier C, Mal F, Christidis
C, Ziol M, Poulet B, Kazemi F, Beaugrand M, Palau R: Transient
elastography: a new noninvasive method for assessment of hepatic
fibrosis. Ultrasound Med Biol 2003, 29:1705-1713.
9. Saito H, Tada S, Nakamoto N, Kitamura K, Horikawa H, Kurita S, Saito Y, Iwai
H, Ishii H: Efficacy of non-invasive elastometry on staging of hepatic
fibrosis. Hepatol Res 2004, 29:97-103.
10. Imbert-Bismut F, Ratziu V, Pieroni L, Charlotte F, Benhamou Y, Poynard T:
Biochemical markers of liver fibrosis in patients with hepatitis C virus
infection: a prospective study. Lancet 2001, 357:1069-1075.
11. Ziol M, Handra-Luca A, Kettaneh A, Christidis C, Mal F, Kazemi F, de
Lédinghen V, Marcellin P, Dhumeaux D, Trinchet JC, Beaugrand M:
Noninvasive assessment of liver fibrosis by measurement of stiffness in
patients with chronic hepatitis C. Hepatology 2005, 41:48-54.
12. Castéra L, Vergniol J, Foucher J, Le Bail B, Chanteloup E, Haaser M, Darriet
M, Couzigou P, De Lédinghen V: Prospective comparison of transient
elastography, Fibrotest, APRI, and liver biopsy for the assessment of
fibrosis in chronic hepatitis C. Gastroenterology 2005, 128:343-350.
13. Naveau S, Poynard T, Benattar C, Bedossa P, Chaput JC: Alpha-2-
macroglobulin and hepatic fibrosis. Diagnostic interest. Dig Dis Sci
1994, 39:2426-2432.
14. Patel K, Gordon SC, Jacobson I, Hézode C, Oh E, Smith KM, Pawlotsky JM,
McHutchison JG: Evaluation of a panel of non-invasive serum markers
to differentiate mild from moderate-to-advanced liver fibrosis in
chronic hepatitis C patients. J Hepatol 2004, 41:935-942.
15. Calès P, Oberti F, Michalak S, Hubert-Fouchard I, Rousselet MC, Konaté A,
Gallois Y, Ternisien C, Chevailler A, Lunel F: A novel panel of blood
markers to assess the degree of liver fibrosis. Hepatology 2005,
42:1373-1381.
16. Adams LA, Bulsara M, Rossi E, DeBoer B, Speers D, George J, Kench J, Farrell
G, McCaughan GW, Jeffrey GP: Hepascore: an accurate validated
predictor of liver fibrosis in chronic hepatitis C infection. Clin Chem
2005, 51:1867-1873.
17. Tiggelman AM, Boers W, Moorman AF, de Boer PA, Van der Loos CM,
Rotmans JP, Chamuleau RA: Localization of alpha 2-macroglobulin
protein and messenger RNA in rat liver fibrosis: evidence for the
synthesis of alpha 2-macroglobulin within Schistosoma mansoni egg
granulomas. Hepatology 1996, 23:1260-1267.
Received: 24 August 2009 Accepted: 15 July 2010
Published: 15 July 2010
This article is available from: 2010 Ho et al; licensee BioMed Central Ltd. This is an Open Access article distributed under the terms of the Creative Commons Attribution License ( ), which permits unrestricted use, distribution, and reproduction in any medium, provided the original work is properly cited.Journal of Biomedical Science 2010, 17:58
Table 3: Cut-off value of A2M, VDBP and ApoAI to predict liver fibrosis
§
A2M <4.3 4.3-7.2 7.2-13.0 >13.0
Score0123
VDBP >1.2 0.6-1.2 <0.6
Score012
ApoAI >2.0 1.1-2.0 <1.1
Score012
§
The measuring unit is mg/mL. In this algorithm of three biomarkers, combining score from 0 to 3 present normal (F0/F1); score from 4 to 7
present liver fibrosis (F2-F4). A2M, alpha 2 macroglobulin; VDBP, vitamin D binding protein; ApoAI, apolipoprotien AI.
Ho et al. Journal of Biomedical Science 2010, 17:58
/>Page 7 of 7
18. Tiggelman AM, Linthorst C, Boers W, Brand HS, Chamuleau RA:
Transforming growth factor-beta-induced collagen synthesis by
human liver myofibroblasts is inhibited by alpha2-macroglobulin. J
Hepatol 1997, 26:1220-1228.
19. Meisse D, Renouf S, Husson A, Lavoinne A: Cell swelling increased the
alpha2-macroglobulin gene expression in cultured rat hepatocytes.
FEBS Lett 1998, 422:346-348.
20. Kawser CA, Iredale JP, Winwood PJ, Arthur MJ: Rat hepatic stellate cell
expression of alpha2-macroglobulin is a feature of cellular activation:
implications for matrix remodelling in hepatic fibrosis. Clin Sci (Lond)
1998, 95:179-186.
21. Gangadharan B, Antrobus R, Dwek RA, Zitzmann N: Novel serum
biomarker candidates for liver fibrosis in hepatitis C patients. Clin
Chem 2007, 53:1792-1799.
22. Rothermundt M, Arolt V, Peters M, Gutbrodt H, Fenker J, Kersting A,
Kirchner H: Inflammatory markers in major depression and
melancholia. J Affect Disord 2001, 63:93-102.
23. Tsiouris JA, Mehta PD, Patti PJ, Madrid RE, Raguthu S, Barshatzky MR,
Cohen IL, Sersen E: Alpha2 macroglobulin elevation without an acute
phase response in depressed adults with Down's syndrome:
implications. J Intellect Disabil Res 2000, 44(Pt 6):644-653.
24. Daiger SP, Schanfield MS, Cavalli-Sforza LL: Group-specific component
(Gc) proteins bind vitamin D and 25-hydroxyvitamin D. Proc Natl Acad
Sci USA 1975, 72:2076-2080.
25. Bouillon R, Auwerx J, Dekeyser L, Fevery J, Lissens W, De Moor P: Serum
vitamin D metabolites and their binding protein in patients with liver
cirrhosis. J Clin Endocrinol Metab 1984, 59:86-89.
26. Lee WM, Galbraith RM: The extracellular actin-scavenger system and
actin toxicity. N Engl J Med 1992, 326:1335-1341.
27. Schiodt FV, Bangert K, Shakil AO, McCashland T, Murray N, Hay JE, Lee WM:
Predictive value of actin-free Gc-globulin in acute liver failure. Liver
Transpl 2007, 13:1324-1329.
28. Antoniades CG, Berry PA, Bruce M, Cross TJ, Portal AJ, Hussain MJ, Bernal
W, Wendon JA, Vergani D: Actin-free Gc globulin: a rapidly assessed
biomarker of organ dysfunction in acute liver failure and cirrhosis.
Liver Transpl 2007, 13:1254-1261.
29. Myers RP, Ratziu V, Imbert-Bismut F, Charlotte F, Poynard T: Biochemical
markers of liver fibrosis: a comparison with historical features in
patients with chronic hepatitis C. Am J Gastroenterol 2002,
97:2419-2425.
30. Poynard T, Imbert-Bismut F, Ratziu V, Chevret S, Jardel C, Moussalli J,
Messous D, Degos F: GERMED cyt04 group. Biochemical markers of liver
fibrosis in patients infected by hepatitis C virus: longitudinal validation
in a randomized trial. J Viral Hepat 2002, 9:128-133.
31. Tonge R, Shaw J, Middleton B, Rowlinson R, Rayner S, Young J, Pognan F,
Hawkins E, Currie I, Davison M: Validation and development of
fluorescence two-dimensional differential gel electrophoresis
proteomics technology. Proteomics 2001, 1:377-396.
32. Orenes-Pinero E, Corton M, Gonzalez-Peramato P, Algaba F, Casal I,
Serrano A, Sanchez-Carbayo M: Searching urinary tumor markers for
bladder cancer using a two-dimensional differential gel
electrophoresis (2D-DIGE) approach. J Proteome Res 2007, 6:4440-4448.
33. Van den Bergh G, Clerens S, Cnops L, Vandesande F, Arckens L:
Fluorescent two-dimensional difference gel electrophoresis and mass
spectrometry identify age-related protein expression differences for
the primary visual cortex of kitten and adult cat. J Neurochem 2003,
85:193-205.
34. Zhou G, Li H, DeCamp D, Chen S, Shu H, Gong Y, Flaig M, Gillespie JW, Hu
N, Taylor PR, Emmert-Buck MR, Liotta LA, Petricoin EF, Zhao Y: 2D
differential in-gel electrophoresis for the identification of esophageal
scans cell cancer-specific protein markers. Mol Cell Proteomics 2002,
1:117-124.
35. Gharbi S, Gaffney P, Yang A, Zvelebil MJ, Cramer R, Waterfield MD, Timms
JF: Evaluation of two-dimensional differential gel electrophoresis for
proteomic expression analysis of a model breast cancer cell system.
Mol Cell Proteomics 2002, 1:91-98.
36. Van den Bergh G, Clerens S, Vandesande F, Arckens L: Reversed-phase
high-performance liquid chromatography prefractionation prior to
two-dimensional difference gel electrophoresis and mass
spectrometry identifies new differentially expressed proteins between
striate cortex of kitten and adult cat. Electrophoresis 2003, 24:1471-1481.
37. Bataller R, Brenner DA: Liver fibrosis. J Clin Invest 2005, 115:209-218.
38. Johansen JS, Christoffersen P, Moller S, Price PA, Henriksen JH, Garbarsch
C, Bendtsen F: Serum YKL-40 is increased in patients with hepatic
fibrosis. J Hepatol 2000, 32:911-920.
doi: 10.1186/1423-0127-17-58
Cite this article as: Ho et al., Novel biomarkers predict liver fibrosis in hepati-
tis C patients: alpha 2 macroglobulin, vitamin D binding protein and apolipo-
protein AI Journal of Biomedical Science 2010, 17:58