Differential behaviour of normal, transformed and Fanconi’s anemia lymphoblastoid cells to modeled microgravity ppt
Bạn đang xem bản rút gọn của tài liệu. Xem và tải ngay bản đầy đủ của tài liệu tại đây (599.06 KB, 10 trang )
RESEARC H Open Access
Differential behaviour of normal, transformed and
Fanconi’s anemia lymphoblastoid cells to
modeled microgravity
Paola Cuccarolo
1,2†
, Francesca Barbieri
1,4†
, Monica Sancandi
1
, Silvia Viaggi
2,3
, Paolo Degan
1*
Abstract
Background: Whether microgravity might influence tumour growth and carcinogenesis is still an open issue. It is
not clear also if and how normal and transformed cells are differently solicited by microgravity. The present study
was designed to verify this issue.
Methods: Two normal, LB and HSC93, and two transformed, Jurkat and 1310, lymphoblast cell lines were used as
representative for the two conditions. Two lymphoblast lines from Fanconi’s anemia patients group A and C (FA-A
and FA-C, respectively), along with their isogenic corrected counterparts (FA-A-cor and FA-C-cor) were also used.
Cell lines were evaluated for their proliferative ability, vitality and apoptotic susceptibility upon microgravity
exposure in comparison with unexposed cells. Different parameters correlated to energy metabolism, glucose
consumption, mitochondrial membrane potential (MMP), intracellular ATP content, red-ox balance and ability of the
cells to repair the DNA damage product 8-OHdG induced by the treatment of the cells with 20 mM KBrO
3
were
also evaluated.
Results: Transformed Jurkat and 1310 cells appear resistant to the microgravitational challenge. On the contrary
normal LB and HSC93 cells display increased apoptotic susceptibility, shortage of energy storages and reduced
ability to cope with oxidative stress. FA-A and FA-C cells appear resistant to microgravity exposure, analogously to
transformed cells. FA corrected cells did shown intermediate sen sitivity to microgravity exposure suggesting that
genetic correction does not completely reverts cellular phenotype.
Conclusions: In the light of the reported results microgravity should be regarded as an harmful condition either
when considering normal as well as transformed cells. Modeled microgravity and space-based technology are
interesting tools in the biomedicine laboratory and offer an original, useful and unique approach in the study of
cellular biochemistry and in the regulation of metabolic pathways.
Background
We previously reported [1] that the exposure of normal
lymphocytes and lymphoblast cells (LB and HSC93) to
modeled microgravity i s a stressful process. Upon this
condition cells experience proliferative inhibition, deple-
tion in intracellular ATP, enhanced susceptibility to
treatment with damaging agents and defects in apoptosis
and in DNA repair. This condition may thus increase
proneness of the cells to malignant transformation.
The senescence-like phenotype [2] in which cells
thrive in a state of apparent idleness [3] observed in
cells exposed to modeled and real microgravity, is
however hiding important changes in the expression of
multiple genes. Microgravity has selective effects on
cell viability and proliferation [4], on gene transcrip-
tion, in the stability of the transcripts [5] and in the
modulation of the im mune response [5,6]. Several stu-
dies employed microarray technologies to characterize
the gene expression of lymphocytes exposed to mod-
eled and real microgravity [7,8]. The results reports an
altered gene expression in pathways deputed to defense
against oxidative stress, immune response, control of
apoptosis, cell cycle and tumor suppression. Changes
* Correspondence:
† Contributed equally
1
Department of Epidemiology, Prevention and Special Functions, National
Institute for Cancer Research (IST), Genova, Italy
Cuccarolo et al. Journal of Biomedical Science 2010, 17:63
/>© 2010 Cuccarolo et al; licensee BioMed Central Ltd. This is an Open Access article distributed under the terms of the Creative
Commons Attribution License ( icenses/by/2.0), which permits unrestricted use, dist ribution, and
reproduction in any medium, provided the original work is properly cited.
in DNA damage susceptibility [9], differentiation,
membrane and surface morphology or cytoskeletal
architecture [10] were also reported in lymphocytes,
promyelocytes and macrophages. Jurkat T-cells flown
on STS95 used for gene expression screening [11] also
documented an altered expression of the genes that
regulate cell growth, metabolism, signal transduction,
adhesion, transcription, apopto sis, and tumor suppres-
sion. Melanoma cells exposed to s imulated micrograv-
ity displayed an altered growth and an increased in the
melanine production [12]. Subcutaneous inoculation of
these cells in C57BL/6 mices, their syngenic hosts,
resulted in efficient tumor induction. This enhanced
melanine production suggests that microgravity may
affect tumor growth and may drive the selection of a
highly tumorigenic cell clone showing increased inva-
sive properties.
The question whether exposure to microgravity might
influence tumour growth and carcinogenesis is still an
open issue notwithstanding the number of publications
devoted to this subject. It is not clear yet if and how
normal and transformed cells are differently solicited by
microgravity. The study presented here was conse-
quently desig ned to verify how normal and transfor med
cell lines respond to exposure to modeled microgravity.
We th erefore used two normal, LB and HSC93, and two
transformed, Jurkat an d 1310, lym phoblast cell lines as
representative of these two conditions.
Four more cell lines were also employed. FA-A and
FA-C cells are two lymphoblast lines established from
two Fanconi’ s anemia (FA) patients. The cells belong,
respectively, to complementation groups A and C. The
other two lines, FA-A-cor and FA-C -cor are the iso-
genic corrected correspondent of FA-A and FA-C. FA is
a genetic disease a ssociated with a severe pathological
condition in the child. The disease is inherited as an
autosomic recessive character and its poor prognosis is
often related to pancytopenia, bone marrow failure and
increased risk to malignancies [13]. While a complete
review of the pathophysiological characteristics of the
disease are beyond the goals of this paper (for review
please refer [14-17]) and while the ultimate biochemical
defe cts underlying FA are not yet complet ely character-
ized and the definition of the FA c ondition still defy
complete understanding, our purpose was to employ FA
cells as a well established model for a cancer prone dis-
ease [18]. Abrogation of the FA pathway and mutations
in any of the FA genes results in complex changes in
cellular phenotype, biochemistry and metabolism. Such
complexity suggests a hierarchically elevated position
for this pathway. We wer e there fore intere sted to study
the behavior of FA cell lines toward microgravity
exposure.
Methods
Cell lines, Proliferation and Apoptosis
Lymphoblast cell lines LB and HSC93 are normal B and
T, respectively, human lymphocytes immortalised with
EBV. Jurkat and 1310 a re established n aturally trans-
formed T-lymphocytes cell lines. FA-A (EUFA-471-L)
and FA-C (HSC 536) are lymphoblast cells derived b y
two FA patients. FA-A cells belongs to complementation
group A, and FA-C cells to group C. FA-A- cor and FA-
C-cor a re spontaneous in vitro revertant from cell lines
FA-A and FA-C, respectively [19]. Cell lines are main-
tained in culture in RPMI 1640 medium supplemented
with 10% FCS, 25 mM Hepes and 2 mM L-Glutamine
at 37°C at 5% CO
2
. In the various experiment reported
here below cells were grown, treated and analysed under
identical conditions except for the absence or presence
of microgravity. Cell growth was monitored with a BrdU
detection kit (Millipore, MA, USA) and proliferation
was calculated after quantification of the respective dou-
bling time for each cell line. Cell viability was deter-
mined by the trypan blue dye exclusion te st. Cell cycle
analysis and sub-G1 cell fraction were calculated after
FACScan (Beckton Dickinson) analysis. Cells were
stained with propidium iodide and 20.000 events were
collected from each sample before ModFit analysis.
Microgravity exposure and cell treatments
Microgravity was accomplished by a random position
machine (RPM) machine (Dutch Space, Leiden, NL)
located in a temperature controlled room. The RPM [20]
is a laboratory instrument designed to randomly change
the position of an accommodated biological experiment
in 3-dimensi onal space. The lay-out of the RPM consist s
of two cardanic frames and one experiment platform
(Additional file 1). The frames and the platform are dri-
ven by means of belts and two electro-motors.
The RPM is computer managed an d a d edicated soft-
ware permits the settings for modeled microgravity at the
value of choice. Rotation rate ω and geometri cal distance
from the centre of rotation (R) yield ‘g-contours’, through
g
i
= ω2R/g
0
(g
0
= 9.81 m/s2), that provide guidelines for
the design and lay-out of experiment packages and for
the interpretation of the experimental results [20]. Rou-
tinary conditions employed in our experiments sets g
below 0.005 m/s
2
. In the conditions employed in the
experiments reported below cells were exposed continu-
ously in the RPM for 24 hours. Eventual exposure to
KBrO
3
(20 mM, 30 min., 37°C, in complete medium) was
performed at the end of the exposure schedule.
Glucose, PARP, ATP, TBARS and protein quantification
The concentration of glucose present in the cell med-
ium was measured with a commercial assay kit
Cuccarolo et al. Journal of Biomedical Science 2010, 17:63
/>Page 2 of 10
(BioVision Glucose assay kit, BioVision, Mountain View,
California, USA). Glucose content per cell (mg/ml/cell)
was measured in aliquots taken from the culture med-
ium during the different phases of the experiments.
PARP activity (pmol/min μg DNA) was determined by
quantification of labelled ADP-ribose resulting after
(
32
P)NAD (5 μCi/nmol) incorporation into acid insolu-
ble material [21] . In the assay kit employed intracellular
ATP (Sigma Chem. Co., St Loius, LO, USA) is measured
after the concomitant conversion of ATP to ADP
through NADH oxidation to NAD. This reaction is fol-
lowed by the decrease in the absorbance at 340 nM
which is proportional to the amount of the ATP trans-
formed to ADP (μmol/10
6
cells). A measure of a general
oxidative stress was per formed by q uantification of lipid
peroxides as thiobarbituric acid reactive substances
(TBARS)incellextractsbymeanofanassaykitwhich
employs the formation of the spectrophotometrically
quantifiable MDA-TBA complex (Cayman Chem. Co.,
Ann Arbor, MI, USA). Quantification of the protein
content in cell extracts was performed according to the
BCA assay kit (Pierce Chem . Co., Indianapolis, IN,
USA).
Mitochondrial Membrane Potential (MMP)
The lipophilic cati on 5,5’,6,6’tetrachloro-1,1’ ,3,3’ -tetra-
ethylbenzimidazol- carbocyanine iodide (JC-1; Sigma
Chem. Co, St Louis, LO, USA) was used to detect varia-
tions in mitochondrial membrane potential (MMP) [22].
When this dye is taken inside mitochondr ia its mem-
brane potential is measured by quantifying light emis-
sion in the range 500-652 nm since JC-1 fluorescence
changes reversibly from green to orange as membrane
potentials increases. Aliquots of cell suspension are
incubated 10 min. at room temperature in complete cul-
ture medium in presence of the dye (10 μg/ml) in dark.
Following cell wash in PBS fluorescence e mission was
measured with FACS as reported above.
Quantification of DNA repair by 8-OHdG removal
8-OHdG content was quantified in DNA extracted
from microgravity exposed and untreated cells [23].
Purified DNA was digested to nucleosides by Nuclease
P1 and Alkaline Phosphatase. Aliquots of the nucleo-
sides mix ar e injected in a C-18 HPLC (Beckman Sys-
tem Gold, Beckman Coulter,Inc,Fullerton,CA,USA)
column (Supelco, Bellafonte, PA, USA) flown isocrati-
cally (5% MeOH, 95% 50 mM Potassium Phosphate,
pH 5,2). The analytical column (15 × 0.46 cm) is
coupled with a guard C-18-DB cartridge (Supelco). 8-
OHdGinthesampleisquantifiedbyelectrochemical
detection after elution through an ESA 5011A analyti-
cal cell (ESA, Chelmsford, MA, USA). Unmodified
nucleosides are quantified after UV elution through a
diode array detector (Beckman Coulter Inc., Fullerton,
CA, USA). Sample analysis is accomplished by the
Karat software (Beckman). The time course removal of
8-OHdG of cells exposed to microgravity or in unex-
posed controls is followed after treatment with 10 mM
KBrO
3
.
Statistical analysis
Data were analysed by one-way ANOVA an d unpaired
two-tail Student’ s t-test using InStat software. Data are
from at least three independent experiments. Standard
deviat ion of the mean (± SD) are reported in the figures
as error bars.
Results
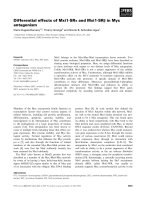
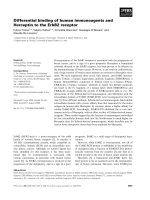
Cell growth, Proliferation and apoptosis
Figur e 1 reports values for various vitality parameters of
the cell lines employed in the study. For an easier visua-
lization the values reported are percentages with refer-
ence of the value for LB cells in standard conditions.
Data are displayed on two separate panels: LB, HSC93,
Jurkat and 1310 cell lines are on panel A, and FA-A-
cor, FA-C-cor, FA-A, FA-C lines are on panel B.
Proliferation in LB cells (Figure 1A, a) significantly
decreased from 100 ± 6.7 to 80.8 ± 1.1% after exposure
to microgravity. HSC93 cells behave similarly showing a
decrease from 104,80 to 84.3 ± 3 .3. No apparent prolif -
erative inhibition was seen for Jurkat and 1310 cells.
Among the four FA cell lines, (Figure 1B, a) only FA-C-
cor cells displayed a significant decrease in prolif eration
(from 94.5 ± 4.4 to 73.5 ± 6.7).
According to the trypan blue exclusion test ( Figure
1A, b and Fi gure 1B, b) and th e sub-G1 fraction quanti-
fication (Figure 1A, c and Figure 1B, c) only LB, HSC93
and FA-A-cor cells displayed a significant increase in
cellular mortality upon microgravity exposure.
Poly(ADP-ribose)polymerase (PARP) activity (Figure
1A, d and Figure 1B, d), a stress response activity gener-
ally correlated with DNA damage, was significantly
increased only in LB cells, whereas HSC93 and FA-A-
cor cells displays a non signific ant increase, a fter expo-
sure to modeled microgravity.
In conclusion, though at variable degrees, the only cell
lines significantly affected by exposure to microgravity
are LB and HSC93 and, though at a lesser extent, FA-A-
cor and FA-C-cor cells.
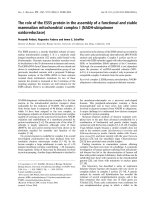
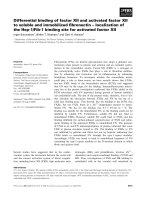
Mitochondria Membrane Potential (MMP)
Quantification of MMP gives clues on mitochondrial
functionality. An elevated polarization of the mitochon-
drial membrane is related to an efficient electron trans-
port system and an efficient generation of ATP, through
oxidative phosphorilation. A decrease in membrane
polarization is suggestive of a pre-apoptotic condition.
Cuccarolo et al. Journal of Biomedical Science 2010, 17:63
/>Page 3 of 10
In control conditions LB, HSC93, Jurkat and 1310 cells
displays an elevated mitochondrial membrane polariza-
tion (Figure 2A). In consequ ence of microgravity expo-
sure the fraction of LB and HSC93 cells with
depolarized mitochondria increased significantly (3.3
and 4.6 folds, for LB and HSC93, respectively). Jurkat
and 1 310 cells, which display a remarkable low level of
depolarized mitochondria in the unexposed condition,
were almost unaffected by microgravity. On the contrary
all the four FA cell lines displayed high percentages of
depolarized mitochondria already when unexposed (Fig-
ure 2B). Among these cell lines FA-A and FA-C cells
displayed the highest values (17.07 ± 2.03 and 25.2 ±
4.3, respectively). Microgravity expos ure induces further
decrease in MMP in FA-A-cor and FA-C-cor while in
FA-A and FA-C cells the exposure results in an increase
in MMP.
In conclusion microgravity induces a significant
decrease i n MMP in LB, HSC93 and, to a lesser extent,
in FA-A-cor cells.
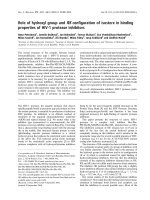
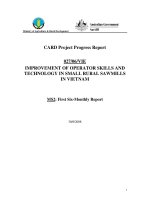
Glucose Consumption
In LB and HSC93 cells growing in normal c onditions
glucose consumption was quantified, respectively, at
1.04 ± 0.23 and 1.26 ± 0.03 mg/ml/cell (Figure 3A).
Basal glucose consumption was about two fold higher
in Jurkat and 1310 cells. In FA-A-cor and FA-C-cor
cells glucose consumption (Figure 3B) was quantified,
respectively, at 1.32 ± 0.16 and 1.41 ± 0.11, where FA-
A and FA-C cells display higher values, very close to
those measured in J urkat and 1310 cells. Upon micro-
gravity exposure significant increase in glucose con-
sumption was seen only in H SC93 (Figure 3A) and
FA-C (Figure 3B) cells. Glucose consumption is related
to cellular proliferation and gives clues on the ability
of the cells to rely preferentially on an oxidative rather
than a glycolytic metabolism. This condition, known as
the ‘ Warburg effect’ , is commonly found in cells
undergoing transforma tion [24]. This strategy allows
the maintenance of an adequate energy production,
and limits excessive oxidative stress and hypoxia thus
Figure 1 Growth and vitality in ground unexposed (open columns) or microgravity exposed (close columns) cells. A: L B, HSC93, Jurkat
and 1310 cells. B: FA-A-cor, FA-C-cor, FA-A and FA-C cells. Panel a: Proliferative ability of cells by BrdU assay. Proliferation of LB cells growing in
normal conditions was used as reference for the other cell lines. Panel b: Percentage of dying cells after trypan blue staining. Panel c:
Percentage of apoptotic cells after sub-G1 peak quantification in flow cytometry. Panel d: PARP activity fluctuactions after autoradiography of
cells incubated with (
32
P)NAD.
Figure 2 Variations in MMP in ground unexposed (open columns) or microgravity exposed (close columns) cells. A: LB, HSC93, Jurkat
and 1310 cells. B: FA-A-cor, FA-C-cor, FA-A and FA-C cells.
Cuccarolo et al. Journal of Biomedical Science 2010, 17:63
/>Page 4 of 10
inhibiting inflammatory processes. An increase in glu-
cose consumption was also been reported in cells
exposed to microgravity [25] in relationship with the
senescence-like condition reported abov e [2]. In our
hands however glucose consumption is more ele vated
in Jurkat, 1310, FA-A and FA-C cells regardless micro-
gravity exposure. In conclusion then it is the genetic
background rather than microgravity that affects glu-
cose m etabolism.
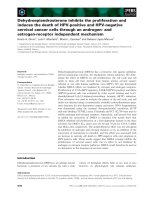
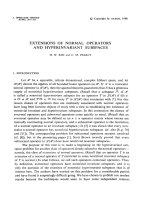
ATP
Figur e 4 reports the time course recovery for intracellu-
lar ATP during the 24 hours after t he exposure to
microgravity. Basal values for ATP in the unexposed cell
lines were normalized to the value of LB cells (3.69 ±
0.51 μmol/10
6
cells), set as the 100%. Intracellular ATP
level measured in the various cell lines, before micro-
gravity exposure were: 83.46% for HSC93, 111.65% for
Jurkat, 97.01% for 1310, 9 4.03% for FA-A-cor, 87 .80%
for FA-C-cor, 107.3% for FA-A and 79.94% for FA-C,
Exposure to microgravity results in a dramatic drop in
intracellular ATP content. Measures taken just at the
end of the 24 hours ex posure in the RPM showed that
in LB cells intracellular ATP went down to 32.4 ± 5.3%
of the value in the unexposed control (Figure 4A). A
similar decrease wa s measured also in HSC93 cells (51.6
± 6.3%). On the contrary Jurkat and 1310 cells did show
almost no decrease. Figure 4B displays results obtained
for FA cells. A significant decrease in intracellular ATP
was measured in FA-A-cor and FA-C-cor cells (52.19 ±
4.16% and 47.53 ± 3.27% respectively). The decrease in
ATP level was m uch lower in FA-A and FA-C cells
(72.4 ± 4.3% and 82.1 ± 2.1%, respe ctively). Recovery to
basal level was almost complete in 10 hours for FA-A
and FA- C cell lines while it required 24 or more hours
for LB, HSC93, FA-A-cor and FA-C-cor.
In conclusion microgravity strongly affects intracellu-
lar ATP production at least among LB, HSC93, FA-A-
cor and FA-C-cor cells. The two naturally transformed
Jurkat and 1310 cells appear unsusceptible to the
Figure 3 Glucose consumption (mg/ml/cell) in ground unexposed (open columns) or microgravity exposed (close columns) cells. A: LB,
HSC93, Jurkat and 1310 cells. B: FA-A-cor, FA-C-cor, FA-A and FA-C cells.
-10 0 80 100 120 140
50
75
100
A
LB
HSC93
JURKAT
L1310
% intracellular ATP
0 8 24 48
-10 0 80 100 120 140
50
75
100
50
75
100
B
FANCAcor
FANCCcor
FANCA
FANCC
0 8 24 48
TIME (hours)
TIME (hours)
Figure 4 Recovery in intracellular ATP in ground unexposed (solid symbols) or microgravity exposed (open symbols) cells. A:LB,
HSC93, Jurkat and 1310 cells. B: FA-A-cor, FA-C-cor, FA-A and FA-C cells. The content of ATP in the various cell lines before exposure to
microgravity was normalized to 100%.
Cuccarolo et al. Journal of Biomedical Science 2010, 17:63
/>Page 5 of 10
treatment. The two mutants FA cell lines, FA-A and
FA-C, display a reduced susceptibility to the treatment.
Oxidative Stress: TBARS and 8-OHdG repair
A reliable measure of oxidative stress is the quantifica-
tion of 8-hydroxy-2’-deoxyguanosine (8-OHdG), a good
marker of oxidative DNA damage [26]. An increased
oxidative DNA damage is often associated with the pre-
sence of genetic defects, altered metabolic fitness and
unhealthy state. It is also commonly accepted t hat
microgravity exposure does elicits an inflammation-like
reaction. In these conditions the study of 8-OHdG
repair kinetic may give clues whet her microgravity does
affects cell efficiency to cope with this stress. In our
hands however no significant increase of 8-OHdG over
the basal level was seen after exposure of the cells to
microgravity, as reported on Table 1 ( compare lanes 1
and 2).
Wewereable,instead,toquantifyabasaloxidative
stress when measuring thiobarbituric acid reactive sub-
stances (TBARS, nmol/mg protein) level, as a me asure
of free radical mediated lipid damage. As reported on
Figure 5A, LB, HSC93, Jurkat and 1310 cell’sTBARS
levels were 9.1 ± 3.8, 6.1 ± 1.4, 4.4 ± 1.4 a nd 3.7 ± 1.2,
respectively. After microgravity exposure TBARS levels
in LB and HSC93 cells increased more than two folds
(22.5 ± 7.5 and 29.1 ± 5.5, respectively) while it was
without effect in Jurkat and 1310 cells. As shown on
Figure 5B basal TBARS levels for FA-A (19.8 ± 11.5),
FA-C (15.3 ± 6.6), FA-A-cor (12.2 ± 1.4) and FA-C-cor
(7.8 ± 2.3) cells were significantly higher than the values
reported for the cells in Figure 5A. So, while TBARS
levels did show that these cells sustain a certain unba-
lance in constitutive red-ox metabolism, this condition
appears unaffected by microgravity exposure.
In order to study the eventual microgravity suscept-
ibility of the repair process efficiency within the different
cell lines 8-OHdG was induced i n cell’ sDNAby
treatment with KBrO
3
. As reported on Table 1 8-OHdG
(mol 8-OHdG/10
6
mol dG) was e fficiently induced by
this treatment (compare lanes 1 and 3). Damage induc-
tion was not affe cted by microgravity exposure as
demonstrated by the quantification of 8-OHdG in the
two conditions (compare lanes 1 to 2 and 3 to 4).
Conversely 8-OHdG repair efficiency in LB and
HSC93 appear strongly affected by microgravity expo-
sure (Figure 6A). When 50% adduct removal is reached
in LB cells in 93 ± 16 minutes, after microgravity expo-
sure the same res ult was obtained in 463 ± 34 minutes,
which roughly means a 5 folds decrease in the efficiency
of the process. Almost the same behavior is seen in t he
HSC93 cells which, upon microgravity exposure, display
a decrease in 50% repair efficiency from 108 ± 9 to 346
± 91 minutes with an overall 3 folds decrease in the effi-
ciency of the process. Jurkat and 1310 lymphoblast cells
appear much less affected by microgravity exposure as
reported on Figure 6B. In unexposed Jurkat and 1310
cells 50% repair is reached, respectively, in 109 ± 12 and
122 ± 25 minutes. After microgravity 50% repair is
reached in 106 ± 18 and 118 ± 23 minutes, respectively,
for Jurkat and 1310 cells.
In the case of the four FA cell lines the situation
appears a bit more complicate. FA-A and FA-C cells are
naturally deficient in 8-OHdG repair efficiency (Figure
6C). In unexposed cells removal of 8-OHdG was very
similar in the two mutant FA (Figure 6C) and in the
two FA corrected cell lines (Figure 6D). The 50%
removal was calculated in 168 ± 49 minutes for FA-A,
186 ± 63 minutes for FA-C, 141 ± 21 for FA-A-cor and
156 ± 33 for FA-C-cor cells). After microgravity expo-
sure a greater decrease in the efficiency of the process is
seen in FA-A-cor and FA-C-cor cells (418 ± 73 and 387
± 41 minutes, respectively) than in FA-A and FA-C cells
(223 ± 86 and 251 ± 83 minutes, respectively). While at
a lesser extent than in the comparison between LB/
HSC93 and Jurkat/1310 cells still a difference in micro-
gravity susceptibility is maintained when comparing
repair efficiency of FA-A/FA-C mutant cells and FA-A-
cor/FA-C-cor corrected FA cell lines.
Discussion
Microgravity exposure differentially affects normal and
transformed cells
We show here that transformed Jurkat and 1310 lym-
phoblast cells are resistant to microgravity exposure in
comparison to the normal, EBV immortalised, LB and
HSC93 cell lines. This resistance emerges when compar-
ing the performances of these cells to different physiolo-
gical and metabolic end points. As reported on Figure
1A, LB and HSC93 cells displays a significant decrease
in their proliferative ability 24 hour after the exposure
to microgravity. Concomitantly to this effect LB and
Table 1 8-OHdG induction following microgravity and/or
KBrO
3
treatment.
8-OHdG (mol 8-OHdG/10
6
mol dG)
lane 1 2 3 4
KBrO
3
++
microgravity - + - +
LB 0.54 0.59 1.61 1.86
HSC93 0.63 0.52 2.07 1.76
Jurkat 0.68 0.74 2.43 2.69
1310 0.41 0.36 2.19 2.44
FA-A-cor 0.84 0.67 1.97 2.51
FA-C-cor 0.76 0.73 2.87 3.26
FA-A 1.04 0.77 2.32 2.45
FA-C 0.88 0.93 3.21 2.86
Cuccarolo et al. Journal of Biomedical Science 2010, 17:63
/>Page 6 of 10
HSC93 cells displays increased trypan blue stainin g and
increased Sub-G1 percentage. LB cells display also a sig-
nificant increase in PARP activity. None of these para-
meters appear affected when Jurkat or 1310 cells were
subjected to the same protocols of microgravity expo-
sure. Again, as shown on Figure 2A, this same treatment
induces significant depolarization of mitochondrial
membrane. A decrease in MMP, measured th rou gh the
JC-1 green fluor escence which typically stains cells with
damaged mitochondria, is indicative of an early apopto-
tic onset. An highly significant increase in the fraction
of cells with depolarized mitochondrial membranes is
seen when comparing microgravity exposed LB/HSC93
with respect to Jurkat/1310 cells.
Figure 5 MBA-TBA (TBARS, nmol/mg protein) quantif ication in ground unexposed (open columns) or microgravity exposed (close
columns) cells. A: LB, HSC93, Jurkat and 1310 cells. B: FA-A-cor, FA-C-cor, FA-A and FA-C cells.
02468
0
25
50
75
100
A
LB, ground
LB, microgravity
HSC93, ground
HSC93, microgravity
% 8-OHdG removal
02468
0
25
50
75
100
B
JURKAT, ground
JURKAT, microgravity
L1310, ground
L1310, microgravity
0246810
0
25
50
75
100
FANCA, ground
FANCA, microgravity
FANCC, ground
FANCC, microgravity
C
% 8-OHdG removal
Time (hours)
02468
0
25
50
75
100
D
FANCA-cor, ground
FANCA-cor, microgravity
FANCC-cor, ground
FANCC-cor, microgravity
Time (hours)
Figure 6 Time-dependent removal of 8-OHdG in ground unexposed (close symbols) or microgravity exposed (open symbols) cells.
A: LB and HSC93 cells. B: Jurkat and 1310 cells. C: FA-A and FA-C cells. D: FA-A-cor and FA-C-cor cells.
Cuccarolo et al. Journal of Biomedical Science 2010, 17:63
/>Page 7 of 10
The drop in intracellular ATP production may be a
possible consequence of the decreased mitochondrial
functionality after microgravity exposure (Figure 4A). LB
cells display the highest reduction, up to 60%, of the
basal ATP level. Recovery to values of the unexposed
cells is accomplished during the following 48 hours.
Intracellular ATP is apparently unaffected by micrograv-
ity exposure in Jurkat and 1310 cells. Interestingly Jurkat
and 1310 cells display enhanced basal glucose consump-
tion with respect to LB/HSC93 cells (Figure 3A). An
increase in glucose consumption is commonly found in
cells undergoing transformation [24], a strategy which
allow the maintenance of an adequa te energy produc-
tion and c ompensate for possible problems related to
mitochondrial failure, inflammation, excessive oxidative
stress and hypoxia. Intracellular ATP depletion appear
inversely proportional to the ability of a given cell line
to employ glucose as a cellular fuel suggesting that
those cells which rely significantly on glycolysis do per-
formbetter.Whileithasbeenoftenreportedthatoxi-
dative imbalance o ccurs in response to simulated
microgra vitational exposure [1,27-29] we were unable to
observe the induction of an oxidative DNA damage by
microgravity exposure itself. However TBARS level mea-
sured before and after microgravity exposure (Figure
5A) did demonstrate a significant increase in oxidation
in LB and HSC93 cells but not in Jurkat and 1310 cells.
It is then finally important to note that microgravity
exposure does not affects the ability to remove 8-OHdG
in Jurkat and 1310 cells (Figure 6B) whereas in LB and
HSC93 cells (Figure 6A) thesametreatmentinduces,
respectively, a five to three folds decrease in the 8-
OHdG removal efficiency.
The effect of microgravity on Fanconi’s anemia cells
Ought to the ability of microgravity to interfere, specifi-
cally, in the pathways of DNA repair, energy, red-ox bal-
ance and apoptosis, as reported above, we were
interested to st udy the behaviour of cells affected by FA
in these conditions. FA cells does indeed pres ents char-
acteristics that are suggestive of transformed cells: ele-
vated basal oxidative stress, DNA repair defects, altered
expression of TNF-a, INF-g and other cytokines [30,31],
increased sensitivity to crosslinking agents, chromoso-
mal aberrations and genome instability (reviewed in
[15]. We previously reported [19] peculiarities in the
FA’s energy metabolism and speculate a yet unknown
mitochondrial defect in these cells. While anomalous
apoptosis was already reported in FA cells [14,32,33]
and defective mitochondrial functionality suggested
[19,34] recently defects in the cells from the FANCG
group were reported [35]. T he FA-G protein is localised
inside the mitochondria and FANCG mutants displays
mitochondria with distorted structures.
FA-A and FA-C cells display a consistent stability to
microgravity exposure (Figure 1B). Proliferative ability is
maintained in the cell lines and trypan blue staining,
percentage of Sub-G1 fraction as well as PARP activity
are not significantly affected, with respect to unexposed
cells, by microgravity. Also MMP (Figure 2B) is not
significantly affected in these conditions.
Microgravity induces depletion in intracellular ATP
(Figure 4B) to 72.4 ± 4.3% and 82.1 ± 2.1%, respectively,
for FA-A and FA-C cells, which is less dramatic in com-
parison with the depletion reported for LB and HSC93
cells. Recovery to values of the unexposed cells is
accomplished thereafter and both FA-A and FA-C cells
display the fastest recovery kinetics. Regardless micro-
gravity exposure both FA cell lines show an increase in
glucose utilization (Figure 3B), unlike HSC93 and LB
cells, at a n extent s imilar to the Jurkat/1310 cells. As
mentioned above the adoption of a s trategy which per-
mits to these cells to metabolise glucose with high effi-
ciency strongly suggest that these cells thrive in a
metabolic equilibrium far from that of a normal cell
[24]. Expos ure to microgravity induce a further increase
in gluco se consumption at least fo r FA-C cells
(Figure 3B).
We finally concentrate on the characterization of the
oxidative metabolism in the FA cells. An oxidative
imbalance in FA cells is suggested by the high level of
TBARS measured in these cells in basal conditions (Fig-
ure 5B). Howev er after microgravity e xposure TBARS
content does increased significantly in LB and HSC93
cells while it does not increase in FA-A/FA-C nor in the
two FA-corrected cell lines. Whi le FA cells are defective
in repair of oxidatively dama ged DNA [36] and a 2-fold
slower kinetic of repair of 8-OHdG was found in the
comparison b etween LB and HSC93 cells (please com-
pare panels A, C and D in Figure 6), when these cells
were exposed to microgravity the decrease in 8-OHdG
repair efficiency found in FA-A and FA-C cells (Figure
6C) was reduced in comparison with what was observed
in LB and HSC93 cells (Figure 6A).
Conclusions
In conclusion microgravity appear able to differentially
affect the physiological properties of the exposed cells.
While microgravity exposure may be favourable for the
growth and survival of the transformed Jurkat and 1310
cells, in normal cells the increased apoptotic susceptibil-
ity, the depletion of energy storages and the reduced
repair ability, which are probably linked to the downre-
gulation of genes deputed to the control and regulation
of these activities, may likely expose these cells to the
risk of malignant transformat ion [9]. Microgravity
should then be regarded as a harmful con dition for nor-
mal as well for transformed cells and tissues. This is an
Cuccarolo et al. Journal of Biomedical Science 2010, 17:63
/>Page 8 of 10
important issue when considering the health risks asso-
ciated with the exposure to space environment signifi-
cantly taking into account solely the contribute of
microgravity without the influence of radiation.
A second conclusion is that FA-A and FA-C cells are
resistant to simulated microgravity, analogously to Jur-
kat/1310 transformed cells. On the contrary the beha-
vior of the two FA-corrected cell lines appear closer to
the behavior of the normal LB/HSC93 cell lines.
Mutant FA cells display an altered metabolism charac-
terized by defects in the pathways that controls energy
production and apoptosis. The same metabolic changes
that characterize FA resistance to microgravity are those
displayed by cells progressing from a normal to a trans-
formed phenotype [24]. We can thus speculate that
microgravity appear agonistic with transformation and
the resistanc e to microgravity displayed by the FA cells
furtherly underlines their carcinogenic potential.
Modeled microgravity and space-based technology can
eventually be regarded as interesting and unique tools in
the biomedicine laboratory as they offer an original, use-
ful and unique approach in the study of cellular bio-
chemistry and in the regulation of metabolic pathways.
Experiments employ ing modelled, instead of space-
based, microgravity have the advantage to select solely
for t his stressor without the interfering effect of radia-
tion. Furthermore modeled microgravity experimenta-
tion can be realized without constrains in terms of
sample amounts, numerosity and size with the advan-
tage to test many different exposure conditions. Experi-
ments can thus be performed with economy and
accuracy, conditions that are impossible to realize in
space.
Additional material
Additional file 1: Portrait of the Random Positioning Machine
(RPM). Portrait of the RPM used to simulate microgravity exposure of the
cells. RPM is located in a room that permits temperature control and ad
hoc manipulations.
Acknowledgements
The work has been supported by ASI grant n. 1/014/66/0 (MoMa - ERMEIS)
to PD and SV.
Author details
1
Department of Epidemiology, Prevention and Special Functions, National
Institute for Cancer Research (IST), Genova, Italy.
2
Department of Biology,
University of Genova, Genova, Italy.
3
Department of Advanced Diagnostic
Technologies, National Institute for Cancer Research (IST), Genova, Italy.
4
Current Address: Department of Internal Medicine, University of Genova,
Genova, Italy.
Authors’ contributions
PC, FB and MS prepared and performed all the experimental work presented
in the paper. PD performed the HPLC analysis. SV helped with the rationale
in the project and discussed it. PD prepared the manuscript.
Competing interests
The authors declare that they have no competing interests.
Received: 9 February 2010 Accepted: 28 July 2010
Published: 28 July 2010
References
1. Degan P, Sancandi M, Zunino A, Ottaggio L, Viaggi S, Cesarone F, Pippia P,
Galleri G, Abbondandolo A: Exposure of human lymphocytes and
lymphoblastoid cells to simulated microgravity strongly affects energy
metabolism and DNA repair. J Cell Biochem 2005, 94:460-9.
2. Wang E: Age-dependent atrophy and microgravity travel: what do they
have in common? FASEB J 1999, 13(Suppl S):167-74.
3. Coinu R, Chiaviello A, Galleri G, Franconi F, Crescenzi E, Palumbo G:
Exposure to modeled microgravity induces metabolic idleness in
malignant human MCF-7 and normal murine VSMC cells. FEBS Lett 2006,
580:2465-70.
4. Sundaresan A, Risin D, Pellis NR: Loss of signal transduction and inhibition
of lymphocyte locomotion in a ground-based model of microgravity. In
Vitro Cell Dev Biol Anim 2002, 38:118-22.
5. Sundaresan A, Risin D, Pellis NR: Modeled microgravity-induced protein
kinase C isoform expression in human lymphocytes. J Appl Physiol 2004,
96:2028-33.
6. Hughes-Fulford M, Sugano E, Schopper T, Li CF, Boonyaratanakornkit JB,
Cogoli A: Early immune response and regulation of IL-2 receptor
subunits. Cell Signal 2005, 17:1111-24.
7. Boonyaratanakornkit JB, Cogoli A, Li CF, Schopper T, Pippia P, Galleri G,
Meloni MA, Hughes-Fulford M: Key gravity-sensitive signaling pathways
drive T cell activation. FASEB J 2005, 19:2020-2022.
8. Ward NE, Pellis NR, Risin SA, Risin D: Gene expression alterations in
activated human T-cells induced by modeled microgravity. J Cell Biochem
2006, 99:1187-202.
9. Kumari R, Singh KP, Dumond JW Jr: Simulated microgravity decreases
DNA repair capacity and induces DNA damage in human lymphocytes. J
Cell Biochem 2009, 107:723-31.
10. Piepmeier EH, Kalns JE, McIntyre KM, Lewis ML: Prolonged weightlessness
affects promyelocytic multidrug resistance. Exp Cell Res 1997, 237:410-8.
11. Lewis ML, Cubano LA, Zhao B, Dinh HK, Pabalan JG, Piepmeier EH,
Bowman PD: cDNA microarray reveals altered cytoskeletal gene
expression in space-flown leukemic T lymphocytes (Jurkat). FASEB J 2001,
15:1783-5.
12. Taga M, Yamauchi K, Odle J, Furian L, Sundaresan A, Ramesh GT, Pellis NR,
Andrassy RJ, Kulkarni AD: Melanoma growth and tumorigenicity in
models of microgravity. Aviat Space Environ Med 2006, 77:1113-6.
13. Mathew CG: Fanconi anaemia genes and susceptibility to cancer.
Oncogene 2006, 25:5875-84.
14. Du W, Adam Z, Rani R, Zhang X, Pang Q: Oxidative stress in Fanconi
anemia hematopoiesis and disease progression.
Antioxid Redox Signal
2008, 10:1909-21.
15. Pagano G, Degan P, d’ Ischia M, Kelly FJ, Nobili B, Pallardó FV, Youssoufian H,
Zatterale A: Oxidative stress as a multiple effector in Fanconi anaemia
clinical phenotype. Eur J Haematol 2005, 75:93-100.
16. Collins N, Kupfer GM: Molecular pathogenesis of Fanconi anemia. Int J
Hematol 2005, 82:176-83.
17. Taniguchi T, D’Andrea AD: Molecular pathogenesis of Fanconi anemia:
recent progress. Blood 2006, 107:4223-33.
18. Pagano G, Degan P, d’Ischia M, Kelly FJ, Pallardó FV, Zatterale A, Anak SS,
Akisik EE, Beneduce G, Calzone R, De Nicola E, Dunster C, Lloret A, Manini P,
Nobili B, Saviano A, Vuttariello E, Warnau M: Gender- and age-related
distinctions for the in vivo prooxidant state in Fanconi anaemia patients.
Carcinogenesis 2004, 25:1899-909.
19. Bogliolo M, Borghini S, Abbondandolo A, Degan P: Alternative metabolic
pathways for energy supply and resistance to apoptosis in Fanconi
anaemia. Mutagenesis 2002, 17:25-30.
20. Borst AG, Van Loon JJWA: Technology and developments for the Random
Positioning Machine, RPM. Microgravity Sci Technol 2009, 21:287-292.
21. Cesarone CF, Scarabelli L, Demori I, Balocco S, Fugassa E: Poly(ADP-ribose)
polymerase is affected early by thyroid state during liver regeneration in
rats. Am J Physiol Gastrointest Liver Physiol 2000, 279:G1219-25.
22. Polla BS, Kantengwa S, François D, Salvioli S, Franceschi C, Marsac C,
Cossarizza A: Mitochondria are selective targets for the protective effects
Cuccarolo et al. Journal of Biomedical Science 2010, 17:63
/>Page 9 of 10
of heat shock against oxidative injury. Proc Natl Acad Sci (USA) 1996,
93:6458-63.
23. De Luca G, Russo MT, Degan P, Tiveron C, Zijno A, Meccia E, Ventura I,
Mattei E, Nakabeppu Y, Crescenzi M, Pepponi R, Pèzzola A, Popoli P,
Bignami M: A role for oxidized DNA precursors in Huntington’s disease-
like striatal neurodegeneration. PLoS Genet 2008, 4:e1000266.
24. Ramanathan A, Wang C, Schreiber SL: Perturbational profiling of a cell-line
model of tumorigenesis by using metabolic measurements. Proc Natl
Acad Sci (USA) 2005, 102:5992-7.
25. Lewis ML, Reynolds JL, Cubano LA, Hatton JP, Lawless BD, Piepmeier EH:
Spaceflight alters microtubules and increases apoptosis in human
lymphocytes (Jurkat). FASEB J 1998, 12:1007-18.
26. Degan P, Bonassi S, De Caterina M, Korkina LG, Pinto L, Scopacasa F,
Zatterale A, Calzone R, Pagano G: In vivo accumulation of 8-hydroxy-2’-
deoxyguanosine in DNA correlates with release of reactive oxygen
species in Fanconi’s anaemia families. Carcinogenesis 1995, 16:735-41.
27. Stein TP: Space flight and oxidative stress. Nutrition 2002, 18:867-71.
28. Wise KC, Manna SK, Yamauchi K, Ramesh V, Wilson BL, Thomas RL, Sarkar S,
Kulkarni AD, Pellis NR, Ramesh GT: Activation of nuclear transcription
factor-kappaB in mouse brain induced by a simulated microgravity
environment. In Vitro Cell Dev Biol Anim 2005, 41:118-23.
29. Liu Y, Wang E: Transcriptional analysis of normal human fibroblast
responses to microgravity stress. Genomics Proteomics Bioinformatics 2008,
6:29-41.
30. Dufour C, Corcione A, Svahn J, Haupt R, Poggi V, Béka’ssy AN, Scimè R,
Pistorio A, Pistoia V: TNF-alpha and IFN-gamma are overexpressed in the
bone marrow of Fanconi anemia patients and TNF-alpha suppresses
erythropoiesis in vitro. Blood 2003, 102:2053-9.
31. Li J, Sejas DP, Zhang X, Qiu Y, Nattamai KJ, Rani R, Rathbun KR, Geiger H,
Williams DA, Bagby GC, Pang Q: TNF-alpha induces leukemic clonal
evolution ex vivo in Fanconi anemia group C murine stem cells. J Clin
Invest 2007, 117:3283-95.
32. Martinez A, Hinz JM, Gómez L, Molina B, Acuña H, Jones IM, Frias S,
Coleman MA: Differential expression of TP53 associated genes in
Fanconi anemia cells after mitomycin C and hydroxyurea treatment.
Mutat Res 2008, 656:1-7.
33. Sii-Felice K, Barroca V, Etienne O, Riou L, Hoffschir F, Fouchet P, Boussin FD,
Mouthon MA: Role of Fanconi DNA repair pathway in neural stem cell
homeostasis. Cell Cycle 2008, 7:1911-5.
34. Monti D, Macchioni S, Guido M, Pagano G, Zatterale A, Calzone R,
Cossarizza A, Straface E, Malorni W, Franceschi C: Resistance to apoptosis
in Fanconi
’s anaemia. An ex vivo study in peripheral blood mononuclear
cells. FEBS Lett 1997, 409:365-9.
35. Mukhopadhyay SS, Leung KS, Hicks MJ, Hastings PJ, Youssoufian H, Plon SE:
Defective mitochondrial peroxiredoxin-3 results in sensitivity to
oxidative stress in Fanconi anemia. J Cell Biol 2006, 175:225-35.
36. Zunino A, Degan P, Vigo T, Abbondandolo A: Hydrogen peroxide: effects
on DNA, chromosomes, cell cycle and apoptosis induction in Fanconi’s
anemia cell lines. Mutagenesis 2001, 16:283-8.
doi:10.1186/1423-0127-17-63
Cite this article as: Cuccarolo et al.: Differential behaviour of normal,
transformed and Fanconi’s anemia lymphoblastoid cells to modeled
microgravity. Journal of Biomedical Science 2010 17:63.
Submit your next manuscript to BioMed Central
and take full advantage of:
• Convenient online submission
• Thorough peer review
• No space constraints or color figure charges
• Immediate publication on acceptance
• Inclusion in PubMed, CAS, Scopus and Google Scholar
• Research which is freely available for redistribution
Submit your manuscript at
www.biomedcentral.com/submit
Cuccarolo et al. Journal of Biomedical Science 2010, 17:63
/>Page 10 of 10