Báo cáo y học: "Enhanced glutamate, IP3 and cAMP activity in the cerebral cortex of Unilateral 6-hydroxydopamine induced Parkinson’s rats: Effect of 5-HT, GABA and bone marrow cell supplementation" ppsx
Bạn đang xem bản rút gọn của tài liệu. Xem và tải ngay bản đầy đủ của tài liệu tại đây (691.13 KB, 10 trang )
RESEARCH Open Access
Enhanced glutamate, IP3 and cAMP activity in the
cerebral cortex of Unilateral 6-hydroxydopamine
induced Parkinson’s rats: Effect of 5-HT, GABA and
bone marrow cell supplementation
MS Nandhu, Jes Paul, Korah P Kuruvilla, Anitha Malat, Chinthu Romeo, CS Paulose
*
Abstract
Parkinson’s disease is characterized by progressive cell death in the substantia nigra pars compacta, which leads to
dopamine depletion in the striatum and indirectly to cortical dysfunction. Increased glutamatergic transmission in
the basal ganglia is implicated in the pathophysiology of Parkinson’s disease and glutamate receptor mediated
excitotoxicity has been suggested to be one of the possible causes of the neuronal dege neration. In the present
study, the effects of serotonin, gamma-aminobutyric acid and bone marrow cells infused intranigrally to substantia
nigra individually and in combination on unilateral 6-hydroxydopamine induced Parkinson’s rat model was
analyzed. Scatchard analysis of total glutamate and NMDA receptor binding parameters showed a significant
increase in B
max
(P < 0.001) in the cerebral cortex of 6-hydroxydopamine infused rat compared to control. Real
Time PCR amplification of NMDA2B, mGluR5, bax, and ubiquitin carboxy-terminal hydrolase were up regulated in
cerebral cortex of 6-hydroxydopamine infused rats compa red to control . Gene expression studies of GLAST,
ά-Synuclien and Cyclic AMP response element-binding protein showed a significant (P < 0.001) down regulation in
6-OHDA infused rats compared to control. Behavioural studies were carried out to confirm the biochemical and
molecular studies. Serotonin and GABA along with bone marrow cells in combination showed reversal of
glutamate receptors and behaviour abnormality shown in the Parkinson’s rat model. The therapeutic significance in
Parkinson’s disease is of prominence.
Background
Parkinson’s disease (PD), one of the most pre valent neu-
rodegenerative disorders among the elderly population, is
charecteri sed b y dopa mine neurons degeneration in the
substantia nigra pars compacta. Which makes an impact
on ascending adrenergic and serotonergic networks, fron-
tocortical cholinergic proje ctions, and a diversity of neu-
ronal circuits located not only in the brain (from the
cortex to the medulla), but even in the spinal cord and
sympathetic nervous system [1,2]. Recent studies have
shown abnorm al mitochondrial content and functio n,
also an increased oxidative stress and oxidative responses
in the cerebral cortex in PD [3]. According to the
classical model of basal ganglia organization , the usual
facilitating effect of thalamic projections to the cerebral
cortex is reduced in PD [4]. The motor dysfunction of
PD is generally accompanied by depressed affect and cog-
nitive impairment, comprising the triad of deficits that
most profoundly interfere with patient quality of life [5].
Antagonising excitotoxicity has been considered to have
therapeutic potential for th e treatment of PD. Glutamate
neurotransmission plays an integral role in basal ganglia
functioning especially in the striatum, where the balance
of glutamate and dopamine is cr itical but also in the sub-
stantia nigra which receives glutamatergic input from the
subthalamic nucleus and cortex [6]. At physiological con-
centrations, glutamate mediates learning and memory
processes [7]. However, at high concentrations, glutamate
acts as a neurotoxin and promotes neuronal cell injury
and death in PD [8].
* Correspondence:
Molecular Neurobiology and Cell Biology Unit, Centre for Neuroscience,
Department of Biotechnology, Cochin University of Science and Technology,
Cochin - 682 022, and Kerala, India
Nandhu et al. Journal of Biomedical Science 2011, 18:5
/>© 2011 Nandhu et al; licensee BioMed Central Ltd. This is an Open Access article distributed under the terms of the Creative Commons
Attribution License ( which permits unres tricted use, distribution, and reproduction in
any mediu m, provided the original work is properly cited.
Cell transplantation to replace lost neurons is a pro-
mising approach for the treatment of progressive neuro-
degenerative diseases. Autologous bone marrow cells
(BMC) can be used as a source of progenitor c ells for
the central nervous system. It circumvents both ethical
and immunological constraints related with stem c ell
therapy. Neurotransmitter’s combination as therapeutic
agents for cell proliferation and differentiation is a novel
approach. In rats, 5-HT neurons in the brainstem raphe
are among the first neurons to differentiate in the brain
and play a key role in regulating neurogenesis [9]. Lau-
der and Krebs [1 0] reported that parachlo rophenylal a-
nine (PCPA), a 5-HT synthesis inhib itor, retarded
neuronal maturation, while mild stress, a releaser of
hormones, accelerated neuronal differentiation. These
workers defined differentiation as the cessation of cell
division measured by incorporation of
3
H-thymidine.
Since then, many other workers have shown a role for
serotonin in neuronal differentiation [11]. GABA, the
main inhibitory neurotransmitter in the mature CNS,
was recently implicated in playing a complex role during
neurogenesis [12,13]. Through embryonic development,
GABA was demonstrated as acting as a chemo-
attractant and being involved in the regulation of pro-
genitor cell proliferation. For example, GABA induces
migration and motility of acutely dissociated embryonic
cortical neurons [12,14]. GABA acts as a trophic factor
not solely during prenatal neurogenesis but also in the
postnatal period in injured tissue. The effect of GABA
involves stimulation of c ell proliferation and Nerve
growth factor secretion [15]. We have previously shown
that Serotonin (5HT) and Gamma aminobutyric acid
(GABA) acting through specific receptor subtypes 5HT
2
[16] and GABA
A
[17] respectively, control cell prolifera-
tion and act as comitog ens. Our pres ent study demon-
strates the structural and molecular changes of
6-OHDA infused unilateral Parkinson’ smodelusing
5-HT, GABA and BMC individually and in combination.
Materials and methods
Animals
Experiments were carried out on adult male Wistar rats of
250-300 g body weight purchased from Kerala Agricultural
University, Mannuthy, were used for all experiments. They
were housed in separate cages under 12 hrs light and
12 hrs dark periods and were maintained on standard
food pellets and water ad libitum. All animal care and
procedures were taken in accordance with the Institu-
tional, National Institute of Health guidelines and
CPCSEA guidelines.
Chemicals used and their sources
Biochemicals, Tri-reagent kit, primary and secondary
antibodies used in the present study were purchased
from Sigma Chemical Co., St. Louis, USA. All other
reagents were of analytical grade purchased locally.
L-[G-
3
H]Glutamic acid (Sp. Activity 49.0 Ci/mmol) was
purchased from Amersham Life Science, UK. (+)-[3-
3
H]
MK-801 (Sp. Activity 27.5 Ci/mmol) was purchased
from Perkin Elmer, Boston, MA, USA. ABI PRISM High
Capacity cDNA Archive kit, Primers and Taqman
probes for Real-Time PCR were purchased from Applied
Biosystems, Foster City, CA, USA.
Experimental design
The experimental rats were divided into the following
groups i) Control ii) 6-OHDA infused (6-OHDA) iii)
6-OHDA infused supplemented with Serotonin (6-OHDA
+ 5-HT) and iv) 6-OHDA infused supplemented with
GABA (6-OHDA + GABA) v) 6 -OHDA infused supple-
mented with Bone marrow cells (isolated from r ats on
femur) (6-OHDA + BMC) vi) 6-OHDA infused supple-
mented with 5-HT and BMC (6-OHDA+5-HT+BMC) vii)
6-OHDA infused supplemented with GABA and BMC
(6-OHDA+ GABA+BMC) viii) 6-OHDA infused supple-
mented with 5-HT, GABA and BMC (6-OHDA+5-HT
+GABA+BMC). Each group consisted of 6-8 animals.
Rats were anesthetized with Chloryl Hydrate (450 mg/kg
body weight. i.p.). The animal was placed in the flat skull
position on a cotton bed on a stereotaxic frame (Bench-
mark™, USA) with incisor bar fixed at 3.5 mm below the
interaural line. 6-OHDA (8 μgin1μl in 0.2% ascorbic
acid) was infused into the right Substantia nigra Pars com-
pacta (SNpc) at a flow rate of 0.2 μl/min. After stopping
the infusion of the toxin, the probe was kept in the same
position for a fu rther 5 min for complete diffusion of the
drug and then slowly retracted. All the groups except
Control group were infused with 6-OHDA and in control
animals, 1 μl of the vehicle (0.2% ascorbic acid) was
infused into the right SNpc.
Rotational behavior
Amphetamine-induced rotational behavior was assessed
as described earlier [18]. Rats were tested with ampheta-
mine on the 14
th
day after intranigral injection of
6-OHDA and with apomorphine on the 16
th
day. Ani-
mals that had completed a 360
◦
circle towards the intact
(contralateral) and the lesioned (ipsilateral) sides were
counted for 60 min continuously and recorded sepa-
rately (animals that showed no significant contralateral
rotations were excluded from the study).
Treatment
On the 18
th
day and Stereotaxic single dose o f 1 μlof
5-HT (10 μg/μl), GABA(10 μg/μl) and 10 μl of Bone mar-
row cell (BMC) (10
6
Cells/ml) suspension individually
and in combination (combinational treatment) was
infused into t he right SNpc at a flow rate of 0.2 μl/min
Nandhu et al. Journal of Biomedical Science 2011, 18:5
/>Page 2 of 10
intotherespectivegroups.Onthe30
th
day and the apo-
morphine-induced rotations w ere recorded f or every
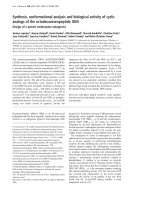
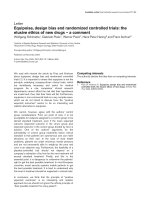
10 min duration for a period of 70 min (Figure 1). All the
control and experimental rats were sacrificed by decapi-
tation. The cerebral cortex was dissected out quickly over
ice [19] and t he tissues were stored at -80°C for various
experiments.
Quantification Dopamine in the cerebral cortex
The monoamines were assayed according to the modified
procedure of Paulose et al., [20]. The cerebral cortex of
experimental gropes of rats was homogenised in 0.4N
perchloric acid. The homogenate was then centrifuged at
5000 × g for 10 minutes at 4°C in a Sigma 3K30 r efriger-
ated centrifuge and the clear supernatant was filtered
through 0.22 μm HPLC grade filters and used for HPLC
analysis.
Dopamine (DA) contents was determined in high per-
formance liquid chromatography (HPLC) with electroche-
mical detector (ECD) (Waters, USA) fitted with CLC-ODS
reverse phase column of 5 μm particle size. The mobile
phase con sisted of 50 mM sodium phosphate dibasic,
0.03M citric acid, 0.1 mM EDTA, 0.6 mM sodium octyl
sulfonate, 15% methanol. The pH was adjusted to 3.25
with orthophosphoric acid, filtered through 0.22 μm filter
(Millipore) and degassed. A Waters (model 515, Milfor d,
USA) pump was used to deliver the solvent at a rate of
1 ml/minute. The neurotransmitters and their metabolites
were identified by amperometric detection using an
electrochemical detector (Waters, model 2465) with a
reduction potential of +0.80 V. Twenty microlitre aliquots
of the acidified supernatant were injected in to the system
for detection. The peaks were identified by relative reten-
tion times compared with external standards and quantita-
tively estimated using an integrator (Empower sof tware)
interfaced with the detector.
Glutamate content analysis in the cerebral cortex
Glutamate contents in the cerebral cortex of experimen-
tal groups were q uantified by displacement method
using modified procedure of Enna and Snyder [21].
Tissue was homogenized in 20 volumes of 0.32 M
sucrose, 10 mM Tri s/HCl and 1 mM MgCl
2
buffer,
pH 7.4, with a polytron homogenizer. The homogenate
was centrifuged twice at 27,000 × g for 15 minutes. The
supernatant were pooled and used for the assay. The
incubation mixture for glutamate quantification con-
tained 1 nM [
3
H] glutamate with and without glutamate
at a concentration range of 10
-9
Mto10
-4
M.
Glutamate Receptor Binding Studies Using [
3
H]Glutamate
Membranes were pre pared according to the modified
method of Timothy et al., [22]. Membranes were incu-
bated in 0.25 ml reaction mixture containing 25 mM
Tris-HCl,pH7.4,5mMMgCl
2
and 20 nM to 350 nM
of [
3
H]Glutamate containing 0.2 mg to 0.3 mg protein
concentrations. Nonspecific binding was determined by
adding 350 μM nonradioactive glutamate to the reaction
mixture in a parallel assay.
NMDA Receptor Binding Studies Using [
3
H] MK-801
The membrane fractions were prepared by a modification
of the method described by Hoffman et al., [23]. The [
3
H]
MK-801 binding saturation assay was performed in a
concentration range of 0.25 to 50 nM at 23°C in an assay
medium containing 10 mM HEPES, pH 7.0, 200 - 250 μg
of protein, 100 μM glycine and 100 μM glutamate. Speci-
fic [
3
H] MK-801 binding was obtained by subtracting
nonspecific binding in the presence of 100 μM unlabeled
MK-801 from the total binding.
Protein Determination
Protein was measured [24] using bovine serum albumin
as standard. The intensity of the purple blue colour
formed was proportional to the amount of protein
which was read in a spectrophotometer at 660 nm.
Analysis of the Receptor-Binding Data
Linear Regression Analysis for Scatchard Plots
Thedatawereanalysed[25].Thespecificbindingwas
determined by subtracting non-specific binding from the
total. The binding parameters, maximal binding ( B
max
)
and equilibrium dissociation constant (K
d
), were derived
a
b,e
c,d
Figure 1 Apomorphine induced rotational behaviour in
experimental rats. Adult male Wistar rats were intranigrally infused
with 6-OHDA (8 μgin1μl). Bone marrow cell and neurotransmitters
were infused individually and in combination in denervated striatum
on the 18
th
day. Animals were injected with apomorphine (1 mg/kg;
s.c.) on the 30
th
day and the apomorphine-induced rotations were
recorded for every 10 min duration for a period of 70 min. Values are
Mean ± S.E.M of 4-6 separate experiments. Each group consist 6-8
rats.
a
p < 0.001,
b
p < 0.01,
c
P < 0.05 when compared to Control.
d
p < 0.001,
e
p < 0.01 when compared to 6-OHDA group.
Nandhu et al. Journal of Biomedical Science 2011, 18:5
/>Page 3 of 10
by linear regression analysis by plotting the specific
bindin g of the radioligand on th e X-axis and bound/free
on the Y-axis. The maximal binding is a measure of the
total number of r eceptors present in the tissue and
the equilibrium dissociation constant is the measure of
the affinity of the receptors for the radioligand. The K
d
is inversely related to receptor affinity.
Quantification of IP3
The cerebral cortex was homogenised in a polytron
homogeniser in 50 mM Tris-HCl buffer, pH.7.4, con-
taining 1 mM EDTA to obtain a 15% homo genate. The
homogenat e was then centrifuge d at 40,000 × g for
15 min. and the supernatant was transferred to f resh
tubes for IP3 assay using [
3
H]IP3 B iotrak Assay System
kit. The unkno wn concentrations were determined from
the standard curve using appropriate dilutions and cal-
culated for picomoles/g wt. of the tissue.
A standard curve was plotted with %B/Bo on the
Y-axis and IP3 concentration (pmoles/tube) on the
X-axis of a semi-log graph paper. %B/B
o
was calculated as:
()
()
Standard or sample cpm NSB cpm
B cpm NSB cpm
−
−
×
0
100
NSB- non specific binding and B
0
- zero binding. IP3
concentrations in the samples were determined by inter-
polation from the plotted standard curve.
cAMP content in the cerebral cortex of control and
experimental rats
The cerebral cortex was homogenised in a polytron
homogeniser with cold 50 mM Tr is-HCl buffer, pH 7.4,
containing 1 mM EDTA to obtain a 15% homogenate.
The homogenate was then centrifuged at 40,000 × g for
15 min and the supernatant was transferred to fresh
tubes for cAMP assay using [
3
H]cAMP Biotrak Assay
System kit. The unknown concentrations were deter-
mined from the standard curve using appropriate dilu-
tions and calculated for picomoles/g wt. of the tissue.
C
o
/C
x
was plotted on the Y-axis against picomoles of
inactive cAMP o n the X- axis of a linear graph paper,
where C
o
is the counts per minute bound in the absence
of unlabelled cAMP and C
x
was the c ounts per minute
bound in the presence of standard or unknown unla-
belled cAMP. From the C
o
/C
x
value for the sample, the
number of picomoles of unknown cAMP was calculated.
Analysis of gene expression by real-time polymerase chain
reaction
RNA was isolated using Tri reagent. Total cDNA synthesis
was performed using ABI PRISM cDNA Archive kit. Real-
Time PCR assays were performed in 96-well plates in ABI
7300 Real-Ti me PCR instrument (Applied Biosystems).
PCR analys es were conducted with gene-specific primers
and fluorescently labelled Taqman probe of NMDA2B,
mGluR5, GLAST , bax, ά-Synuclien, ubiquitin carboxy-
terminal hydrolase and Cyclic AMP response eleme nt-
binding protein (CREB) (designed by Applied Biosystems).
Endogenous control, b-actin, was labeled with a report
dye, VIC.
NMDA2B and mGluR5 Receptor Expression using Confocal
Microscope
The rat was transcardially perfused with PBS, pH- 7.4, fol-
lowe d by 4% paraformaldehyde in PBS [26]. 10 μmbrain
sections were cut using Cryostat (Leica, CM1510 S).
Brain slices were incubated overnight at 4°C with rat
primary antibody for NMDA2B and mGluR5. After over-
night incubation brain slices were incubated with the
secondary antibody of FITC. The sections were observed
and photographed using confocal imaging system (Leica
SP 5).
Statistical Analysis
Statistical evaluations were done with analysis of var-
iance (ANOVA), using GraphPad Instat (version 2.04a,
San Diego, USA). Student Newman-Keuls test was used
to compare different groups after ANOVA. Linear
regression Scatchard plots were made using SIGMA
PLOT (Ver 2.03). Relative Quantification Software was
used for analyzing Real-Time PCR results.
Results
Dopamine content in the cerebral cortex
6-OHDA infusion in to the SNpc resulted in a signifi-
cant (p < 0.001) decrease in dopamine content in the
cerebral cortex of PD rats. Dopamine production was
lower in the rats treated with 5-HT, GABA, BMC indi-
vidually. Combinational treatment signifi cantly reversed
the dopamine content to near control level (Table 1).
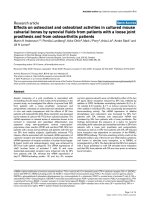
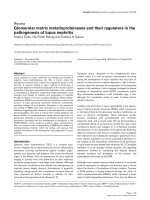
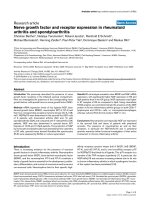
Glutamate, IP3 and cAMP content in the cerebral cortex
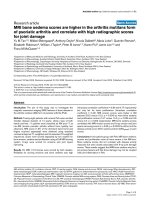
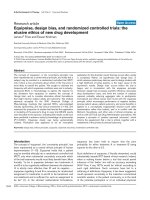
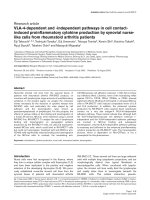
Glutamate, IP3 and cAMP content showed a significant
increase in cerebral cortex of 6-OHDA rats compared to
control. Individual treatment with BMC, 5-HT and
GABA didn’t alter the changes. Combinational treat-
ment significantly reversed the content values to near
control level (Figure 2, 3 and 4).
Total glutamate receptor analysis
Scatchard analysis of [
3
H]glutam ate against glutamate in
cerebral cortex of 6-OHDA group of rats showed a sig-
nificant (p < 0.001) increase in B
max
compared to con-
trol rats. 6-OHDA+BMC group treated rats didn ’ t
reverse t hese changes. Combinational treatment signifi-
cantly (p < 0.001) reversed these changes to nea r con-
trol. There was no significant change in K
d
in all
experimental groups (Table 2).
NMDA receptor analysis
Scatchard analysis of [
3
H]MK-801 against MK-801 in
cerebral cortex of 6-OHDA group of rats showed a
Nandhu et al. Journal of Biomedical Science 2011, 18:5
/>Page 4 of 10
significant (p < 0.001) up regulation in B
max
compared to
control rats. Individual treatment group rats didn’t
reverse these changes. Combinational treat ment sig nifi-
cantly (p < 0. 001) reversed these changes to near control.
There was no significant change in K
d
in all experimental
groups indicating that there is no c hange in t he affinity
of the receptors. This increased B
max
reflected an
increased number of NMDA receptors in the experimen-
tal groups (Table 3).
Real time PCR analysis of NMDA2B, mGluR5, GLAST, bax,
ά-Synuclien, ubiquitin carboxy-terminal hydrolase and
CREB
Gene expression studies of NMDA2B, mGluR5, bax and
ubiquitin carboxy-terminal hydrolase showed a signifi-
cant (P < 0.001) u p regulation in 6-OHDA infused rats
Table 1 Dopamine Content (pmol/mg protein) in the
Cerebral cortex of experimental rats
Animal status Dopamine Content
(pmol/mg protein)
Control 57.05 ± 2.90
6-OHDA 3.57 ± 1.34
a
6-OHDA +5HT 14.21 ± 1.51
b,f
6-OHDA +GABA 13.38 ± 1.64
b,f
6-OHDA +BMC 5.24 ± 2.25
a
6-OHDA +5HT + BMC 37.82 ± 3.47
c,e
6-OHDA + GABA + BMC 39.63 ± 3.82
c,e
6-OHDA +5HT + GABA+ BMC 50.41 ± 3.02
c,d
Values are Mean ± S.E.M of 4-6 separate experiments. Each group consist 6-8 rats.
a
p < 0.001,
b
p < 0.01,
c
P < 0.05 when compared to Control.
d
p < 0.001,
e
p < 0.01,
f
P < 0.05 when compared to 6-OHDA group.
C - Control, 6-OHDA - 6-OHDA infused, 6-OHDA +5-HT - 6-OHDA infused
treated with Serotonin, 6-OHDA +GABA - 6-OHDA infused treated with GABA,
6-OHDA +BMC- 6-OHDA infused treated with BMC, 6-OHDA +5-HT+BMC-
6-OHDA infused treated with Serotonin and BMC, 6-OHDA + GABA +BMC-
6-OHDA infused treated with GABA and BMC, 6-OHDA +5-HT + GABA+ BMC-
6-OHDA infused treated with Serotonin, GABA and BMC.
0
50
100
150
200
250
300
350
400
450
Control 6-OHDA 6-OHDA +
5HT
6-OHDA +
GABA
6-OHDA +
BMC
6-OHDA
+5HT+BMC
6-OHDA +
GABA+BMC
6-OHDA
+5HT+
G
ABA+BM
C
Glutamate Content (nmoles/g wt. of the tissue)
a
a
b,f b,f
c,e
c,e
d
Figure 2 Representative graph showing Glutamate content in
the cerebral cortex of experimental rats. Values are Mean ± S.E.
M. of 4-6 separate experiments. Each group consists of 6-8 rats.
a
p < 0.001,
b
p < 0.01,
c
P < 0.05 when compared to Control,
d
p < 0.001,
e
p < 0.01,
f
P < 0.05 when compared to 6-OHDA
group. C - Control, 6-OHDA - 6-OHDA infused, 6-OHDA +5-HT -
6-OHDA infused treated with Serotonin, 6-OHDA +GABA - 6-OHDA
infused treated with GABA, 6-OHDA +BMC- 6-OHDA infused treated
with BMC, 6-OHDA +5-HT+BMC- 6-OHDA infused treated with
Serotonin and BMC, 6-OHDA + GABA +BMC- 6-OHDA infused
treated with GABA and BMC, 6-OHDA +5-HT + GABA+ BMC-
6-OHDA infused treated with Serotonin, GABA and BMC.
0
200
400
600
800
1000
1200
Control 6OHDA 6OHDA + 5HT 6OHDA +
GABA
6OHDA +
BMC
6OHDA +
5HT+BMC
6OHDA +
GABA+BMC
6OHDA
+5HT+
G
ABA+BM
C
IP3
C
ontent
(
pmoles
/
mg protein
)
a
b
,
f
b
,f
a
c
,
e
c
,
d
Figure 3 Representative graph showing IP3 content in the
cerebral cortex of experimental rats. Values are Mean ± S.E.M. of
4-6 separate experiments. Each group consists of 6-8 rats.
a
p<
0.001,
b
p < 0.01,
c
P < 0.05 when compared to Control,
d
p<
0.001,
e
p < 0.01,
f
P < 0.05 when compared to 6-OHDA group.
C - Control, 6-OHDA - 6-OHDA infused, 6-OHDA +5-HT - 6-OHDA
infused treated with Serotonin, 6-OHDA +GABA - 6-OHDA infused
treated with GABA, 6-OHDA +BMC- 6-OHDA infused treated with
BMC, 6-OHDA +5-HT+BMC- 6-OHDA infused treated with Serotonin
and BMC, 6-OHDA + GABA +BMC- 6-OHDA infused treated with
GABA and BMC, 6-OHDA +5-HT + GABA+ BMC- 6-OHDA infused
treated with Serotonin, GABA and BMC.
0
50
100
150
200
250
300
Control 6OHDA 6OHDA + 5HT 6OHDA +
GABA
6OHDA +
BMC
6OHDA +
5HT+BMC
6OHDA +
GABA+BMC
6OHDA
+5HT+
G
ABA+BM
C
cAMP
C
ontent
(
pmoles
/
mg protein
)
a
b
,
f
b
,
f
a
c
,
e
c,e
d
Figure 4 Represe ntative graph showing cAMP co ntent i n the
cerebral cortex of experimental rats. Values are Mean ± S.E.M. of
4-6 separate experiments. Each group consists of 6-8 rats.
a
p<
0.001,
b
p < 0.01,
c
P < 0.05 when compared to Control,
d
p<
0.001,
e
p < 0.01,
f
P < 0.05 when compared to 6-OHDA group.
C - Control, 6-OHDA - 6-OHDA infused, 6-OHDA +5-HT - 6-OHDA
infused treated with Serotonin, 6-OHDA +GABA - 6-OHDA infused
treated with GABA, 6-OHDA +BMC- 6-OHDA infused treated with
BMC, 6-OHDA +5-HT+BMC- 6-OHDA infused treated with Serotonin
and BMC, 6-OHDA + GABA +BMC- 6-OHDA infused treated with
GABA and BMC, 6-OHDA +5-HT + GABA+ BMC- 6-OHDA infused
treated with Serotonin, GABA and BMC.
Nandhu et al. Journal of Biomedical Science 2011, 18:5
/>Page 5 of 10
compared to control. At the same time the expression of
the GLAST, ά-Synuclien and CREB showed a significant
(P<0.001)downregulationin6-OHDAinfusedrats
compared to control. Combinational treatment signifi-
cantly reversed these changes back to near control
(Table 4, 5).
Immunohistochemistry of mGLUR5 and NMDAR1 receptor
antibody staining
Immunohistochemical analysis confirmed the receptor
and gene expression data. mGLUR5 and NMDAR1
expression was significantly (P < 0.001) increased in the
6-OHDA infused rats compared to the control. Indivi-
dual treatment of BMC didn’t show any change. Combi-
national treatment significantly reversed the mean pixel
value near to the control. (Figure 5, 6; Table 6)
Discussion
PD is classically characterized as a disorder resulting
from the degeneration of dopaminergic neurons in the
pars compacta of the substantia nigra. However, glutama-
tergic pathways play a leading role in the structural and
functional organization of the cortico-basocortical loops
involved in PD [27]. Changes in personality and moder-
ate or mild cognitive debilitation are found in PD. Cere-
bral glucose metabolism is reduced in the cerebral cortex
in PD patients suffering from cognitive impairment [28].
Metabolic and neuroimagin g observations have recently
documented decreased prefrontal and parietal 18F-fluor-
odeoxyglycose uptake in PD cases with mild cognitive
deficits [29,30]. Recent observations have demonstrated
complex I deficiency [31], and abnormal ATP synthase
and inner protein membrane prohibitin expression levels
[32] in the frontal cortex in PD. S everal reports have
highlighted the need of dopamine- glutamate coactivation
for a number of cortical functions [33,34].
Table 2 Scatchard Analysis of Glutamate receptors using
[
3
H]Glutamate binding against glutamate in the Cerebral
cortex of experimental rats
Animal Status B
max
(fmoles/mg
protein)
K
d
(nM)
Control 1584.04 ± 14.12 146.39 ± 16.41
6-OHDA 3598.40 ± 35.88
a
138.58 ± 17.12
6-OHDA +5HT 1892.12 ± 18.41
b,f
131.24 ± 19.85
6-OHDA +GABA 1984.05 ± 24.25
b,f
128.12 ± 18.24
6-OHDA +BMC 3295.12 ± 29.12
a,f
145.15 ± 11.22
6-OHDA +5HT + BMC 1775.41 ± 13.65
b,e
125.13 ± 18.14
6-OHDA + GABA + BMC 1776.11 ± 14.21
b,e
124.22 ± 22.11
6-OHDA +5HT + GABA+ BMC 1711.51 ± 10.18
c,d
155.23 ± 15.26
Values are Mean ± S.E.M of 4-6 separate experiments. Each group consist 6-8 rats.
B
max
- Maximal binding; K
d
- Dissociation constant.
a
p < 0.001,
b
p < 0.01,
c
P < 0.05 when compared to Control.
d
p < 0.001,
e
p < 0.01,
f
P < 0.05 when compared to 6-OHDA group.
C - Control, 6-OHDA - 6-OHDA infused, 6-OHDA +5-HT - 6-OHDA infused
treated with Serotonin, 6-OHDA +GABA - 6-OHDA infused treated with GABA,
6-OHDA +BMC- 6-OHDA infused treated with BMC, 6-OHDA +5-HT+BMC-
6-OHDA infused treated with Serotonin and BMC, 6-OHDA + GABA +BMC-
6-OHDA infused treated with GABA and BMC, 6-OHDA +5-HT + GABA+ BMC-
6-OHDA infused treated with Serotonin, GABA and BMC.
Table 3 Scatchard Analysis of NMDA receptor using [
3
H]
MK-801 binding against MK-801 in the Cerebral cortex of
Control, 6-OHDA infused, 6-OHDA+5HT, 6-OHDA+GABA
and 6-OHDA+BMC treated rats
Animal Status B
max
(fmoles/mg protein) K
d
(nM)
Control 261.60 ± 11.05 0.63 ± 0.11
6-OHDA 754.88 ± 16.28
a
0.82 ± 0.18
6-OHDA + 5HT 619.28 ± 19.95
b,f
0.75 ± 0.12
6-OHDA + GABA 638.24 ± 20.48
b,f
0.77 ± 0.10
6-OHDA + BMC 669.92 ± 11.71
a,f
0.80 ± 0.09
6-OHDA +5HT + BMC 328.33 ± 26.87
c,e
0.72 ± 0.14
6-OHDA + GABA + BMC 344.96 ± 24.12
c,e
0.65 ± 0.10
6-OHDA +5HT + GABA+ BMC 274.04 ± 15.12
c,d
0.74 ± 0.08
Values are Mean ± S.E.M of 4-6 separate experiments. Each group consist 6-8 rats.
B
max
- Maximal binding; K
d
- Dissociation constant.
a
p < 0.001,
b
p < 0.01,
c
P < 0.05 when compared to Control,
d
p < 0.001,
e
p < 0.01,
f
P < 0.05 when compared to 6-OHDA group.
C - Control, 6-OHDA - 6-OHDA infused, 6-OHDA +5-HT - 6-OHDA infused treated
with Serotonin, 6-OHDA +GABA - 6-OHDA infused treated with GABA, 6-OHDA
+BMC- 6-OHDA infused treated with BMC, 6-OHDA +5-HT+BMC- 6-OHDA infused
treated with Serotonin and BMC, 6-OHDA + GABA +BMC- 6-OHDA infused
treated with GABA and BMC, 6-OHDA +5-HT + GABA+ BMC- 6-OHDA infused
treated with Serotonin, GABA and BMC.
Table 4 Real Time PCR amplification of mGluR5, NMDA2B
and GLAST mRNA in the Cerebral cortex of experimental
rats
Animal Status Log RQ
mGluR5 NMDA2B GLAST
Control 0 0 0
6-OHDA 3.55 ± 0.24
a
2.14 ± 0.12
a
-2.03 ± 0.11
a
6-OHDA +5HT 2.56 ± 0.12
b,f
1.65 ± 0.22
b,f
-1.71 ± 0.14
b,f
6-OHDA +GABA 2.64 ± 0.22
b,f
1.68 ± 0.19
b,f
-1.81 ± 0.08
b,f
6-OHDA +BMC 3.41 ± 0.24
a
2.10 ± 0.18
a
-2.00 ± 0.06
a
6-OHDA +5HT + BMC 1.52 ± 0.29
c,e
0.89 ± 0.15
c,e
-1.11 ± 0.19
c,e
6-OHDA + GABA + BMC 1.84 ± 0.19
c,e
0.92 ± 0.18
c,e
-1.13 ± 0.12
c,e
6-OHDA +5HT + GABA+
BMC
0.81 ± 0.10
d
0.41 ± 0.12
d
-0.32 ± 0.12
d
Values are Mean ± S.E.M of 4-6 separate experiments. Each group consist 6-8 rats.
a
p < 0.001,
b
p < 0.01,
c
P < 0.05 when compared to Control,
d
p < 0.001,
e
p < 0.01,
f
P < 0.05 when compared to 6-OHDA group.
C - Control, 6-OHDA - 6-OHDA infused, 6-OHDA +5-HT - 6-OHDA infused treated
with Serotonin, 6-OHDA +GABA - 6-OHDA infused treated with GABA, 6-OHDA
+BMC- 6-OHDA infused treated with BMC, 6-OHDA +5-HT+BMC- 6-OHDA infused
treated with Serotonin and BMC, 6-OHDA + GABA +BMC- 6-OHDA infused
treated with GABA and BMC, 6-OHDA +5-HT + GABA+ BMC- 6-OHDA infused
treated with Serotonin, GABA and BMC. The relative ratios of mRNA levels were
calculated using the ΔΔCT method normalized with b-actin CT value as the
internal control and Control CT-value as the calibrator.
Nandhu et al. Journal of Biomedical Science 2011, 18:5
/>Page 6 of 10
In the present study, we obtained decreased dopamine
content in the cerebral cortex region which resulted in
the increased expression of the glutamate activity.
Increased glutamate content in the 6-OHDA infused
rats leads to the up regulation of total glutamate and
NMDA receptors. This was confirmed by the gene
expression studies of mGluR5 and NMDA2B, where it
showed an upregulation in 6-OHDA infused rats com-
pared to control. The extracellular concentration of the
glutamate in the CNS must be k ept low to ensure a
high signal to noise ratio during synaptic acti vation and
to prevent excitotoxicity due to excessive activation of
glutamate receptors [35]. Glutamate uptake into neurons
and glial cells is important for the termination of gluta-
matergic transmission. They are essential for the main-
tenance of low extracellular levels of glutamate [36]. We
observed a reduced expression of GLAST in 6-OHDA
infused rats. The decreased glutamate transporter
GLAST expression reduces the reuptake of the extracel-
lular glutamate. Thus the results showed evidence for
the dysfunction of the cerebral cortex that is a reflection
for manifestation of abnormal behavioural patterns.
Table 5 Real Time PCR amplification of bax, ubiquitin carboxy-terminal hydrolase, a-Synuclien and CREB mRNA in the
Cerebral cortex of experimental rats
Animal Status Log RQ
bax ubiquitin
carboxy-terminal
hydrolase
a-Synuclien CREB
Control 0 0 0 0
6-OHDA 1.96 ± 0.18
a
0.99 ± 0.06
a
-3.12 ± 0.31
a
-2.91 ± 0.22
a
6-OHDA +5HT 1.02 ± 0.19
b,f
0.51 ± 0.05
b,f
-1.41 ± 0.29
b,e
-1.32 ± 0.13
b,f
6-OHDA +GABA 1.06 ± 0.11
b,f
0.50 ± 0.07
b,f
-1.55 ± 0.26
b,e
-1.43 ± 0.12
b,f
6-OHDA +BMC 1.79 ± 0.10
a
0.98 ± 0.04
a
-2.99 ± 0.24
a
-2.65 ± 0.21
a
6-OHDA +5HT + BMC 0.64 ± 0.10
c,e
0.23 ± 0.06
c,e
0.12 ± 0.09
d
-0.56 ± 0.08
c,e
6-OHDA + GABA + BMC 0.61 ± 0.07
c,e
0.26 ± 0.04
c,e
0.13 ± 0.12
d
-0.59 ± 0.09
c,e
6-OHDA +5HT + GABA+ BMC 0.29 ± 0.06
d
0.11 ± 0.02
d
0.41 ± 0.13
d
0.09 ± 0.03
d
Values are Mean ± S.E.M of 4-6 separate experiments. Each group consist 6-8 rats.
a
p < 0.001,
b
p < 0.01,
c
P < 0.05 when compared to Control,
d
p < 0.001,
e
p < 0.01,
f
P < 0.05 when compared to 6-OHDA group.
C - Control, 6-OHDA - 6-OHDA infused, 6-OHDA +5-HT - 6-OHDA infused treated with Serotonin, 6-OHDA +GABA - 6-OHDA infused treated with GABA, 6-OHDA
+BMC- 6-OHDA infused treated with BMC, 6-OHDA +5 -HT+BMC- 6-OHDA infused treated with Serotonin and BMC, 6-OHDA + GABA +BMC- 6-OHDA infused
treated with GABA and BMC, 6-OHDA +5-HT + GABA+ BMC- 6-OHDA infused treated with Serotonin, GABA and BMC. The relative ratios of mRNA levels were
calculated using the ΔΔCT method normalized with b-actin CT value as the internal control and Cont rol CT-value as the calibrator.
A B C D
E F G H
Figure 5 mGluR5 receptors expression in the cerebral cortex of
experimental rats using immunofluorescent mGluR5 receptor
specific primary antibody and FITC as secondary antibody.a-
Control, b - 6-OHDA infused, c- 6-OHDA infused treated with
Serotonin, d - 6-OHDA infused treated with GABA, e- 6-OHDA
infused treated with BMC, f- 6-OHDA infused treated with Serotonin
and BMC, g- 6-OHDA infused treated with GABA and BMC, h- 6-
OHDA infused treated with Serotonin, GABA and BMC. There was an
up regulation of mGluR5 receptors in the cerebral cortex of
experimental rats when compared to control rats. The scale bars
represent 75 μm.
A B C D
E F G H
Figure 6 NMDA2B receptors expression in the cerebral cortex
of experimental rats using immunofluorescent NMDA2B
receptor specific primary antibody and FITC as secondary
antibody. a - Control, b - 6-OHDA infused, c- 6-OHDA infused
treated with Serotonin, d - 6-OHDA infused treated with GABA, e- 6-
OHDA infused treated with BMC, f- 6-OHDA infused treated with
Serotonin and BMC, g- 6-OHDA infused treated with GABA and
BMC, h- 6-OHDA infused treated with Serotonin, GABA and BMC.
There was an increased expression of NMDA2B receptors in the
cerebral cortex of experimental rats when compared to control rats.
The scale bars represent 75 μm.
Nandhu et al. Journal of Biomedical Science 2011, 18:5
/>Page 7 of 10
All of glutamate receptors couple positively to phos-
pholipaseCviaguaninenucleotide binding proteins
(G-proteins) whereby they stimulate phosphoinositide
hydrolysis generating a second messenger cascade con-
sisting of dia cylglycerol and inositol 1,4,5 trisphosphate
[37]. Jo et al., [38] demonstrated that NMDA and mGluR
receptors mediate calcium release by stimu lating IP 3 and
PKC. b1-adrenoceptors are highly expressed in PD which
induced the up-regulation of cAMP/PKA signaling [ 39].
In our studies we observed an elevated cAMP and IP3
level in the cerebral cortex of 6-OHDA induced rats. The
elevated IP3 level causes extra cellular release of Ca
2+
,
which in turn enhanced metabolic stress on mitochon-
dria that leads to excessive oxidative phosphorylation and
increased production of reactive oxygen species. If the
matrix Ca
2+
level rises too high, then deleterious chang es
in mitochondrial structure may occur. In particular,
mitochondria can swell and rupture or undergo perme-
ability transition, thereby releasing several pro-apoptotic
factors into the cytoplasm, such as cytochrome C, second
mitochondrial activator of caspases (SMAC/Diablo) or
apoptosis-inducing factor (AIF) [40]. Our study showed
an increased activity of bax gene expression in the cere-
bral cortex of the 6-OHDA infused rats which indicated
the ROS mediated neurodegeneration in the cerebral cor-
tex. Bax, one of the major pro-apoptotic family members,
exerts its effects by compromising the membrane integ-
rity leading to leakage of apoptogenic factors such as
cytochrome c into the cytosol, resulting in caspase-3 acti-
vation and demise of the cell [41].
CREB is a transcription factor that plays an important role
in neuronal survival, in part by controlling the transcription
of neuroprotective genes [42]. The promoter regions of the
genes for brain-derived neurotrophic factor (BDNF) and the
pro-survival protein Bcl-2 contain cAMP response elements
(CREs) [43]. 6-OHDA administration causes a decrease in
transactivation of the CRE promotor, resulting in reduced
expression of downstream CREB-regulated genes [44]. In
the present study the gene expression of CREB was down
regulated in cerebral cortex of 6-OHDA compared to con-
trol. Even though cAMP level was increased, the CREB
expression was decreased. Enhanced activation of the gluta-
mate receptors leads to the production of second messen-
gers. But its acute and prolonged action triggers the cell
death pathways by activating pro apoptotic genes like bax,
bad and destabilizing jun- fos complex. The activation of
apoptotic path ways down regulates the CREB expressio n
thereby blocking the cAMP signaling cascade in PD rats.
Down regulation of CREB is a consequence of apoptotic
pathway activation a nd down regulation of muscarinic
receptor function. These findings suggest that decreased
CREB expression is the result of cell loss. BMC administra-
tion along with the 5-HT and GABA reduced the expression
of apoptotic factors l ike bax so that CREB expression in
these group reversed back to near control.
Normally an unstructured solubl e protein, alpha-
synuclein aggregates in the form of Lewy bodies and
Lewy neurites in the frontal cortex in PD [32,45]. High
concentrations of 6-OHDA results in neuronal death
accompanied by a decrease of the monomeric form of
alpha-synuclein, leading to both decreased synthesis of
the protein and its increased mono-ubiquitination
accompanied by nuclear translocation [46]. Studies by
Pierson et al., [47] showed an increased level of uncon-
jugated ubiquitin in the dorsal striatum of the dopamine
depleted hemisphere. Normal alpha-synuclein expression
is essential for the viability of primary neurons. Gene
expression studies of alpha-synuclein in the cerebral
cortex showed a significant down regulation in the
6-OHDA induced rats compared to control. This indi-
cates the r educed expression of normal alpha-synuclein
in the PD rats. Up regulation of ubiquitin carboxy-
terminal hydrolase gene expression in cerebral cortex
confirmed the increased level of unconjugated ubiquitin
in the 6 -OHDA induced rats. Combinational treatment
significantly reversed these changes back to control.
BMC, the non-hematopoietic precursor cells (i.e.
mesenchymal stem and progenitor cells) in bone mar-
row, off er an alternative source of cells for treatment of
neurodegenerative diseases and central nervous system
(CNS) injury. These cells normally differentiate into
bone, cartilage and adipose tissue [48], but can be
induced to differentiate into cells with surface mark ers
characteristic of neurons [49,50]. Autologous BMC to
treat neurological disorders offers several unique advan-
tages over other cell replacement therapies. For one,
Table 6 mGluR5 and NMDA2B expression in the Cerebral
cortex of the experimental rats
Animal Status Mean pixel value
mGluR5 NMDA2B
Control 23.25 ± 3.50 26 ± 3.1
6-OHDA 83.12 ± 3.23
a
60 ± 6.1
a
6-OHDA +5HT 67.12 ± 2.50
b,f
50 ± 5.9
b,f
6-OHDA +GABA 68.23 ± 3.05
b,f
52 ± 5.7
b,f
6-OHDA +BMC 79.33 ± 7.55
a
59 ± 5.1
a
6-OHDA +5HT + BMC 51.42 ± 5.93
c,e
40 ± 5.2
c,e
6-OHDA + GABA + BMC 53.77 ± 5.56
c,e
42 ± 4.4
c,e
6-OHDA +5HT + GABA+ BMC 35.69 ± 6.42
d
30 ± 1.1
d
Values are Mean ± S.E.M of 4-6 separate experiments. Each group consist 6-8 rats.
a
p < 0.001,
b
p < 0.01,
c
P < 0.05 when compared to Control,
d
p < 0.001,
e
p < 0.01,
f
P < 0.05 when compared to 6-OHDA group.
C - Control, 6-OHDA - 6-OHDA infused, 6-OHDA +5-HT - 6-OHDA infused treated
with Serotonin, 6-OHDA +GABA - 6-OHDA infused treated with GABA, 6-OHDA
+BMC- 6-OHDA infused treated with BMC, 6-OHDA +5-HT+BMC- 6-OHDA infused
treated with Serotonin and BMC, 6-OHDA + GABA +BMC- 6-OHDA infused
treated with GABA and BMC, 6-OHDA +5-HT + GABA+ BMC- 6-OHDA infused
treated with Serotonin, GABA and BMC.
Nandhu et al. Journal of Biomedical Science 2011, 18:5
/>Page 8 of 10
immunological reactions are avoided and it also
bypasses many of the ethical i ssues that surround the
use of embryonic cells. Recent study shows that post-
symptomatic treatment with granulocyte colony-
stimulating factor (G-CSF) in 1-methyl-4-phenyl-1,2,3,
6-tetrahydropyridine (MPTP) mouse model of PD rats
can p romote the regeneratio n of dopaminergic neurons
intheSNpcandrestorenigrostriatalfunction[51].
5-HT and GABA are involved in a variety of cellular
processes which includes neurogenesis, proliferation and
morphology [9-15]. Our study demonstrated that BMC
administration alone cannot reverse the above said
molecular changes occurring during PD. We found that
5-HT, GABA and BMC in combination potentiates a
restorative effect by reversing the alterations in gluta-
mate receptor binding and gene expression that occur
during Parkinson’s disease. Thus, it is evident that 5-HT
andGABAalongwithBMCto6-OHDAinfusedrats
renders protection against oxidative, related motor and
cognitive deficits which makes them clinically significant
for cell-based therapy.
Abbreviations
PD: Parkinson’s disease; BMC: Bone marrow cells; GABA: Gamma
aminobutyric acid; 5-HT: Serotonin; CREB: Cyclic AMP response element
binding prote in.
Acknowledgements
This work was supported by research grants from DBT, DST, ICMR, Govt. of
India and KSCSTE, Govt. of Kerala to Dr. C. S. Paulose.
Authors’ contributions
NMS and CSP designed research. NMS, JP, KPK, AM, and CR carried out the
experiments and drafted manuscript. All authors read and approved the final
manuscript.
Competing interests
The authors declare that they have no competing interest s.
Received: 27 September 2010 Accepted: 15 January 2011
Published: 15 January 2011
References
1. Smith Y, Villalba R: Striatal and extrastriatal dopamine in the basal
ganglia: an overview of its anatomical organization in normal and
parkinsonian brains. Mov Disord 2008, 23:S534-S547.
2. Djaldetti R, Lev N, Melamed E: Lesions outside the CNS in Parkinson’s
disease. Mov Disord 2009, 24:793-800.
3. Ferrer I: Early involvement of the cerebral cortex in Parkinson’s disease:
convergence of multiple metabolic defects. Prog Neurobiol 2009,
88(2):89-103.
4. Lefaucheur JP: Motor cortex dysfunction revealed by cortical excitability
studies in Parkinson’s disease: influence of antiparkinsonian treatment
and cortical stimulation. Clin Neurophysiol 2005, 116(2):244-53.
5. Millan MJ: From the cell to the clinic: A comparative reviewof the partial
D2/D3 receptor agonist and α2-adrenoceptor antagonist, piribedil, in
the treatment of Parkinson’s disease. Pharmacology & Therapeutics 2010,
128:229-73.
6. Alexi T, Borlongan CV, Faull RL, Williams CE, Clark RG, Gluckman PD,
Hughes PE: Neuroprotective strategies for basal ganglia degeneration:
Parkinson’s and Huntington’s diseases. Prog Neurobiol 2000, 60(5):409-70.
7. Riedel G, Platt B, Micheau J: Glutamate receptor function in learning and
memory. Behav Brain Res 2003, 140:1-47.
8. Rao VL, Bowen KK, Dempsey RJ: Transient focal cerebral ischemia down-
regulates glutamate transporters GLT-1 and EAAC1 expression in rat
brain. Neurochem Res 2001, 26:497-502.
9. Kligman D, Marshak DR: Purification and characterization of a neurite
extension factor from bovine brain. Proc Natl Acad Sci USA 1985,
82:7136-7139.
10. Lauder JM, Krebs H: Serotonin as a differentiation signal in early
neurogenesis. Dev Neurosci 1978, 1:15-30.
11. Hernandez Rodriguez J: Serotonin as a neurotrophic factor in the fetal
brain: Binding, capture and release in centers of axonal growth. Gac Med
Mex 1994, 130:246-252.
12. Behar TN, Schaffner AE, Scott CA, Green CL, Barker JL: GABA receptor
antagonist modulate postmitotic cell migration in slice culture of
embryonic rat cortex. Cereb Cortex 2000, 10
:899-909.
13.
Haydar TF, Wang F, Schwartz ML, Rakic P: Differential modulation of
proliferation in the neocortical venrticular and subventricular zone. J
Neurosci 2000, 20(15):5764-5774.
14. Behar TN, Li Y, Tarn HT, Ma W, Dunlap V, Scott C, Barker JL: GABA
stimulates chemotaxis and chemokinesis of embryonic cortical neurons
via calcium dependent mechanism. J Neurosci 1996, 16(5):1808-1818.
15. Ben-Yaakov G, Golan H: Cell proliferation in response to GABA in
postnatal hippocampal slice culture. Int J Dev Neurosci 2003, 21(3):153-7.
16. Sudha B, Paulose CS: Induction of DNA synthesis in primary culture of rat
hepatocyte by serotonin: possible involvement of serotonin S2 receptor.
Hepatology 1998, 27:62-66.
17. Biju MP, Pyroja S, Rajesh KNV, Paulose CS: Hepatic GABA
A
receptor functional
regulation during liver cell proliferation. Hepatol Res 2001, 21:136-146.
18. Ungerstedt U: Postsynaptic supersensitivity after 6-hydroxydopamine
induced degeneration of the nigro-striatal dopamine system. Acta Physiol
Scand Suppl 1971, 367:95-122.
19. Glowinski J, Iversen LL: Regional studies of catecholamines in the rat
brain: The disposition of [
3
H] norepinephrine, [
3
H] dopamine and [
3
H]
dopa in various regions of the brain. J Neurochem 1966, 13:655-669.
20. Paulose CS, Dakshinamurti K, Packer S, Stephens NL: Sympathetic
stimulation and hypertension in pyridoxine deficint adult rat.
Hypertension 1988, 11:387-391.
21. Enna SJ, Snyder SH: A simple, sensitive and specific radioreceptor assay
for endogenous GABA in brain tissue. J Neurochem 1976, 26:221-224.
22. Timothy JG, Young AB, Penny JB: Quantitative autoradiographic
distribution of [
3
H] glutamate binding sites in the rat central nervous
system. J Neurosci 1984, 4:2133-2144.
23. Hoffman DJ, Zanelli SA, Kubin JM, Om P, Delivoria PM: The in vivo effect of
bilirubin on the N-methyl-D-aspartate receptor/ion channel complex in
the brains of newborn piglets. Pediatr Res 1996, 40:804-808.
24. Lowry OH, Rosenbrough NH, Farr AL, Randall RJ: Protein measurement
with folin Phenol reagent. J Biol Chem 1951, 193:265-75.
25. Scatchard G: The attractions of proteins for small molecules and ions.
Ann New York Ac Sci 1949, 51(4):660-672.
26. Chen S, Kobayashi M, Honda Y, Kakuta S, Sato F, Kishi K: Preferential
neuron loss in rat piriform cortex following pilocarpine induced status
epilepticus. Epilepsy Res 2007, 74:1-18.
27. Hirsch EC, Perier C, Orieux G, Francois C, Feger J, Yelnik J, Vila M, Levy R,
Tolosa ES, Marin C, Trinidad Herrero M, Obeso JA, Agid Y: Metabolic effects of
nigrostriatal denervation in basal ganglia. Trends Neurosci 2000, 23:S78-85.
28. Yong SW, Yoon JK, An YS, Lee PH: A comparison of cerebral glucose
metabolism in Parkinson’s disease. Parkinson’s disease dementia and
dementia with Lewy bodies. Eur J Neurol 2007, 14 :1357-1362.
29. Huang C, Tang C, Feigin A, Lesser M, Ma Y, Pourfar M, Dhawan V,
Eidelberg D: Changes in network activity with the progression of
Parkinson’s disease. Brain 2007, 130:1834-1846.
30. Huang C, Mattis P, Perrine K, Brown N, Dhawan V, Eidelberg D: Metabolic
abnormalities associated with mild cognitive impairment in Parkinson
disease. Neurology 2008, 70:1470-1477.
31. Parker WD, Parks JK, Swerdlow RH: Complex I deficiency in Parkinson’s
disease frontal cortex. Brain Res 2008, 1189:215-218.
32. Ferrer I, Perez E, Dalfó E, Barrachina M: Abnormal levels of prohibitin and
ATP synthase in the substantia nigra and frontal cortex in Parkinson’s
disease. Neurosci Lett 2007, 415(3):205-9.
33. Gurden H, Tassin JP, Jay TM: Integrity of the mesocortical dopaminergic
system is necessary for complete expression of in vivo hippocampal-
prefrontal cortex long-term potentiation. Neuroscience 1999, 94:1019-1027.
Nandhu et al. Journal of Biomedical Science 2011, 18:5
/>Page 9 of 10
34. Baldwin AE, Sadeghian K, Kelley AE: Appetitive instrumental learning
requires coincident activation of NMDA and dopamine D1 receptors
within the medial prefrontal cortex. J Neurosci 2002, 22:1063-1071.
35. Katagiri H, Tanaka K, Manabe T: Requirement of appropriate glutamate
concentrations in the synaptic cleft for hippocampal LTP induction. Eur J
Neurosci 2001, 14:547-553.
36. López-Bayghen E, Aguirre A, Ortega A: Transcriptional regulation through
glutamate receptors: Involvement of tyrosine kinases. J Neurosci Res 2003,
74(5):717-25.
37. Berridge MJ: Inositol trisphosphate and diacylglycerol: two interacting
second messengers. Annu Rev Biochem 1987, 56:159-193.
38. Jo J, Heon S, Kim MJ, Son GH, Park Y, Henley JM, Weiss JL, Sheng M,
Collingridge GL, Cho K: Metabotropic glutamate receptor-mediated LTD
involves two interacting Ca(
2+
) sensors, NCS-1 and PICK1. Neuron 2008,
60:1095-1111.
39. Hara M, Fukui R, Hieda E, Kuroiwa M, Bateup HS, Kano T, Greengard P,
Nishi A: Role of adrenoceptors in the regulation of dopamine/DARPP-32
signaling in neostriatal neurons. J Neurochem 2010, 113(4):1046-59.
40. Orrenius S, Zhivotovsky B, Nicotera P: Regulation of cell death: the
calcium-apoptosis link. Nat Rev Mol Cell Biol 2003, 4:552-565.
41. Shacka JJ, Roth KA: Regulation of neuronal cell death and
neurodegeneration by members of the bcl-2 family: therapeutic
implications. Curr Drug Targets CNS Neurol Disord 2005, 4 :25-39.
42. Finkbeiner S: CREB couples neurotrophin signals to survival messages.
Neuron 2000, 25:11-14.
43. Mayr B, Montminy M: Transcriptional regulation by the phosphorylation-
dependent factor CREB. Nat Rev Mol Cell Biol 2001, 2:599-609.
44. Chalovich EM, Zhu JH, Caltagarone J, Bowser R, Chu CT: Functional
repression of cAMP response element in 6-hydroxydopamine-treated
neuronal cells. J Biol Chem 2006, 281(26):17870-81.
45. Arima K, Uéda K, Sunohara N, Hirai S, Izumiyama Y, Tonozuka-Uehara H,
Kawai M: Immunoelectron-microscopic demonstration of NACP/alpha-
synuclein-epitopes on the filamentous component of Lewy bodies in
Parkinson’s disease and in dementia with Lewy bodies. Brain Res 1998,
808(1):93-100.
46. Monti B, Polazzi E, Batti L, Crochemore C, Virgili M, Contestabile A: Alpha-
synuclein protects cerebellar granule neurons against 6-
hydroxydopamine-induced death. J Neurochem 2007, 103(2):518-30.
47. Johan P, Per S, Richard MC, Per EA: Increased Levels of Ubiquitin in the 6-
OHDA-Lesioned Striatum of Rats. J Proteome Res 2005, 4(2):223-226.
48. Pittenger MF, Mackay AM, Beck SC, Jaiswal RK, Douglas R, Mosca JD,
Moorman MA, Simonetti DW, Craig S, Marshak DR: Multilineage potential
of adult human mesenchymal stem cells. Science 1999, 284:143-147.
49. Sanchez-Ramos J, Song S, Cardozo-Pelaez F, Hazzi C, Stedeford T, Willing A,
Freeman TB, Saporta S, Janssen W, Patel N, Cooper DR, Sanberg PR: Adult
bone marrow stromal cells differentiate into neural cells in vitro. Exp
Neurol 2000, 164:247-256.
50. Woodbury D, Schwarz EJ, Prockop DJ, Black IB: Adult rat and human bone
marrow stromal cells differentiate into neurons. J Neurosci Res 2000,
61:364-370.
51. McCollum M, Ma Z, Cohen E, Leon R, Tao R, Wu JY, Maharaj D, Wei J: Post-
MPTP treatment with granulocyte colony-stimulating factor improves
nigrostriatal function in the mouse model of Parkinson’s disease.
Mol
Neurobiol 2010, 41(2-3):410-9.
doi:10.1186/1423-0127-18-5
Cite this article as: Nandhu et al.: Enhanced glutamate, IP3 and cAMP
activity in the cerebral cortex of Unilateral 6-hydroxydopamine induced
Parkinson’s rats: Effect of 5-HT, GABA and bone marrow cell
supplementation. Journal of Biomedical Science 2011 18:5.
Submit your next manuscript to BioMed Central
and take full advantage of:
• Convenient online submission
• Thorough peer review
• No space constraints or color figure charges
• Immediate publication on acceptance
• Inclusion in PubMed, CAS, Scopus and Google Scholar
• Research which is freely available for redistribution
Submit your manuscript at
www.biomedcentral.com/submit
Nandhu et al. Journal of Biomedical Science 2011, 18:5
/>Page 10 of 10