Báo cáo y học: "Molecular profile and copy number analysis of sporadic colorectal cancer in Taiwan" potx
Bạn đang xem bản rút gọn của tài liệu. Xem và tải ngay bản đầy đủ của tài liệu tại đây (1.28 MB, 11 trang )
RESEARCH Open Access
Molecular profile and copy number analysis of
sporadic colorectal cancer in Taiwan
Chien-Hsing Lin
1†
, Jen-Kou Lin
2†
, Shih-Ching Chang
2†
, Ya-Hui Chang
1
, Hwey-May Chang
2
, Jin-Hwang Liu
3
,
Ling-Hui Li
4
, Yuan-Tsong Chen
4
, Shih-Feng Tsai
1,5
and Wei-Shone Chen
2*
Abstract
Background: Colorectal cancer (CRC) is a major health concern worldwide, and recently becomes the most
common cancer in Asia. The case collection of this study is one of the largest sets of CRC in Asia, and serves as
representative data for investigating genomic differences between ethnic populations. We took compre hensive and
high-resolution approaches to compare the clinicopathologic and genomic profiles of microsatellite instability (MSI)
vs. microsatellite stability (MSS) in Taiwanese sporadic CRCs.
Methods: 1,173 CRC tumors were collected from the Taiwan population, and sequencing-based microsatellite typing
assay was used to determine MSI and MSS. Genome-wide SNP array was used to detect CN alterations in 16 MSI-H
and 13 MSS CRCs and CN variations in 424 general con trols. Gene expression array was used to evaluate the effects
of CN alterations, and quantitative PCR methods were used to replicate the findings in independent clinical samples.
Results: These 1,173 CRC tumors can be classified into 75 high-frequency MSI (MSI-H) (6.4%), 96 low-frequency MSI
(8.2%) and 1,002 MSS (85.4%). Of the 75 MSI-H tumors, 22 had a BRAF mutation and 51 showed MLH1 promoter
hypermethylation. There were distinctive differences in the extent of CN alterations between CRC MSS and MSI-H
subtypes (300 Mb vs. 42 Mb per genome, p-value < 0.001). Also, chr7, 8q, 13 and 20 gains, and 8p and 18 losses
were frequently found in MSS but not in MSI-H. Nearly a quarter of CN alterations were smaller than 100 kb, which
might have been missed in previous studies due to low-resolution technology. 514 expressed genes showed CN
differences between subtypes, and 271 of them (52%) were differentially expressed.
Conclusions: Sporadic CRCs with MSI-H displayed distinguishable clinicopathologic feature s, which differ from those
of MSS. Genomic profiling of the two types of sporadic CRCs revealed significant differences in the extent and
distribution of CN alterations in the cancer genome. More than half of expressed genes showing CN differences can
directly contribute to their expressional diversities, and the biological functions of the genes associated with CN
changes in sporadic CRCs warrant further investigation to establish their possible clinical implications.
Background
Colorectal cancer (CRC) is one of the major leading
causes of cancer deaths around the w orld, and is the
most common cancer in Taiwan [1]. Two different
genetic pathways have been described for tumorigenesis
of CRC. The most frequent pathway is the chromosomal
instability pathway characterized by alterations in tumor
suppressor g enes and oncogenes, including APC, TP53
and K-ras [2,3]. On the other hand, 10-15% of all cases
of CRC show microsatellite instability (MSI), which are
resulted from a germline mutation in the mismatch
repair (MMR) system or somatic hypermethylation of
the promoter region of the MLH1 gene [4]. Tumors
with MM R deficiency exhibited frequent errors in
microsatellite DNA, short segments of DNA containing
tandem repeats of mono-, di- or trinucleotides [5]. The
high-frequency MSI (MSI-H) CRCs have unique clinico-
pathologic features, such as r ight-sided, mucinous or
poorly differentiated, and stable chromosomal status in
the tumors [6].
About 80% of MSI tumors have a near-diploid karyo-
type and a distinct genetic alteration distinguishable from
those of microsatellite stable (MSS) cancers [7-10].
* Correspondence:
† Contributed equally
2
Division of Colon and Rectal Surgery, Department of Surgery, Taipei
Veterans General Hospital, Taipei, Taiwan
Full list of author information is available at the end of the article
Lin et al. Journal of Biomedical Science 2011, 18:36
/>© 2011 Lin et al; licensee BioMed Central Ltd. This is an Open Access article distributed under the terms of the Creative Commons
Attribution License (http://c reativecommons.or g/license s/by/2.0), which permits unrestricted use, distribution, and reproduction in
any medium, provided the original work is properly cited.
Despite the advancement of our understanding of cancer
genetics of CRC, genomi c alterations of various subtypes
of CRC have not been fully characterized. The copy num-
ber variations (CNVs) can contribute to variable levels of
gene expressions [11], and th us fine-scale copy number
(CN) profiling of cancer can enhance our knowledge
about tumorigenesis. Among all somatic mutations, non-
germline CNVs found in the cancer genomes, also
known as copy number alterations/aberrations (CNAs),
are frequently observed, e.g., gains of oncogenes and
losses of tumor suppresser genes [12]. Furthermore, the
DNA CN states of CRC cases are relate d to the response
of drug treatments, e.g., the CNA degree of CRC is asso-
ciated with response to systemic combination che-
motherapy with capecitabine and irinotecan [13].
Previous cytogenetic studies have shown MSS tumors
are characterized with more chromosomal and copy
number aberrations than MSI tumors [14,15], and most
of MSI tumors have a near-diploid karyotype and appear
to follow a genetic pathway distinct from MSS tumors
[9]. These studies showed that gain of chromosome 7,
8q, 13 and 20q and loss of chromosome 4q, 8p, 17p and
18q were frequent in CRC MSS tumors [16]. Both pro-
files of genome-wide CNA and gene expression have
been used to classify MSS and MSI subtypes of CRC
samples [17]. However, previous genome- wide CNA stu-
dies of CRC were limited by the resolution of compara-
tive genomic hybridization (CGH) array technology
(probe distance > 30 kb), thereby subtle CN changes har-
boring cancer-causing variants might be missed
[13,17,18]. As genomic technology advances, high-density
single -nucleotide polymorphism (SNP) array can be used
to genotype a huge number of SNPs and detect CN
changes on the genomic scale. In the current study, we
have applied Affymetrix SNP 6 .0 array ( Affymetrix, CA,
USA), with its median inter-probe distance of less than
700 bp, to detect CNAs in CRC cancer genome of clinical
samples. As c ompared to other reports on the CRC can-
cer genome using the CGH arrays, we have achieved a
much improved resolution. Molecular karyotype profiling
of the two subtypes of sporadic CRCs revealed significant
differences in the extent and distr ibution of CN altera-
tions in the cancer genome. Combining the data of gen-
ome-wide CNAs and Illumina Human Ref-8 gene
expression array (Illumina, CA, USA), CNAs might sig-
nificantly contribute to the expressional levels of genes,
more than half of which were differently expressed
between CRC MSI-H and MSS.
Materials and methods
Clinical patients and tumor tissues
A total of 1,543 colorectal cancer patients who under-
went surgeries in Taipei Veterans General Hospital from
January 2000 to December 2007 were included. The
study was approved by the Institutional Review Board of
the Taipei Veterans General Hospital, and written
informed consent for tissue collection was obtained from
all patients. Patient with preoperative chemoradiother-
apy, or emergent operative procedure, or death within
30 postoperative days, or e vidence of familial adenoma-
tous polyposis were excluded from this study. Clinical
information was rec orded prospectively and stored in a
database. This included: (i) age, sex, personal and family
history, and (ii) tumor size, location, gross appearance,
TNM stage, differentiation and pathological prognost ic
features. Tumors were meticulously dissected, with sam-
ples collected from the 4 tumor quadrants to explore
intratumoral heterogeneity. The corresponding normal
mucosa, at least 10 cm away from the primary tumor
edge, was collected. Tissue fragments were immediately
frozen in liquid nitrogen and stored at -70°C. Sections of
cancerous and collateral tissues were reviewed and ana-
lyzed by a senior gastrointestinal pathologist blinded to
patient outcomes. Disease stage was determined with the
TNM classification of the International Union Against
Cancer [19]. The pathological factors analyzed included
lymphovascular invasion, invasive tumor pattern, grade
of differentiation, mucin production and intratumoral
lymphocyte infiltration. These pathological features were
defined by the College of American Pathologists consen-
sus statement [20].
Microsatellite Instability Analysis
High-molecular-weight genomic DNA from each tumor
and from corresponding normal tissue was purified using
the QIAamp Tissue kit (QIAGEN GmbH, Germany).
Yield and purity were determined by electrophoresis on
0.8% agarose gel and spectro photometric absorbance at
260 nm. According to international criteria for determi-
nation of MSI,
5
five reference microsatellite markers
were used: D5S345, D2S123, BAT25, BAT26,and
D17S250. Primer sequences were obtained from Gen-
Bank (). Detection of MSI was per-
formed as previously described [20,21]. Briefly, DNA was
amplified using fluorescent polymerase chain reaction
(PCR). PCR products were denatured and a nalyzed by
electrophoresis on 5% denaturing polyacrylamide gels,
and results were analyzed using GeneScan Analysis soft-
ware (Applied Biosystems, CA, USA). Tumor samples
that exhibited allele peaks different from the correspond-
ing normal sample (s) were classified as MSI for that par-
ticular marker. Samples with ≥ 2 MSI of 5 markers were
defined as MSI-H, those with only one MSI of 5 markers
were defined as low-f requency MSI (MSI-L) and others
without evidence of MSI were classified as MSS. Analyses
were performed twice if results were ambiguous.
Lin et al. Journal of Biomedical Science 2011, 18:36
/>Page 2 of 11
Immunohistochemistry
Immunohistochemistry (IHC) staining for MLH1,
MSH2, MSH6 and PMS2 were done for cases with MSI-
H. Paraffin-embedded tissue sections (4 μmthickness)
were stained with antibodies for MLH1 (1:10 dilution,
Pharmingen), MSH2 (1:200, Oncogene Research Pro-
ducts), MSH6 (1:300, Transduction Laboratories) and
PMS2 (C20) (1:400, Santa Cruz Biotechnology). Negative
control slides were made without the primary antibody.
BRAF mutation and MLH1 methylation analysis
To detect BRAF mutation, DNA from tumor tissue was
amplified and sequenced with primers described in pre-
vious studies [22]. Briefly, the extracted DNA was selec-
tively amplified by PCR in a DNA thermocycler. A
negative control containing no DNA template was
included for each PCR amplification round. The PCR
products were analyzed by an automated sequencer
(ABI Prism 3100 Genetic Analyzer; Applied Biosystems).
Each sample was sequenced on both sense and antisense
strands. Each mutation was confirmed by a second
sequencing procedure on new PCR products. Methyla-
tion of the MLH1 promoter was determined using a
methylation-specific PCR method. DNA was treated
with sodium bisulfite, which converts unmethylated
cytosine to uracil, yet leaves methylated cytosine
unchanged, and subjected to amplification with methy-
lated- and u nmethylated-specific primers, respectively
[23].
Flow Cytometry for DNA Ploidy
703 of 1,173 tumors were available to examine the status
of DNA ploidy using flow cytometry by following the
method of Dressler et al.[24].TheDNAindex(DI),
representing the ratio of the mean fluorescence intensity
of the G
0
G
1
peak of the tumor cell population to that of
the normal diploid population, was used to quantitate
DNA ploidy. Specimens were considered diploid (DI = 1)
if they had a single G
0
G
1
peak and aneuploid (DI ≠ 1) if
they exhibited two or more discrete peaks, including
abnormal G
0
G
1
peaks (each peak equival ent to the fluor-
escence of at least 20% of the total sample nuclei) and a
corresponding G
2
M peak. Samples with coefficients of
variation > 8% were excluded from further ana lysis [21].
Tumors with both diplo id and aneuploid subpopulations
were classified as having DNA aneuploidy. The mean
coefficients of varia tion were 6.4% and 2.4% in tumor tis-
sues and normal colon mucosa, respectively.
High-density SNP array and data analysis
A total of 500 ng of genomic DNA of 16 MSI-H and 13
MSS CRC samples was subjected to SNP genotyping
using genome-wide Affymetrix Human SNP 6.0 array
according to the manufacturer’s instructions. Genotyping
was performed by the National Genotyping Center at
Academia Sinica, Taipei, Taiwan (http: //ngc.sinica.edu.
tw). This array contains 1.8 millions markers widely dis-
tributing in human genome. After standard Affymetrix
quantile normalization, the intensity data was analyzed
using Genotyping Console (GTC) software v.3.0.1 (Affy-
metrix) with default parameters of hidden-Markov model
(HMM) to identify CN-changed regions [25]. PennCNV
[26] and P artek Genome Suite (Partek Inc., MO, USA)
software were additionally used to reconfirm CN altera-
tions identified b y GTC software. CNA predicted b y
PennCNV and Partek software with default HMM para-
meters are 91.6% and 89.8% concordant with those of
GTC software. In consideration of CN-changed regions
with at least 20 consecutive probes, we found t hat all
these CNA identified are 100% overlapped with those
def ined by either PennCNV or Partek software, implyi ng
these CNAs were highly reliable for the following
analysis.
Quantitative genomic PCR
CN changes of selected genes, including epidermal growth
factor receptor (EGFR), deleted colon cancer (DCC)and
calcium-dependent membrane-binding protein 1
(CPNE1), were verified by using quantitative genomic PCR
experiments. Primer Express Software version 3.0 (Applied
Biosystems) was applied to design PCR primers for the
selected target genes. Quantitative genomic PCR were per-
formed using the ABI StepOne Plus system (Applied Bio-
systems). PCR reactions were prepared using the Power
SYBR-Green PCR reagent kit (Applied Biosystems), and
2.5 ng genomic DNA was used in each reaction. qPCR
conditions were as follows: initial denaturation at 94°C for
3 minut es, followed by 40 cycles of denaturati on at 94°C
for 15 seconds, and combined annealing and extension at
60°C for 60 seconds. The fluorescence signal was detected
in real time during the qPCR procedure. The primer pair
for the long interspersed nuclear elements 1 sequence was
used for normalization. The mean estimated CN was cal-
culated from triplicate PCR reactions for each individual.
Whole-genome gene expression analysis
RNA samples of 16 MSI-H and 13 MSS tumors (identical
cases as used in SNP array analy sis) were prepared using
Qiagen’s RNAeasy kit (Qiagen), and then were assayed
using the Agilent Systems Bioanalyzer (Agilent Technol-
ogies, CA, USA) to ensure that high-quality RNA was
used for the gene expression array experiments. The Illu-
mina TotalPrep RNA amplification kit (Ambion, TX,
USA) was used to amplify and generate biotinylated
RNA. Illumina Human Ref-8 V3 arrays were processed
and scanned at medium PMT settings as recommended
by the manufacturer, and were analyzed using GenomeS-
tudio software (Illumina) . After subtracting background,
Lin et al. Journal of Biomedical Science 2011, 18:36
/>Page 3 of 11
array data was normalized using the quantile method,
and detection p-value < 0.01 was used to ensure that only
expressed genes were used in the following analyses.
Statistical analysis
All results in the text and tables are given as means ± stan-
dard deviation. In clinical analyses, categorical variables
were analyzed using a chi-squ are test with Yates’ correc-
tion, and comparisons of quantitative variables between
groups were performed based on Student’s t-test. In geno-
mic data analysis, CNA frequency comparisons between
CRC MSS and MSI-H subtypes were carried out by using
Fisher’s exact test, and t-test was applied in comparing
expressional levels of each transcript between CRC sub-
types. SAS/STAT (SAS Institute, NC, USA) program was
used to carry out all statistical analyses.
Results
A total of 1,543 CRCs were recruited in Taiwan popula-
tion from 2000 to 2007 as shown in Figure 1. To focus on
sporadic CRC cases for the clinicopathologic and genomic
analyses, 370 (24.0%) meeting the Revised Bethesda cri-
teria [27], defined patients having CRC familiar history,
were excluded, and the remaining 1,173 patients were
sporadic CRC cases. There were 785 (66.9%) males and
388 (33.1%) females in these sporadic CRC patients.
Tumors were found in r ight-side colon in 294 patients
(25.1%), left-side colon in 478 patients (40.8%), and in the
rectum in 401 patients (34.2%). There were 159 patients
(13.6%) with stage I cancers, 395 patients (33.7%) with
stage II cancers, 407 patients (34.7%) with stage III cancers
and 212 patients (18.1%) with stage IV cancers. Based on
microsatellite instability analysis, among the 1,173 tumors
analyzed, 75 (6.4%) were MSI-H, 96 (8.2%) were MSI-L,
and 1,002 (85.4%) were MSS. Int erestingly, 48 out of the
75 MSI-H tumors (64%) were located in the right colon;
67% had stage I or II disease; 60% were female and 24%
were poorly or mucinous differentiated (Table 1). In con-
trast to the clinopathologic features of MSI-H tumors,
MSS/MSI-L showed left sided predominant, less mucinous
or poorly differentiation and more advanced disease.
Methylation of the MLH1 gene promoter and BRAF
gene mutations were a nalyzed for all MSI-H tumors. Of
the 75 MSI-H tumors, 22 (29.3%) had a BRAF mutation
and 51 (68%) showed hypermethylation of the MLH1 gene
promoter. Immunohistochemical (IHC) stains for MLH1,
MSH2, MSH6 and PMS2 proteins were carried out for 70
cases with MSI-H tumors whose samples were available
(Figure 2). As shown in Figure 1, 47 of 70 (67.1%) MSI-H
tumors showed abnormalities with IHC analysis for at
least one MMR protein. The majority (n = 40, 57.1%) lost
MLH1 protein expression, followed by MSH2 protein (n =
8, 11.4%). Among the 40 tumors with no detectable
MLH1 protein expression, 32 had hypermethylation of the
promoter (80%) and 17 had BRAF mutation (42.5%). Five
MSI-H tumors had no expression of either MSH6 or
PMS2 protein, and 23 cases (32.9%) had detectable expres-
sions of all four MMR proteins (Figure 1).
Of the 703 tumors, including 51 MSI-H and 652 MSI-L/
MSS, available for the status of DNA ploidy, 231 showed
DNA diploid (32.9%). We found that 70.2% of MSI-L/MSS
tumors showed DNA aneuploidy, but only 27.5% of MSI-
H tumors showed DNA aneuploidy. To molecularly char-
acterize chromosomal aberrations at a high resolution (≤
20 kb) and compare the genomic features between the
MSI-H and MSS subtypes, Affymetrix SNP 6.0 array was
applied to detect genome-wide CNAs in 16 MSI-H tumors
with both MLH1 hypermethylation and BRAF mutation,
andcomparedtothegenomicprofilesof13MSSCRC
tumors. To identify reliable CN changes, we only included
CN-changed regions covering more than 20 probes, and
these CNAs were also called by PennCNV and Partek
CNV calling software (algorithm-independent). As a con-
trol, the CNV profile of Taiwanese population was based
on 434 general controls from Han Chinese Cell and Gen-
ome Bank that were genotyped using Affymetrix SNP 6
array [28]. This data provides useful information, at the
population scale, the common variation of genomic struc-
ture in the Taiwanese study subjects. A total of 399 CNV
regions were identified in this population (Dr. Y T. Chen,
unpublished data), the average size of the CNV regions
was 350 kb (covering a total of 4.66% of the human gen-
ome), and 372 (93.23%) were reported in the database of
genomic variants ( As
shown in Figure 3, the whole-genome CNV patterns of
the two CRC subtypes were grossly different. DNA CN
gain in chr7, 8q, 13 and 20 and loss in chr4q, 8p and 18
were frequently found in MSS but not in MSI-H tumors.
Consisting with previous studies, the chromosomal struc-
tures of CRCs with microsatellite instability were similar
to those of normal controls [9] (Figure 3). There were dis-
tinctive differences in the number of CNAs between CRC
MSS and MSI-H subtypes (Figure 4a, 439 vs. 63 per gen-
ome, p-value = 0.0005), and the average size of CNAs per
genome of MSS tumor was larger than that of MSI-H
tumor (Figure 4b, 300 Mb vs. 42 Mb, p-value = 0.001).
ThemajorityofCNAs(>80%)foundinCRCcases
was smaller than 500 kb, and nearly a quarter of CN
alterations were smaller than 100 kb, which might have
been missed in the previous studies due to low-resolu-
tion technologies (Additional File 1). Therefore, CNA
frequencies of some DNA segments in this study were
higher than those from previous studies (14). 13,279
protein-coding genes and 557 microR NA were affect ed
by CN changes in these CRC samples, of which 1,434
genes (10.8%) and 35 microRNAs (6.3%) were related to
CNVs observed in the general Taiwanese population. To
identify genes harboring the CRC subtype-common and/
Lin et al. Journal of Biomedical Science 2011, 18:36
/>Page 4 of 11
or specific CN changes, the gene-based CNA frequency
of MSS and MSI-H subtypes were compared as shown
in Figure 5a. 1,515 of 13,279 genes (11.4%) were found
to have CN frequency difference between MSS and
MSI-H tumors using Fisher’s exact tests (p-value < 0.05,
Additional File 2), and CNA frequencies of these genes
in MSS tumors were all higher than those in MSI-H
tumors.
The CN gain of EGFR gene, a well-known cancer gene
and drug target, was commonly found in CRC MSS
tumors (8 out o f 13 samples, 62%) according to gen-
ome-wide CNA analysis. To replicate the findings from
theSNParrayanalysis,weapplied qPCR approach to
evaluate the EGFR CN states of independen t 48 CRC
MSS and 48 MSI-H samples (Additional File 3). The
CN gain frequency of the independent CRC MSS group
was 64.6% (31 of 48) and consisted to that (62%) of the
array-based CN analysis, and w as higher than overall
14% of CRC MSI-H subtype ( n = 64). Furthermore,
although CN losses of DCC gene were commonly found
in CR Cs in previous studies [29], we observed that this
DCC deletions were frequently found in MSS CRCs
(46%) but not in MSI-H (0%). Twelve cancer-associated
genes were found to show different CN frequencies
between CRC subtypes as shown in Table 2 (Fisher’s
exact test, p-value < 0.01), but the biological functions
of many identified genes with high CNA frequencies
were not fully characterized.
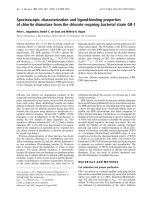
Figure 1 Flowchart of gen omic study on sporadic CRCs. Five reference microsatellite markers are used to cl assify sporadi c CRC cases into
microsatellite stability (MSS), low-frequency microsatellite instability (MSI-L), and high-frequency MSI (MSI-H) (shown in Materials and Methods).
Immunohistochemistry staining for MLH1, MSH2, MSH6 and PMS2 protein and mutation screening for BRAF gene were done for CRC cases with
MSI-H.
Table 1 Clinico-pathological differences between MSI-H and MSI-L/MSS CRCs
Variables MSI-H tumors (N = 75) MSI-L/MSS tumors (N = 1,098) p-value
Age 70.2 ± 9.6 70.8 ± 9.2 0.565
Female gender (%) 45(60) 343(31.2) < 0.001
Right colon (%) 48(64.0) 246(22.4) < 0.001
Stage 1,2 (%) 50(66.7) 504(45.9) < 0.001
Mucinous or signet ring adenocarcinoma (%) 18(24.0) 112(11.0) 0.001
Poor differentiated (%) 18(24.0) 57(5.2) < 0.001
Categorical variables were analyzed using a chi-square test with Yate’ s correction.
Comparisons of quantitative variables between groups used Student’s t-test.
Lin et al. Journal of Biomedical Science 2011, 18:36
/>Page 5 of 11
Among 24,526 annotated RefSeq transcripts (18,631
unique genes) of Illumina Human Ref-8 gene expression
array, 12,012 (48.9%) were expressed in tumor tissues.
599 and 724 transcripts showed higher- or lower-expres-
sions, respectively, in MSS tumors compare d to MSI-H
(Additional File 4). The transcript profiles of nine genes,
as shown in Additional File 5, can be used to well clas-
sify CRC microsatellite status in clinical patients from
Caucasian population [30]. Six of them showed concor-
dant expression profiles between Caucasian and Han
Chinese populations, but lower-expressed SFRS6 and
higher-expressed SET genes of CRC MSS tumors in
Caucasian were not found in Han Chinese, implying
there are subtle population diversities in CRC transcript
profiles.
Although there were numerous genes affected by CN
gains and/or losses in CRC cancer genome, especially in
MSS cases, some might not directly contribute to the
levels of gene expressio ns. The patterns of differentially-
expressed genes between CRC subtypes (two sample t-
test with p-value < 0.05) are similar to those of CNA
analysis at genome-wide scale (Figure 5b). Only 514 of
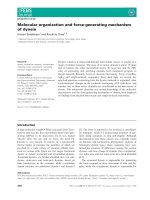
Figure 2 Immunohistochemical (IHC) stains for MLH1, MSH2, MSH6 and PMS2 proteins. Paraffin-embedded tissue sections (4 μm
thickness) of CRC MSI-H and control samples were stained with antibodies for MLH1, MSH2, MSH6 and PMS2 proteins.
Lin et al. Journal of Biomedical Science 2011, 18:36
/>Page 6 of 11
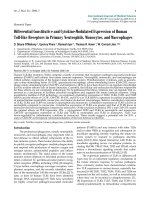
Figure 3 Whole-genome copy number variation (CNV) pattern of colorectal cancer and general population. The CNV frequencies are
measured from 16 MSI-H CRCs, 13 MSS CRCs and 434 individuals from general population using Affymetrix SNP 6.0 array. Top dots represent
the frequencies of CN gains, and bottom dots represent the frequencies of CN losses.
Figure 4 Comparisons of copy number variation patterns between colorectal cancer subtype s.(a).theaveragenumberofCN-changed
regions per genome for MSS, MSI-H and general controls. (b). the average size of CN-changed regions per genome for MSS, MSI-H and general
controls.
Lin et al. Journal of Biomedical Science 2011, 18:36
/>Page 7 of 11
1,515 showing CNA frequency differences between sub-
types were expressed in tumo r tissue, and 271 of t hem
(52%) were d ifferentially expre ssed (p-value < 0.05,
Additional File 6), suggesting the CN variations of genes
might underline the expressional diversities between
CRC MSS and MSI-H subtypes. For example, CN gains
of CP NE1 geneswerefoundin8of13MSSbutnotin
MSI-H cases (Additional File 7), and the average CPNE1
expressional levels of MSS tumors was higher then that
of MSI-H (1797.9 ± 879.5 vs. 963.3 ± 333.7, p-value =
0.008). CPNE1 gene showed the most significant corre-
lation between CNAs and transcript levels (correlation
Figure 5 Genomic profile comparisons between colorectal cancer (CRC) subtypes. (a). Gene-based copy number alteration (CNA) frequency
difference between CRC subtypes. Each dot represents the significance of CNA frequency difference between MSS and MSI-H subtypes of each
gene (Fisher’s exact test). Top dots indicate the -log
10
(p-value) of genes with CN gains, and bottom dots indicate the log
10
(p-value) of genes
with CN losses. (b). Comparison of gene expression differences between CRC subtypes. Each dot represents the log2 scale of average expression
fold-change (MSS/MSI-H) of each gene (two sample t-test, p-value < 0.05).
Table 2 Cancer genes showing differences in copy number aberration between CRC subtypes
Gene Symbol
1
Frequency of CN Gain Frequency of CN Loss Gene expression profile
MSS
2
MSI-H
2
P-value MSS
2
MSI-H
2
P-value MSS
2
MSI-H
2
Fold-change (p-value)
EGFR 0.62 0 0.0003 926+1088 369+197 2.51 (0.106)
EXT1 0.69 0.06 0.00099 829+285 618+244 1.34 (0.053)
GNAS 0.54 0 0.0011 16843+4876 13486+4555 1.25 (0.082)
HOXA11 0.46 0 0.00361 ND
3
ND
3
-
HOXA13 0.46 0 0.00361 368+364 496+318 0.74 (0.346)
HOXA9 0.46 0 0.00361 1979+2078 2521+1705 0.79 (0.472)
IKZF1 0.46 0 0.00361 ND
3
ND
3
-
JAZF1 0.46 0 0.00361 153+128 145+43 1.05 (0.847)
LHFP 0.54 0.06 0.0097 553+486 355+172 1.56 (0.202)
MAFB 0.62 0 0.0003 648+687 711+351 0.91 (0.776)
TOP1 0.54 0 0.0011 156+49 151+40 1.03 (0.768)
MALT1 0.69 0 0.00007 258+79 334+105 0.77 (0.051)
1
The list of cancer gene from the Cancer Genome Project ( />2
The sample sizes of MSS and MSI-H are 13 and 16, respectively.
3
ND: Genes are not expressed in tumor tissue.
Lin et al. Journal of Biomedical Science 2011, 18:36
/>Page 8 of 11
coefficient, r
2
=0.7).CPNE1 gene regulates tumour
necrosis factor-alpha receptor signaling pathway and is
over-expressed in liver cancer [31,32], but is still poorly
investigated in CRC tumorigenesis.
Discussion
Thisisalarge-scalesporadicCRCstudyinanAsian
population, and our results showed that the clinicopatho-
logic features of MSI-H tumors were right-sided predo-
minant, poorly or mucinous diffenentiated, less advanced
disease and female predominant. Similar to previous stu-
dies with Lynch syndrome [6,22], MSI-H in our case ser-
ies of sporadic CRC bear epigenetic change of MLH1
gene. However, the clinical f eatures are distin ctly differ-
ent, and they tend to have older age onset of cancer and
female predominant. For rectal cancer, the percentage of
MSI-H and MLH1 methylation was only 2.8% (9/401)
and 1% (4/401) respectively. On the other hand, right-
sided colon cancer had, 16.3% and 11.2% MSI-H and
MLH1 methylation, respectively. Therefore, dysfunction
of MMR proteins might play different roles in the tumor-
igenesis of colon cancer vs. rectal cancer. It is noteworthy
that all 22 samples with a BRAF (V599E) mutation were
MLH1 hypermethylated, whereas 29 of 51 tumors with
MLH1 hypermethylation did not have a BRAF mutation.
These findings suggest that MLH1 hypermethylation
might be an early event, occurred pr ior to BRAF muta-
tion during CRC tumorigenesis.
We have applied high-density SNP array to detect
copy number changes in the CRC cancer genome in the
Taiwan ese population, and compared the CNA frequen-
cies between MSS and MSI-H subtypes. Previous CRC
CN analyses primarily concerned with the Caucasian
genetic backgrounds and these studies were hampered
by the low-resolution of CGH array. Although different
populations and technological resolutions we re used in
this study, the overall CNV pattern was globally similar
to those from previous studies, indicating the mechan-
ism of CRC tumorigenesis o f different ethnic popula-
tions might be similar. Although EGFR CN gains were
commonly found in MSS tumors (64%), some MSI-H
tumors (14%) carried three or four gene copies. Previous
studies have shown a small proportion of MSI-H tumors
harbor multiple CNAs and c hromosome abnormalities
[17]. Consistently, we also observed some MS I-H
tumors carried more than 1 Mb CNAs (Additional File
1), and 27.5% MSI-H tumors showed DNA aneuploidy.
Studies showed that response predictors for CRC
patients using cetuximab, EGFR monoclonal antibody,
included K-ras/Braf mutation and EGFR gene CN, etc
[33,34]. Further investigations are needed to clarify
whether MSI tumors might be resistant to cetu ximab
for possible BRAF mutation or relatively low copy num-
ber of EGFR gene. Among 12,012 tumor-expressed
transcripts, 514 genes showed significant CN gains or
losses in MSS tumors, but 48% of them were not
directly correlated with their expressional levels. For
example, 8/13 MSS and 0/16 MSI-H tumors have EGFR
CN gains; the expression fold-change of M SS/MSI-H
group was 2.5 (962.4/368.8) but not significant (p-value
= 0.10), caused by large standard deviation of EGFR
expression levels (Table 2). Besides CNVs, other geno-
mic variants, including SNPs and Indels, and epigenomic
modifications all can regulate transcript levels, so an
integrated analysis are needed to interpret the transcript
diversities between CRC subtypes.
The identified CRC s ubtype-specific CN-altered genes
should be seriously considered when investigating the
mechanism of heterogene ous CRC tumorigenesis, and
might be used as ca ndidate markers in the drug therapy
studies. The major discrepancy, and argument, between
our results and other studies was that the proporti on of
MSI-H in our study was only 6.4%, lower than that of
previous reports [35-38]. Selection bias and racial and/
or environmental factors might affect the MSI incidence
in CRCs. Because rectal cancer is less likely t o show
MSI-H than colon cancer [39], a lower rate of MSI-H
colorectal cancer will be reflected in population-based
studies. In studies without selection [39-41] inci dence of
MSI would be similar to our results.
Additional material
Additional file 1: The size distribution of copy number variation in
colorectal cancer. CNVs were called by using Affymetrix Genotyping
Console program based on the intensity data of Affymetrix SNP 6.0 array,
and 20-probe criterion was used to filter out false-positive predictions.
The sizes of identified CN changes from MSS CRCs were majorly
between 50 and 500 kb, and a quarter of these alterations were smaller
than 100 kb.
Additional file 2: Genes showing copy number (CN) differences
between MSS and MSI-H CRC cases. 1,515 genes were found to have
CN frequency difference between MSS and MSI-H tumors using Fisher’s
exact tests (p-value < 0.05).
Additional file 3: The verification of EGFR copy number states of 48
CRC MSS and 48 MSI-H clinical samples . qPCR approach was used to
determine the EGFR CN states of 48 CRC MSS and 48 MSI-H samples.
Additional file 4: Differently-expressed transcripts between MSS
and MSI-H CRC cases. Among 24,526 transcripts of Illumina Human Ref-
8 gene expression array, 599 and 724 transcripts showed higher- or
lower-expressions, respectively, in MSS tumors compared to MSI-H.
Additional file 5: Expression fold-changes between CRC subtypes in
different populations. There were subtle diversities in CRC transcript
profiles between Caucasian and Han Chinese populations.
Additional file 6: The combined analysis of copy number alterations
(CNAs) and gene expressions. 1,515 genes showing different CNA
frequencies between CRC subtypes, and 514 of them were expressed in
these tumor tissues. 271 of 514 genes (52%) show differentia l expressions
between CRC MSS and MSI-H subtypes (two sample t-test with p-value <
0.05).
Additional file 7: The positive correlation between copy number
and expression in CPNE1 gene. The average CPNE1 expressional levels
of MSS group was higher then that of MSI-H group (p-value = 0.008),
Lin et al. Journal of Biomedical Science 2011, 18:36
/>Page 9 of 11
and the gene CNs were highly correlated to expressional levels (liner
regression correlation coefficient, r
2
= 0.7).
Acknowledgements
This project was supported by the Department of Health of Taiwan (DOH99-
TD-C-111-007; DOH99-TD-C-111-014), National Science Council grant of
Taiwan (NSC97-2314-B-010-019-MY2), Taipei-Veterans General Hospital
(V100E2-008) and the National Health Research Institutes, Taiwan.
Author details
1
Division of Molecular and Genomic Medicine, National Health Research
Institutes, Zhunan, Taiwan.
2
Division of Colon and Rectal Surgery,
Department of Surgery, Taipei Veterans General Hospital, Taipei, Taiwan.
3
Division of Hematology and Oncology, Taipei Veterans General Hospital,
Taipei, Taiwan.
4
Institute of Biomedical Sciences, Academia Sinica, Taipei,
Taiwan.
5
Genome Research Center and Department of Life Sciences and
Institute of Genome Sciences, National Yang-Ming University, Taipei, Taiwan.
Authors’ contributions
CHL, JKL, SCC, SFT and WSC conceived of experiments; CHL, SCC, YHC and
HMC performed experiments; CHL, JKL, LHL and YTC provided and analyzed
data; all authors read and approved the final manuscript.
Competing interests
The authors declare that they have no competing interests.
Received: 19 November 2010 Accepted: 7 June 2011
Published: 7 June 2011
References
1. Dept. of Health: Cancer registry annual report (2006). Taiwan, R OC
2009.
2. Fearon ER, Vogelstein B: A genetic model for colorectal tumorigenesis.
Cell 1990, 61:759-767.
3. Vogelstein B, Fearon ER, Hamilton SR, Kern SE, Preisinger AC, Leppert M,
Nakamura Y, White R, Smits AM, Bos JL: Genetic alterations during
colorectal-tumor development. N Engl J Med 1988, 319:525-532.
4. Cunningham JM, Kim CY, Christensen ER, Tester DJ, Parc Y, Burgart LJ,
Halling KC, McDonnell SK, Schaid DJ, Walsh Vockley C, et al: The frequency
of hereditary defective mismatch repair in a prospective series of
unselected colorectal carcinomas. Am J Hum Genet 2001, 69:780-790.
5. Boland CR, Thibodeau SN, Hamilton SR, Sidransky D, Eshleman JR, Burt RW,
Meltzer SJ, Rodriguez-Bigas MA, Fodde R, Ranzani GN, Srivastava S: A
National Cancer Institute Workshop on Microsatellite Instability for
cancer detection and familial predisposition: development of
international criteria for the determination of microsatellite instability in
colorectal cancer. Cancer Res 1998, 58:5248-5257.
6. Soreide K, Janssen EA, Soiland H, Korner H, Baak JP: Microsatellite
instability in colorectal cancer. Br J Surg 2006, 93:395-406.
7. Markowitz S, Wang J, Myeroff L, Parsons R, Sun L, Lutterbaugh J, Fan RS,
Zborowska E, Kinzler KW, Vogelstein B, et al: Inactivation of the type II
TGF-beta receptor in colon cancer cells with microsatellite instability.
Science 1995, 268:1336-1338.
8. Rampino N, Yamamoto H, Ionov Y, Li Y, Sawai H, Reed JC, Perucho M:
Somatic frameshift mutations in the BAX gene in colon cancers of the
microsatellite mutator phenotype. Science 1997, 275:967-969.
9. Rowan A, Halford S, Gaasenbeek M, Kemp Z, Sieber O, Volikos E, Douglas E,
Fiegler H, Carter N, Talbot I, et al: Refining molecular analysis in the
pathways of colorectal carcinogenesis. Clin Gastroenterol Hepatol 2005,
3:1115-1123.
10. Souza RF, Appel R, Yin J, Wang S, Smolinski KN, Abraham JM, Zou TT,
Shi YQ, Lei J, Cottrell J, et al: Microsatellite instability in the insulin-like
growth factor II receptor gene in gastrointestinal tumours. Nat Genet
1996, 14:255-257.
11. Stranger BE, Forrest MS, Dunning M, Ingle CE, Beazley C, Thorne N,
Redon R, Bird CP, de Grassi A, Lee C, et al: Relative impact of nucleotide
and copy number variation on gene expression phenotypes. Science
2007, 315:848-853.
12. Campbell PJ, Stephens PJ, Pleasance ED, O’Meara S, Li H, Santarius T,
Stebbings LA, Leroy C, Edkins S, Hardy C, et al: Identification of somatically
acquired rearrangements in cancer using genome-wide massively
parallel paired-end sequencing. Nat Genet 2008,
40:722-729.
13.
Postma C, Koopman M, Buffart TE, Eijk PP, Carvalho B, Peters GJ, Ylstra B,
van Krieken JH, Punt CJ, Meijer GA: DNA copy number profiles of primary
tumors as predictors of response to chemotherapy in advanced
colorectal cancer. Ann Oncol 2009, 20:1048-1056.
14. Douglas EJ, Fiegler H, Rowan A, Halford S, Bicknell DC, Bodmer W,
Tomlinson IP, Carter NP: Array comparative genomic hybridization
analysis of colorectal cancer cell lines and primary carcinomas. Cancer
Res 2004, 64:4817-4825.
15. Nakao K, Mehta KR, Fridlyand J, Moore DH, Jain AN, Lafuente A,
Wiencke JW, Terdiman JP, Waldman FM: High-resolution analysis of DNA
copy number alterations in colorectal cancer by array-based
comparative genomic hybridization. Carcinogenesis 2004, 25:1345-1357.
16. Camps J, Grade M, Nguyen QT, Hormann P, Becker S, Hummon AB,
Rodriguez V, Chandrasekharappa S, Chen Y, Difilippantonio MJ, et al:
Chromosomal breakpoints in primary colon cancer cluster at sites of
structural variants in the genome. Cancer Res 2008, 68:1284-1295.
17. Jorissen RN, Lipton L, Gibbs P, Chapman M, Desai J, Jones IT, Yeatman TJ,
East P, Tomlinson IP, Verspaget HW, et al: DNA copy-number alterations
underlie gene expression differences between microsatellite stable and
unstable colorectal cancers. Clin Cancer Res 2008, 14:8061-8069.
18. Poulogiannis G, Ichimura K, Hamoudi RA, Luo F, Leung SY, Yuen ST,
Harrison DJ, Wyllie AH, Arends MJ: Prognostic relevance of DNA copy
number changes in colorectal cancer. J Pathol 2010, 220:338-347.
19. Sobin LH WC: UICC TNM classification of malignant tumors. New York:
Wiley-Liss; 1997:5:66-69.
20. Compton CC, Fielding LP, Burgart LJ, Conley B, Cooper HS, Hamilton SR,
Hammond ME, Henson DE, Hutter RV, Nagle RB, et al: Prognostic factors in
colorectal cancer. College of American Pathologists Consensus
Statement 1999. Arch Pathol Lab Med 2000, 124:979-994.
21. Chang SC, Lin JK, Yang SH, Wang HS, Li AF, Chi CW: Relationship between
genetic alterations and prognosis in sporadic colorectal cancer. Int J
Cancer 2006, 118:1721-1727.
22. Chang SC, Lin PC, Yang SH, Wang HS, Liang WY, Lin JK: Taiwan hospital-
based detection of Lynch syndrome distinguishes 2 types of
microsatellite instabilities in colorectal cancers. Surgery 2010, 147:720-728.
23. Grady WM, Rajput A, Lutterbaugh JD, Markowitz SD: Detection of
aberrantly methylated hMLH1 promoter DNA in the serum of patients
with microsatellite unstable colon cancer. Cancer Res 2001, 61:900-902.
24. Dressler LG, Seamer L, Owens MA, Clark GM, McGuire WL: Evaluation of a
modeling system for S-phase estimation in breast cancer by flow
cytometry. Cancer Res 1987, 47:5294-5302.
25. Korn JM, Kuruvilla FG, McCarroll SA, Wysoker A, Nemesh J, Cawley S,
Hubbell
E, Veitch J, Collins PJ, Darvishi K, et al: Integrated genotype calling
and association analysis of SNPs, common copy number polymorphisms
and rare CNVs. Nat Genet 2008, 40:1253-1260.
26. Wang K, Li M, Hadley D, Liu R, Glessner J, Grant SF, Hakonarson H, Bucan M:
PennCNV: an integrated hidden Markov model designed for high-
resolution copy number variation detection in whole-genome SNP
genotyping data. Genome Res 2007, 17:1665-1674.
27. Umar A, Boland CR, Terdiman JP, Syngal S, de la Chapelle A, Ruschoff J,
Fishel R, Lindor NM, Burgart LJ, Hamelin R, et al: Revised Bethesda
Guidelines for hereditary nonpolyposis colorectal cancer (Lynch
syndrome) and microsatellite instability. J Natl Cancer Inst 2004,
96:261-268.
28. Pan WH, Fann CS, Wu JY, Hung YT, Ho MS, Tai TH, Chen YJ, Liao CJ,
Yang ML, Cheng AT, Chen YT: Han Chinese cell and genome bank in
Taiwan: purpose, design and ethical considerations. Hum Hered 2006,
61:27-30.
29. O’Boyle K: The role of the Deleted Colon Cancer (DCC) gene in colorectal
and gastric cancer. Cancer Invest 2003, 21:484-485.
30. Kruhoffer M, Jensen JL, Laiho P, Dyrskjot L, Salovaara R, Arango D,
Birkenkamp-Demtroder K, Sorensen FB, Christensen LL, Buhl L, et al: Gene
expression signatures for colorectal cancer microsatellite status and
HNPCC. Br J Cancer 2005, 92:2240-2248.
31. Tomsig JL, Sohma H, Creutz CE: Calcium-dependent regulation of tumour
necrosis factor-alpha receptor signalling by copine. Biochem J 2004,
378:1089-1094.
Lin et al. Journal of Biomedical Science 2011, 18:36
/>Page 10 of 11
32. Skawran B, Steinemann D, Becker T, Buurman R, Flik J, Wiese B, Flemming P,
Kreipe H, Schlegelberger B, Wilkens L: Loss of 13q is associated with
genes involved in cell cycle and proliferation in dedifferentiated
hepatocellular carcinoma. Mod Pathol 2008, 21:1479-1489.
33. Sartore-Bianchi A, Moroni M, Veronese S, Carnaghi C, Bajetta E, Luppi G,
Sobrero A, Barone C, Cascinu S, Colucci G, et al: Epidermal growth factor
receptor gene copy number and clinical outcome of metastatic
colorectal cancer treated with panitumumab. J Clin Oncol 2007,
25:3238-3245.
34. Tol J, Koopman M, Cats A, Rodenburg CJ, Creemers GJ, Schrama JG,
Erdkamp FL, Vos AH, van Groeningen CJ, Sinnige HA, et al: Chemotherapy,
bevacizumab, and cetuximab in metastatic colorectal cancer. N Engl J
Med 2009, 360:563-572.
35. Chao A, Gilliland F, Willman C, Joste N, Chen IM, Stone N, Ruschulte J,
Viswanatha D, Duncan P, Ming R, et al: Patient and tumor characteristics
of colon cancers with microsatellite instability: a population-based study.
Cancer Epidemiol Biomarkers Prev 2000, 9:539-544.
36. Gryfe R, Kim H, Hsieh ET, Aronson MD, Holowaty EJ, Bull SB, Redston M,
Gallinger S: Tumor microsatellite instability and clinical outcome in
young patients with colorectal cancer. N Engl J Med 2000, 342:69-77.
37. Ward R, Meagher A, Tomlinson I, O’Connor T, Norrie M, Wu R, Hawkins N:
Microsatellite instability and the clinicopathological features of sporadic
colorectal cancer. Gut 2001, 48:821-829.
38. Furukawa T, Konishi F, Shitoh K, Kojima M, Nagai H, Tsukamoto T:
Evaluation of screening strategy for detecting hereditary nonpolyposis
colorectal carcinoma. Cancer 2002, 94:911-920.
39. Ishikubo T, Nishimura Y, Yamaguchi K, Khansuwan U, Arai Y, Kobayashi T,
Ohkura Y, Hashiguchi Y, Tanaka Y, Akagi K: The clinical features of rectal
cancers with high-frequency microsatellite instability (MSI-H) in
Japanese males. Cancer Lett 2004, 216:55-62.
40. Pinol V, Castells A, Andreu M, Castellvi-Bel S, Alenda C, Llor X, Xicola RM,
Rodriguez-Moranta F, Paya A, Jover R, Bessa X: Accuracy of revised
Bethesda guidelines, microsatellite instability, and
immunohistochemistry for the identification of patients with hereditary
nonpolyposis colorectal cancer. JAMA 2005, 293:1986-1994.
41. Xicola RM, Llor X, Pons E, Castells A, Alenda C, Pinol V, Andreu M, Castellvi-
Bel S, Paya A, Jover R, et al: Performance of different microsatellite
marker panels for detection of mismatch repair-deficient colorectal
tumors. J Natl Cancer Inst 2007, 99:244-252.
doi:10.1186/1423-0127-18-36
Cite this article as: Lin et al.: Molecular profile and copy number
analysis of sporadic colorectal cancer in Taiwan. Journal of Biomedical
Science 2011 18:36.
Submit your next manuscript to BioMed Central
and take full advantage of:
• Convenient online submission
• Thorough peer review
• No space constraints or color figure charges
• Immediate publication on acceptance
• Inclusion in PubMed, CAS, Scopus and Google Scholar
• Research which is freely available for redistribution
Submit your manuscript at
www.biomedcentral.com/submit
Lin et al. Journal of Biomedical Science 2011, 18:36
/>Page 11 of 11