Báo cáo y học: "Thymic function and T cell parameters in a natural human experimental model of seasonal infectious diseases and nutritional burden" potx
Bạn đang xem bản rút gọn của tài liệu. Xem và tải ngay bản đầy đủ của tài liệu tại đây (469.38 KB, 11 trang )
Ngom et al. Journal of Biomedical Science 2011, 18:41
/>
RESEARCH
Open Access
Thymic function and T cell parameters in a
natural human experimental model of seasonal
infectious diseases and nutritional burden
Pa T Ngom1*, Juan Solon1, Sophie E Moore1, Gareth Morgan1, Andrew M Prentice1,2 and Richard Aspinall3
Abstract
Background: The study exploits a natural human experimental model of subsistence farmers experiencing chronic
and seasonally modified food shortages and infectious burden. Two seasons existed, one of increased deprivation
and infections (Jul-Dec), another of abundance and low infections (Jan-Jun); referred to as the hungry/high
infection and harvest/low infection seasons respectively. Prior analysis showed a 10-fold excess in infectious disease
associated mortality in young adults born in the hungry/high infection versus harvest/low infection season, and
reduced thymic output and T cell counts in infancy. Here we report findings on the role of early life stressors as
contributors to the onset of T cell immunological defects in later life.
Methods: We hypothesised that season of birth effects on thymic function and T cell immunity would be
detectable in young adults since Kaplan-Meier survival curves indicated this to be the time of greatest mortality
divergence. T cell subset analyses by flow-cytometry, sjTRECs, TCRVb repertoire and telomere length by PCR, were
performed on samples from 60 males (18-23 y) selected to represent births in the hungry/high infection and
harvest/low infection
Results: Total lymphocyte counts were normal and did not differ by birth season. CD3+ and CD4+ but not CD8+
counts were lower for those born during the hungry/high infection season. CD8+ telomere length also tended to
be shorter. Overall, CD8+ TCRVb repertoire skewing was observed with ‘public’ expressions and deletions seen in
TCRVb12/22 and TCRVb24, respectively but no apparent effect of birth season.
Conclusions: We conclude that, although thymic function was unchanged, the CD4+ and CD3+ counts, and CD8+
telomere length results suggested that aspects of adult T cell immunity were under the influence of early life
stressors. The endemicity of CMV and HBV suggested that chronic infections may modulate immunity through
T cell repertoire development. The overall implications being that, this population is at an elevated risk of
premature immunosenescence possibly driven by a combination of nutritional and infectious burden.
Background
A large retrospective community-based study using
demographic data generated over a 50 year period from
3102 individuals born in alternating seasons of relative
food availability and low infectious diseases burden (harvest/low infection; January to June) and deprivation and
high infectious diseases (hungry/high infection season;
July to December), showed that those born in the hungry/high infection were 10-times more likely to die from
* Correspondence:
1
Nutrition Programme, MRC Laboratories, The Gambia
Full list of author information is available at the end of the article
infectious diseases as young adults[1,2]. By splitting the
year in half, seasonal fluctuations are taken into account,
ensuring that periods of typical hungry/high infection
and harvest/low infection, were clearly included in the
right category. In the absence of overt droughts which
are rare in The Gambia, this categorization is considered
sufficient safeguard for possible year to year variations
of the seasons. Follow up studies revealed an association
between enhanced thymic function and being born in
the harvest/low infection season for 8 week old infants
[3]. This suggests that seasonal variation in nutrition
supplies and infectious diseases may modulate immunity
through the thymus from early in life; potentially
© 2011 Ngom et al; licensee BioMed Central Ltd. This is an Open Access article distributed under the terms of the Creative Commons
Attribution License ( which permits unrestricted use, distribution, and reproduction in
any medium, provided the original work is properly cited.
Ngom et al. Journal of Biomedical Science 2011, 18:41
/>
persisting to adolescence and accounting for the
reported season of birth differences in mortality rates[2].
In experimental animals, the detrimental effects of
malnutrition and infection on immunity have long been
recognised[4-6]. In 2-59 month old children, plasmodium falciparum specific IgG antibody responses are
compromised in the malnourished[7]. Single micronutrient deficiency, for example of zinc, has been associated
with poor pneumonia outcome, improved by zinc supplementation[8]. Selenium deficiency is associated with
myocardial infarction caused by coxsackie B virus which
is inhibited by selenium;[9] and selenium supplementation also reverses the symptoms of AIDS,[10] in which
selenium deficiency is common[11,12]. Vitamin D deficiency also spells poor innate immunity through modulation of neutrophil and macrophage function; and
vitamin D status is associated with respiratory illness
and risk of TB[13,14]. Thymic atrophy characterises diet
induced malnutrition in mice;[15] and the administration of the satiety hormone, leptin which acts via the
nutritional-status-sensitive[16] hypothalamic-pituitaryadrenal axis, has been shown to reverse starvation
induced thymic involution[15]. The thymus is also a target for disease causing pathogens, and the exposure of
mice to plasmodium berghei, resulted in invasion of the
thymus by day 14; accompanied by severe thymic atrophy[17].
In humans, postmortem studies show thymic involution in the severely malnourished[18]. Furthermore,
cytokines including IL-7 and IL-2 which are important
for thymic and T cell development may be suppressed
by changes in the thymus[19,20]. In children, reduced
CD4 + CD62L - and CD8 + CD28 - effector T cells in the
healthy as well as the malnourished-infected, compared
to the well-nourished-infected are seen[21]. The human
thymus is also vulnerable to infections, and thymic size
was significantly decreased in children infected with
HIV[22]. Reports show that a smaller thymus was a consistent and independent risk factor for mortality and was
predictive of immune competence[23,24].
Our original analysis of mortality by season of birth
revealed the surprising observation that the KaplanMeier survival curves only started to diverge in adolescence[2] suggesting that any initial deficits in immunological endowment are magnified by an accelerated
immunosenescence and only fall below the protective
threshold in early adulthood. To test this possibility we
recruited two groups of young adults (18-23 y) born in
the hungry/high infection and harvest/low infection and,
based on the known susceptibility of the thymus to
nutritional insult and our previous evidence for early-life
effects[3]. We investigated T cell numbers, sjTRECs, Tcell repertoire and telomere lengths. We assumed
chronic and seasonal nutritional deprivation existed,
Page 2 of 11
partly because of the low dietary intake and the hungry/
high infection and harvest/low infection seasonal cycles
of weight lost and gain observed for the past decades
[25]. Growth was also reported to deteriorate in infants
during the hungry/high infection [26] accompanied by
serious depletion of staple foods. Infections including
malaria and diarrhea are endemic here, with the highest
prevalence in the hungry/high infection season[27-29].
The current study of young adults exposed both at
birth and repeatedly for the years leading to adolescence, presents a natural human experimental model
which could be exploited for the characterisation of the
immunological mechanisms underlying the effects of
seasonal fluctuations as well as chronic, nutritional
deprivation and infectious burden. Subsistence cultivation of crops for food, practised in this community, is
consistent with a chronic lack of adequate nutrition.
Furthermore, farming here is limited to the annual
rains. Consequently staple food supplies are depleted for
much of the year as the produce of the farming season
is exhausted before the next crop matures; this occurs
amidst heavy manual labour from the early teenage
years, probably worsening overall nutritional/energy status, with environmental conditions conducive to the
propagation of infections. We predict that the exposure
of both the mothers and their fetuses during pregnancy,
and of their babies after birth, to deprivation and infectious burden may have a synergistic effect on the maturing immune system and long term health of those born
during the hungry/high infection season. Therefore the
overall effect is that residents are under both a general
and chronic (brought about by the limitations of subsistence farming and the repeated annual cycles, endured
from early life through to adolescence), as well as a seasonally differential risk of nutritional deprivation and
infectious burden. We report suggestions that aspects of
adult T cell immunity may be under the influence of
early life stressors.
Methods
A prospective cohort study of 60 overtly healthy 18-23
year (average age 21.3 y, SD 2.0 y) old men living in
rural village community clusters, born in the hungry/
high infection (n = 30; average age 21.1 y, SD 1.9 y) or
harvest/low infection (n = 30; average age 21.5 y, SD 2.2
y) season, was conducted. Thirty milliliters venous
blood was taken following signed informed consent
from each participant. Ethical approval was granted by
the joint MRC and Gambian Government Ethics Committee (Reference number SCC 863).
Lymphocyte subset analysis
Lymphocyte subsets were evaluated by flowcytometry
using the FACsCalibur [Becton Dickinson UK Ltd,
Ngom et al. Journal of Biomedical Science 2011, 18:41
/>
Oxford, UK] following monoclonal antibody staining.
Briefly, 100 μl whole blood was incubated with 10 l
monoclonal antibodies including anti-CD4 + , CD8 + or
CD3+ [Cyto-stat, Beckman Coulter S.A, Nyon Switzerland]. The red blood cells were lysed and the white
blood cells fixed and stabilized [Q-prep Beckman, Coulter] then stored at +4°C prior to transportation on ice
to the base laboratory for analysis.
CD4+ and CD8+ cell selection and Triazol treatment
PBMCs were separated by ficoll gradient centrifugation
followed by positive selection of CD4+ and CD8+ T cells
using magnetic beads [MACS columns, Miltenyi Biotec],
then spun at 2000 rpm for 5 minutes. The pellet was resuspended in 1 ml Triazol reagent (SIGMA), then store
at -80°C until use.
DNA/RNA extraction and cDNA generation
The Triazol treated samples were thawed and 1 ml
mixed with 0.2 ml chloroform followed by centrifugation at 14,000 rpm for 15 minutes to separate into an
aqueous RNA phase, an organic protein layer and a
DNA interphase.
RNA was extracted by adding 0.5 ml isopropanol to
the aqueous phase and incubating at-20°C overnight,
then centrifuged at 14000 rpm for 10 minutes. The
resulting RNA pellet was washed in 1 ml of 75% ethanol, dried on ice for 5-10 minutes then rehydrated in 10
μl sterile water. cDNA was generated by RT PCR using
oligo dT primers.
DNA was extracted by mixing the inter phase with 0.3
ml of 100% ethanol, then centrifuged at 9000 rpm for
10 minutes and the pellet washed twice in 1 ml of 0.1
M sodium citrate containing 10% ethanol; followed by 1
ml of 70% ethanol. The DNA pellet was dried and rehydrated in 100 μl sterile water, then DNA concentration
determined by spectrophotometry.
Signal joint (sj) T cell receptor (TCR) rearrangement
excision circles (TREC) analysis The sjTREC assay has
been previously described in detail[3]. Briefly: 2 μl of
DNA from standards and samples were added to 18 μl
of master mix containing 0.3 μM of sjTREC specific forward: GCCACATCCCTTTCAACCATGCTGAC and
reverse: TTGCTCCGTGGTCTGTGCTGGCATC primers, 5 mM MgCl2, 200 ng/μl BSA or 0.01% Tween 20
to give a total reaction volume of 20 μl. The reactions
were then transferred into glass capillary tubes for real
time PCR quantification of sjTRECs, using the Light
Cycler. The conditions for the real time PCR were as
follows: 1 cycle of 95°C for 15 minutes for Taq polymerase activation, followed by 40-60 cycles of 95°C for 1
second; annealing at 62°C for 25 seconds; amplification
at 72°C for 12 seconds and measurement of fluorescence
emitted from product at 85°C for 5 seconds. A cloned
sjTREC fragment of known concentration was used as
standard and could also serve as a positive control.
Page 3 of 11
Sterile distilled water was included in each reaction to
serve as a negative control.
Expressed TCRVb repertoire
The lack of abnormal clonal expansion for the CD4 +
TCRVb repertoire reported by others, [[30], and [31]]
prompted us to restrict the repertoire analysis to the
CD8 + TCRVb. Following RA extraction and reversetranscription to cDNA, products of the first round PCR
generated using the 24 TCRVb and TCRCb primers (24
reactions per T cell subset per subject) were confirmed
on agarose gel to be of the expected CDR3 lengths, ranging from 100 bp to 400 bp[32]. Following this confirmation and labelling of DNA products with fluorescent
sequencing dye, the CDR3 length distribution of the T
cell clones within each of the 24 TCRVb types were
determined by spectra typing using a gene scanning
approach[32]. T cell TCRVb repertoire assay is
described in detail elsewhere[32]. Briefly, 24 TCRVb and
one TCRCb specific primers were used to amplify
cDNA corresponding to amino acid residues 95-106 of
the TCRVb CDR3 region. The product was labeled with
a 5’FAM dye conjugated TCRCb specific primer. The
product was scanned using an ABI PRISM ® 310
sequencer (GMI, Inc USA); to generate a spectra type of
peaks representing the different T cell clones in each
sample.
Telomere length estimation
The telomere length assay is based on the method by
Cawthon et al[33]. Briefly, commercially obtained telomere specific primers; CGGTTTGTTTGGGTTTGG
GTTTGGGTTTGGGTTTGGGTT (forward) and GGC
TTGCCTTACCCTTACCCTTACCCTTACCCTTACC
CT (reverse), were used to amplify telomeric DNA in
the CD4+ and CD8+ T cell subset. Six serial dilutions of
standards containing telomeric DNA of known concentration were prepared by doubling dilution. Sample
DNA and standard were then placed in 0.2 μl tubes and
heated at 95°C for 5 minutes, and then snap chilled on
ice for ≥5 minutes. Real time PCR reactions were set up
as follows: A master mix made by adding 10 μl of 2 ×
QuantiTect mix [Qiagen, UK], 250 nM each of the telomere primer pairs 1% DMSO for increased primer binding specificity and 2.5 mM DTT for increased Taq DNA
polymerase enzyme fidelity. Then 2 μl of sample DNA
containing 35 ng, was added to 18μl master mix then
transferred to glass capillaries for the real time PCR analyses. Optimal PCR conditions were achieved at 1 cycle
of 95°C for 15 minutes initial denaturation, followed by
35 cycles of 95°C for 15 seconds denaturation; 54°C for
40 seconds simultaneous primer annealing and extension followed by 1 cycle of 65°C for 5 seconds fluorescence measurement. Results were generated as cross
Ngom et al. Journal of Biomedical Science 2011, 18:41
/>
over time (Ct)/CD4+ or CD8+ T cell, where Ct was the
time in seconds needed to generate sufficient telomere
DNA product for detection by the Light Cycler [Rouche
diagnostics, UK]. The smaller the Ct the more telomere
repeat sequences, hence the longer the telomere in the
starting DNA sample.
Page 4 of 11
Table 1 sjTREC levels in the population and by season of
birth 18-23 year old men
GM sjTREC/100 T cells
For the T cell repertoire analysis, the Kolmogorov Smirnov test was used to assess variation in the distribution
of T cell clones within the population. For the season of
birth analyses, means were compared for those born in
the hungry/high infection season versus those born in
the harvest/low infection season. For normally distributed data, the Student’s t test was used, and for skewed
data, log transformation was applied and the Man Whitney U test used and geometric means (GM) given. P <
0.05 was considered statistically significant.
Results
The mean birth weight of the population was 3.07 Kg,
ranging from 1.64-3.65 Kg. There were only 2 subjects
with low birth weight (<2.5 kg). To evaluate the effects
of high or low birth weight as indicators of nutritional
status, we categorized by birth weight above (high) or
below (low) the population median, and subjected the
data to analyses of co-variance; but there were no overall differences in birth weight effects (data not shown).
Thymic output and T cell subsets in the population
The thymic output, repertoire and telomere length
analyses were based on CD4 + and CD8 + sorted cells
with purity of at least 90%. Of the 60 subjects included,
56 (27 hungry/high infection and 29 harvest/low infection) CD4+ T cell and 59 (29 hungry/high infection and
30 harvest/low infection) CD8+ T cell samples had complete sjTREC data. Samples from 4 of the CD4+ and 1
from the CD8 + subset could not be analysed for
sjTRECs due to poor sample quality and therefore were
excluded.
As a molecular marker of thymic output, sjTRECs
concentrations in peripheral blood samples were used to
evaluate thymic function. Mean sjTREC level for the
CD4+ T cell subset was approximately 1.5 fold higher
than for the CD8+ T cell subset, reflecting a CD4+:CD8+
production ratio of approximately 1.5 Table 1). However, the difference was not statistically significant. The
results also showed that sjTREC levels of neither the
CD4+ nor the CD8+ T cell subsets differed significantly
by season of birth (Table 1).
Since thymic output influences peripheral T cell numbers, the major peripheral T cell subsets were similarly
analyzed. All but 2 subjects had complete lymphocyte
count data (29 from each season); while 59 (30 hungry/
high infection and 29 harvest/low infection) had full
95% CI
CD8+
(n)
95% CI
*P value
All
0.061 (56)
0.03-0.11
0.043 (59)
0.02-0.8
0.44
Harvest
Statistical analysis
CD4+
(n)
0.060 (29)
0.03-0.14
0.029 (30)
0.01-0.07
0.27
Hungry
P value
0.063 (27)
0.95
0.03-0.15
0.064 (29)
0.18
0.03-0.15
0.96
sjTREC/100 CD4+ and CD8+ T cells of positively selected PBMCs are shown for
the whole population. The Man Whitney U test was used with geometric
means (GM) compared for the two seasons of birth. The number of samples
(n), 95% CI and p values are also shown. sjTREC data were considered
unreliable for the CD4+ and CD8+ samples of 4/60 and 1/60 subjects
respectively, therefore these were rejected.
CD4+ and CD8+ counts. There were 57 (29 hungry/high
infection and 28 harvest/low infection) subjects with
complete CD3+ counts. There were no significant differences in the percentage CD4 + , CD8 + or CD3 + T cell
subsets by season of birth. However, the absolute numbers of CD4+ and CD3+ T cells were significantly lower
in those born during the hungry/high infection compared to the harvest/low infection season (Table 2). The
CD4+:CD8+ ratio was similar for both harvest/low infection and hungry/high infection season born, at 1.6 and
1.5 respectively.
CD8+ TCRVb size distribution showed extensive repertoire
distortion with season of birth effects on TCRVb 12/24
CD8+ TCRVb repertoire data was available for 52 subjects, with data from 4 subjects missing from each
group. While the CD8+ T cell subset exhibited extensive
distortions (visually) in the spectra types of most of the
24 TCRVb types analyzed, it emerged from the initial
analyses that the CD4+ T cell subset consistently exhibited normal spectra type distributions consequently
further repertoire analysis was limited to the CD8+ T
cell subset. Although the overall variability in the distribution of T cell clones assessed by the Kolmogorov
Smirnoff test, which measures divergence of the distribution from the expected normal, did not show significant season of birth differences (p < 0.67), effects on
individual TCRVb types were observed.
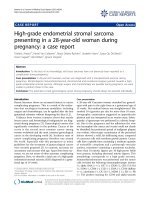
The number of CDR3 peaks provides a measure of T
cell clonal diversity. Peaks representing genuine T cell
clones were defined as those with fluorescence intensities above 500, an arbitrary ‘cut off’ which excluded
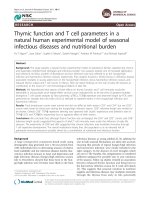
background ‘noise’ fluorescence. Figure 1 shows that the
average number of peaks for virtually all 24 TCRVb
types are much lower (<6 per TCRVb) than the 8-10
peaks seen in healthy adults [32], reflecting oligoclonal
expansions characterizing repertoire skewing. The
results also revealed that there were no season of birth
differences (p values on Table 3) in the total number of
Ngom et al. Journal of Biomedical Science 2011, 18:41
/>
Page 5 of 11
Table 2 Lymphocyte phenotypes, in the population by season of birth in 18-23 years old men
Lymphocyte subsets (SD) [95%CI]
Mean
Lymph %
GM
Lymph × 106/μl
Mean
CD4+ %
GM
CD4+ × 106/μl
Mean
CD8+ %
GM
CD8+ × 106/μl
Mean
CD3+ %
GM
CD3+ 106/μl
All
41.7
(9.1)
2.8
[2.6-2.9]
40.4
(7.4)
1.0
[1.0-1.1]
25.7
(6.4)
0.6
[0.6-0.7]
74.2
(8.0)
1.8
[1.8-1.9]
n
58
58
59
59
58
59
57
57
Harvest
41.9
2.8
41
1.3
25.1
0.7
74.6
2.1
(7.6)
[2.6-3.1]
(7.2)
[1.0-1.3]
(6.2)
[0.6-0.8]
(8.7)
[1.9-2.3]
n
29
29
29
29
28
29
28
28
Hungry
42.9
2.56
39.9
1.0
26.4
0.6
73.8
1.8
n
(9.2)
29
[2.3-2.7]
29
(7.6)
30
[0.9-1.1]
30
(6.7)
30
[0.6-0.8]
30
(7.4)
29
[1.6-2.0]
29
p value
0.63
0.06
0.57
<0.03
0.44
0.43
0.70
<0.05
Means and GM in the whole population and by season are shown. The number of samples (n), 95% CI and p values comparing the two seasons are also shown.
infection and 7 harvest/low infection season born) failed
to produce any peaks for TCRVb24.
While peak numbers define clonal diversity, total
fluorescence intensity of a TCRVb type
determines clonal abundance. Expressing the sum of
the fluorescences generated by each of the 24 CD8 +
7
6
5
4
3
2
1
TCRV 24
TCRV 23
TCRV 22
TCRV 21
TCRV 20
TCRV 18
TCRV 17
TCRV 16
TCRV 15
TCRV 14
TCRV 13B
TCRV 13A
TCRV 12
TCRV 9
TCRV 11
TCRV 8
TCRV 7
TCRV 6B
TCRV 6A
TCRV 5
TCRV 4
TCRV 3
TCRV 2
0
TCRV 1
Mean no. of peaks per TCRV
peaks generated by individual TCRVb types except for
TCRVb24 for which, those born in the hungry/high
infection season had lower peak numbers (p < 0.03).
TCRVb12 had the highest mean number of peaks in
both seasons-of-birth and TCRVb24 generated the lowest mean (Figure 1). All but 8 subjects (1 hungry/high
Figure 1 Season of birth patterns, for mean number of TCRVb peaks in the 24 TCRVb types. The mean numbers of peaks per TCRVb type
(a measure of T cell clonal diversity) which is calculated as the average of the sum of the peaks in each of the 24 TCRVb types per season are
shown for the hungry/high infection (blue) and harvest/low infection (maroon) seasons. The error bars represent 1SE from the mean. The Fig
shows that the average numbers of peaks for virtually all 24 TCRVb types are much lower than the 8-10 peaks seen in healthy adults. There were
26 subjects for each season of birth. Except for TCRVb24 for which the hungry/high infection season average was significantly lower than for the
harvest/low infection season average (p < 0.03), there were no significant season of birth differences in the overall number of TCRVb peaks
indicating the absence of seasonal effects on overall CD8+ T cell clonal diversity.
Ngom et al. Journal of Biomedical Science 2011, 18:41
/>
Page 6 of 11
Table 3 TCRVb usage, as fluorescence intensity-calculation
of individual TCRVb types of CD8+ subset in the population
and by season of birth in 18-23 years old men
TCRVb Type
Mean fluorescence intensityx104/subject
*P value
All
(52)
Harvest season
(n = 26)
Hungry season
(n = 26)
1
6.4
6.8
6.0
0.59
2
2.8
3.1
2.6
0.97
3
6.3
6.6
6.0
0.88
4
6.4
7.5
5.2
0.41
5
5.2
5.0
5.2
0.88
6A
3.8
4.1
3.5
0.30
6B
4.7
4.5
4.9
0.68
7
4.1
4.8
3.5
0.27
8
5.1
4.8
5.9
0.35
9
4.4
4.0
4.8
0.93
11
6.4
7.3
5.5
0.22
12
9.6
11.6
7.6
0.04
13A
2.4
2.5
2.4
0.98
13B
3.5
3.8
3.3
1.00
14
4.2
4.2
4.3
0.94
15
5.9
6.2
5.5
0.65
16
5.6
4.9
6.2
0.27
17
5.2
5.6
4.8
0.54
18
3.7
3.6
3.8
0.82
20
3.6
3.5
3.7
0.75
21
5.6
5.2
6.0
0.36
22
6.0
6.2
5.7
0.60
23
4.9
5.0
4.9
0.87
24
0.3
0.1
0.4
0.03
expression of the CD8+ TCRVb24 compared to only 1
of the 26 (3.8%) for those born during the hungry/
high infection season, representing 73% and 96% deletion of TCRVb24 respectively. TCRVb22 was also
expressed in all but 1 subject who was born in the
hungry/high infection season. All those born in the
harvest/low infection season showed good expression
of TCRVb22.
Peculiar expression patterns were also noted for
TCRVb5, 8 and 20, with deletions observed in 21/52
(40%), 22/52 (42%) and 24/52 (46%) respectively. However there were, no season of birth differences in the
expression of these TCRVb types.
*P value are for differences between TCRVb usage by season of birth, with the
number of subjects (n) shown.
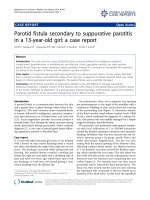
TCRVb CDR3 spectra-types as a percentage of the sumtotal of fluorescences generated by all TCRVb spectra
types, provides the percentage TCRVb type usage. The
results showed an average usage of less than 5% for the
majority of TCRVb types. However, the usage of CD8+
TCRVb12 for those born in the harvest/low infection
season was approximately twice the population mean
(Figure 2). Further statistical analysis confirmed that the
usage of CD8+TCRVb12 for those born during the hungry/high infection season was significantly lower than
for those born during the harvest/low infection season
at 7.76 versus 10.24 × 10⁴ mean fluorescence intensity
respectively (p = 0.04; Table 3).
The analyses also revealed, that while CD8
+
TCRVb12 was universally (100%) expressed, CD8 +
TCRVb24 was virtually deleted in the study population. Seven out of the 26 subjects (26.9%) born in the
harvest/low infection season showed modest
Season of birth differences evident in the CD8+, but not
CD4+ telomere lengths
Relative telomere length analyses were performed on 58/
60 CD4+ and 60/60 CD8+ samples. The results revealed
that average telomere length for the CD8+ T cell subset
was 3 fold shorter than for the CD4+ subset with GM
Ct values at 0.06 and 0.02/100 cells for the CD8+ and
CD4+ subset respectively, p < 0.001. The average telomere length for the CD8+ subset of those born in the
hungry/high infection season was marginally lower than
for those born in the harvest/low infection season, with
GM Ct values 0.02, versus 0.03, per 100 cells for the
harvest/low infection hungry/high infection seasons
respectively, p = 0.05 (Table 4).
Discussion
We previously showed associations between season-ofbirth, thymic size and functional changes during early
infancy, with those born during the harvest/low infection season having larger thymi and enhanced T cell
production[3]. To test the hypothesis that these early
life events are amplified in adults to reflect the season
of birth effects on the reported adult mortality,[2] we
first assumed that as infants, the young adults studied
here, were exposed to some of the same seasonal pressures which existed previously, although current
improvements in the socioeconomic conditions of
today are consistent with milder environmental pressures. The improved socioeconomic conditions coupled
with the repeated exposure of environmental stressors
across the seasons has the potential to obscure previously reported season of birth differences[2]. Unlike
the earlier findings in the babies, [3] we did not
observe season-of-birth associations with thymic output in the young adults. In addition to the overall
improvements in the socioeconomic conditions
enjoyed today, it is also possible that the cumulative
impact of chronic nutritional deprivation and repeated
infections over the years leading to adolescence
obscured season-of-birth differences on thymic output
Page 7 of 11
TCRV 24
TCRV 23
TCRV 22
TCRV 21
TCRV 20
TCRV 18
TCRV 17
TCRV 16
TCRV 15
TCRV 14
TCRV 13B
TCRV 13A
TCRV 12
TCRV 11
TCRV 9
TCRV 7
TCRV 8
TCRV 6B
TCRV 6A
TCRV 5
TCRV 4
TCRV 3
TCRV 2
TCRV 1
% TCRV usage.
Ngom et al. Journal of Biomedical Science 2011, 18:41
/>
Figure 2 Relative CD8+ TCRVb usage by season of birth, in the CD8+ T cell subset. The relative usage within the hungry/high infection or
harvest/low infection season for each of the 24 TCRVb types is determined by expressing the sum of the fluorescence intensities of each TCRVb
type as a percentage of the total of all peak fluorescence intensities in the population. The percentage CD8+ TCRVb usage for those born in
hungry/high infection season (blue bars) and harvest/low infection season (maroon bars) are shown. While the usage of most TCRVb types did
not exceed 5%, TCRVb12 usage was consistently higher than all TCRVb types for both seasons of birth. The near extinction of TCRVb24 is
manifested in the near zero usage observed for both seasons of birth. There were 26 subjects each born in the hungry/high infection or
harvest/low infection seasons. If each TCRVb type was used at same frequency, usage would be expected at a frequency of approximately 4%
(1/24) [dotted horizontal line], therefore there is an overall high usage; with most (16/24) showing ≥4% usage. TCRVb12 ‘publicly’ expressed
perhaps reflecting association with the endemicity of hepatitis B virus; TCRVb12 being specific for HBV core antigen. Significant season of birth
differences were seen for TCRVb12 and 24; p = 0.04 and p < 0.03 respectively.
which may have pre-existed at infancy. The hungry/
high infection season is associated with greater mortality rates; [1] therefore it is also possible that the worst
affected individuals died before reaching adolescence
which may be a source of bias. It support of our data,
the lower TREC concentrations in the young adults
compared to the reports in the babies, [3] are consistent with reduced thymic output in advancing age[34].
Table 4 CD4+ and CD8+ relative telomere length, in the
population and by season of birth in 18-23 years old
men
GM Ct/100 cells
CD4+
(n)
95% CI
CD8+
(n)
95% CI
*P value
All Subjects 0.02 (58) 0.014-0.039 0.06 (60) 0.036-0.112 <0.05
Harvest
0.02 (30) 0.009-0.040 0.01 (30) 0.007-0.027 0.5†
Hungry
0.03 (28) 0.010-0.050 0.04 (30) 0.018-0.069 0.62†
P value
0.49
0.05
GM cross over time (Ct) which is inversely proportional to telomere length,
number of subjects (n), 95% CI and p values are shown.
Despite the lack of season of birth effects on thymic
output, lower CD4+ as well as CD3+ counts were associated with hungry/high infection season births. Considering the central role of CD4 + cells in the immune
system, [35-38] this implies worse immunity for adults
born in the hungry/high infection season. When season
of collection was controlled for, (i.e. sampling done in a
different season to the subject’s birth) this did not significantly alter the findings, although sample sizes were
substantially reduced. Nonetheless, 67.9% (38/56) for the
CD4+ T cell subset were collected during the hungry/
high infection season months of July to December,
therefore it is possible that the raised CD4+ and CD3+
counts for those born in the harvest/low infection season (but had some of their samples collected in the
hungry/high infection season) were partly influenced by
more peripheral T cell proliferation. Antigenic load
which drives T cell proliferation is higher in the hungry/
high infection season when infectious burden is heavier;
[39] and malaria which peaks here during the hungry/
high infection season, is likely to impose further
immune pressure accompanied by changes in T cell
Ngom et al. Journal of Biomedical Science 2011, 18:41
/>
counts as reported in human studies[40,41]. Further studies specifically testing the season of collection are
needed to verify this.
The lack of season of birth effects on thymic output
may reflect its higher tolerance threshold, than the CD4
+
and CD3 + subsets, which may be more sensitive to
pressures from environmental elements. In support of
this, dietary zinc was associated with and differential
rises of up to 24% and 64% CD4+ and CD3+ lymphocyte
counts respectively[42].
Similarly to the CD4+ and CD3+ counts, the season of
birth effects on specific TCRVb types suggested differential sensitivities to elements of the environment. The
reduced usage of TCRVb12 for those born in the hungry/high infection season (most of whose samples were
also collected in the hungry/high infection season) may
be related to the prevailing infections. HBV infection is
endemic in this community with 10-15% of adult male
deaths due to hepatocellular carcinoma which is associated with HBV infection[43] and it has been shown
that TCRVb12 is specific for hepatitis B virus (HBV)
core antigen[44]. Those born in the hungry/high infection season may be less able to control HBV (particularly during the hungry/high infection season), possibly
leading to increased liver damage[45]. The season of
birth differences observed for the TCRVb24 which is
deleted in all but 8 of the 52 subjects all of whom only
lowly expressed TCRVb24, suggested that TCRVb24
may not be of significant value for immune protection
in either season. It is possible that a ‘chance’ Type 1 statistical error arising from multiple testing of repeated
variables may account for the season of birth difference
seen, and that a bigger sample size may produce significant differences in other TCRVb types.
Repertoire skewing is consistent with accelerated proliferation and the potential to drive telomere erosion,
therefore the shorter mean telomere length for those
born in the hungry/high infection season suggested that
their CD8+ T cells were under proliferative pressure and
at a higher risk of replicative senescence. Telomere
shortening is accelerated in arterial tissue exposed to
oxidative stress factors including reactive oxygen species
(ROS)[46]. The endemicity of infections in this community may be expected to generate ROS to contribute to
telomere shortening especially for those born in the
hungry/high infection season.
To optimize the interpretation of our TREC findings
at the population level, results from other study populations were used for comparison. The TREC assay which
is now widely used as a marker of thymic output lacks a
‘gold’ standard; thus limiting the number of studies with
which to compare our data. However, our results suggested that average TREC concentrations in the subjects
studied may be substantially lower than those of adults
Page 8 of 11
elsewhere, [47,48] implying diminished thymic output
and immune capacity in this population. Persistent
infectious burden rather than low thymic output may
also be responsible for the lower TRECs; since elevated
cell proliferation from antigenic exposure is known to
dilute TREC concentrations[49]. Our findings, at the
population level, that the T cell subsets are comparable
to those of healthy individuals from the sub region,
[50-53] imply that poor T cell immunity may be common here. The lack of observable differences arising
from the further analyses by birth weight category
(higher/lower than the population median) is consistent
with the overall findings but may have been confounded
by the resultant reductions in numbers.
Our analyses of the T cell repertoire was meant to
give an in depth evaluation of T cell immune status
beyond thymic output and T cell numbers, and the
extensive CD8 + TCRVb repertoire distortions in the
population indicated more severe immune challenges
than was evident from the thymic output and T cell
counts. Only 2 (TCRVb12 and 15) out of 24 TCRVb
types showed an average spectra-type peak number ≥5
across all donors; compared to reports of >8 peaks in
healthy individuals[54,55]. We speculate that repertoire
skewing in this population was driven by environmental
stressors including the repeated persistent antigenic
exposure annually and across the seasons due to the
endemicity of infections [56-58] including CMV, which
is associated with virus specific CD8+ T cell types and
other risk factors [59,60]. We argue that the chronic
nature of the assault on the immune system of both
groups may be the reason for the general distortion of
the TCRVß repertoire. Significantly, the timing of exposure to environmental stressors may be more critical,
the closer to the time of birth it occurs, as the thymus
experiences its greatest and only growth phase in the
first year of life, a period of maximum vulnerability;
with the potential to generate ever-lasting impact on the
thymus and the T cells it generates. Consequently the
thymi of those born in the hungry/high infection season
may never be adequately compensated to cope with
later life demands. Conversely, thymi of those born in
the harvest/low infection in a more enabling environment for development, may be endowed with a more
resilient initial thymic capacity. The immune insufficiency implied by the apparent oligoclonal repertoire
distortions is consistent both with the lower thymic output compared to others;[47,48] and supported by the
association of a polyclonal repertoire with a lack of antigen exposure,[61] favourable immunity being associated
with good thymic output and a broad repertoire[62].
Chronic HBV infection is also endemic in this community,[63] and the publicly expressed TCRVb12 being
specific to the HLA-A2 restricted hepatitis B virus
Ngom et al. Journal of Biomedical Science 2011, 18:41
/>
(HBV) core antigen[44] supports a role for HBV in the
marked global repertoire skewing seen. The near extinction of TCRVb24 in the population, which has also been
reported in other settings, where TCRVb24 became
notably expanded when stimulated by specific antigen,
[61] suggested that the near zero expression in our
study was probably not due to lack of capacity for the
TCRVb24 clone to expand. This implies that TCRVb24
offers little, if any, advantages in this community. As
clonal expansion and cell division are accompanied by
telomere erosion,[64,65] the shorter telomere of the
CD8+ compared to the CD4+ subset, supports reports
that the CD8+ subset undergoes faster clonal expansion
[66]. Indeed shorter mean telomere length has previously been reported for the CD8 + compared to the
CD4+ subset in healthy humans[67] and with increasing
T cell turnover[65]. A naïve T cell is estimated to go
through at least 14 cell divisions during an immune
response,[68,69] therefore the repeated infections might
be expected to drive telomere shortening although
human studies with which to compare our data were
lacking.
Conclusions
Taken together, our data showed no definitive link
between adult thymic function and early life effects.
Despite this, season of birth differences in the CD4+ and
CD3+ counts as well as CD8 + telomeres, suggest that
aspects of adult T cell immunity may be under the
influence of early life stressors. We also argue that,
repeated annual cycles of nutritional deprivation and
infectious burden may drive overall CD8+ TCRVb repertoire skewing possibly related to risk factors including
CMV and HBV infections. Put together, we propose the
environmental pressures possibly of nutritional origin,
predispose this population to infections arising from the
resultant challenges to the immune system.
Acknowledgements
We are grateful to the subjects who donated blood samples and to the
Nutrition Program staff at Keneba. We thank the MRC and IDB for funding.
This work was supported by the MRC and IDB Merit scholarship award.
Author details
1
Nutrition Programme, MRC Laboratories, The Gambia. 2MRC International
Nutrition Group, London School of Hygiene and Tropical Medicine, Keppel
Street, London WC1E 7HT, UK. 3Translational Medicine, Cranfield Health,
Cranfield, UK.
Authors’ contributions
PTN, AMP and RA conceptualized, designed the study and participated in
drafting the manuscript. PTN did the laboratory work including all the
molecular analyses. JS participated in the field work; GM and SEM
participated in drafting the manuscript. All authors read and approved the
final manuscript.
Competing interests
The authors declare that they have no competing interests.
Page 9 of 11
Received: 26 January 2011 Accepted: 15 June 2011
Published: 15 June 2011
References
1. Moore SE, Cole TJ, Collinson AC, Poskitt EM, McGregor IA, Prentice AM:
Prenatal or early postnatal events predict infectious deaths in young
adulthood in rural Africa. Int J Epidemiol 1999, 28:1088-1095.
2. Moore SE, Cole TJ, Poskitt EM, Sonko BJ, Whitehead RG, McGregor IA,
Prentice AM: Season of birth predicts mortality in rural Gambia. Nature
1997, 388:434.
3. Ngom PT, Collinson AC, Pido-Lopez J, Henson SM, Prentice AM, Aspinall R:
Improved thymic function in exclusively breastfed infants is associated
with higher interleukin 7 concentrations in their mothers’ breast milk.
Am J Clin Nutr 2004, 80:722-728.
4. Martinez D, Cox S, Lukassewycz OA, Murphy WH: Immune mechanisms in
leukemia: suppression of cellular immunity by starvation. J Natl Cancer
Inst 1975, 55:935-939.
5. McMurray DN, Bartow RA, Mintzer C: Malnutrition-induced impairment of
resistance against experimental pulmonary tuberculosis. Prog Clin Biol Res
1990, 325:403-412.
6. Slater AF, Keymer AE: Epidemiology of Heligmosomoides polygyrus in
mice: experiments on natural transmission. Parasitology 1986, 93(Pt
1):177-187.
7. Fillol F, Sarr JB, Boulanger D, Cisse B, Sokhna C, Riveau G, Simondon KB,
Remoue F: Impact of child malnutrition on the specific anti-Plasmodium
falciparum antibody response. Malar J 2009, 8:116.
8. Brooks WA, Yunus M, Santosham M, Wahed MA, Nahar K, Yeasmin S,
Black RE: Zinc for severe pneumonia in very young children: doubleblind placebo-controlled trial. Lancet 2004, 363:1683-1688.
9. Cermelli C, Vinceti M, Scaltriti E, Bazzani E, Beretti F, Vivoli G, Portolani M:
Selenite inhibition of Coxsackie virus B5 replication: implications on the
etiology of Keshan disease. J Trace Elem Med Biol 2002, 16:41-46.
10. Foster HD: Host-pathogen evolution: Implications for the prevention and
treatment of malaria, myocardial infarction and AIDS. Med Hypotheses
2008, 70:21-25.
11. Baum MK, Shor-Posner G, Lai S, Zhang G, Lai H, Fletcher MA,
Sauberlich H, Page JB: High risk of HIV-related mortality is associated
with selenium deficiency. J Acquir Immune Defic Syndr Hum Retrovirol
1997, 15:370-374.
12. Ogunro PS, Ogungbamigbe TO, Elemie PO, Egbewale BE, Adewole TA:
Plasma selenium concentration and glutathione peroxidase activity in
HIV-1/AIDS infected patients: a correlation with the disease progression.
Niger Postgrad Med J 2006, 13:1-5.
13. Ginde AA, Mansbach JM, Camargo CA Jr: Association between serum 25hydroxyvitamin D level and upper respiratory tract infection in the Third
National Health and Nutrition Examination Survey. Arch Intern Med 2009,
169:384-390.
14. Ginde AA, Mansbach JM, Camargo CA Jr: Vitamin D, respiratory infections,
and asthma. Curr Allergy Asthma Rep 2009, 9:81-87.
15. Howard JK, Lord GM, Matarese G, Vendetti S, Ghatei MA, Ritter MA,
Lechler RI, Bloom SR: Leptin protects mice from starvation-induced
lymphoid atrophy and increases thymic cellularity in ob/ob mice. J Clin
Invest 1999, 104:1051-1059.
16. Casanueva FF, Dieguez C: Neuroendocrine regulation and actions of
leptin. Front Neuroendocrinol 1999, 20:317-363.
17. Andrade CF, Gameiro J, Nagib PR, Carvalho BO, Talaisys RL, Costa FT,
Verinaud L: Thymic alterations in Plasmodium berghei-infected mice. Cell
Immunol 2008.
18. Aref GH, Abdel-Aziz A, Abdel-Moneim MA, Hebeishy NA, Rahmy AI: A postmortem study of the thymolymphatic system in protein energy
malnutrition. J Trop Med Hyg 1982, 85:109-114.
19. Bodey B, Bodey B Jr, Siegel SE, Kaiser HE: Intrathymic non-lymphatic
hematopoiesis during mammalian ontogenesis. In Vivo 1998, 12:599-618.
20. Yarilin AA, Belyakov IM: Cytokines in the thymus: production and
biological effects. Curr Med Chem 2004, 11:447-464.
21. Najera O, Gonzalez C, Cortes E, Toledo G, Ortiz R: Effector T lymphocytes
in well-nourished and malnourished infected children. Clin Exp Immunol
2007, 148:501-506.
22. Chevalier P, Diagbouga S, Traore Y, Cassel-Beraud AM, Van de Perre P:
Thymic size and muscle mass of HIV-infected asymptomatic children
from Burkina Faso. J Acquir Immune Defic Syndr 2002, 29:427-428.
Ngom et al. Journal of Biomedical Science 2011, 18:41
/>
23. Garly ML, Trautner SL, Marx C, Danebod K, Nielsen J, Ravn H, Martins CL,
Bale C, Aaby P, Lisse IM: Thymus size at 6 months of age and subsequent
child mortality. J Pediatr 2008, 153:683-688, 688 e681-683.
24. Aaby P, Marx C, Trautner S, Rudaa D, Hasselbalch H, Jensen H, Lisse I:
Thymus size at birth is associated with infant mortality: a community
study from Guinea-Bissau. Acta Paediatr 2002, 91:698-703.
25. Prentice AM, Cole TJ: Seasonal changes in growth and energy status in
the Third World. Proc Nutr Soc 1994, 53:509-519.
26. Prentice AM, Whitehead RG, Roberts SB, Paul AA: Long-term energy
balance in child-bearing Gambian women. Am J Clin Nutr 1981,
34:2790-2799.
27. Greenwood BM, Pickering H: A malaria control trial using insecticidetreated bed nets and targeted chemoprophylaxis in a rural area of The
Gambia, west Africa. 1. A review of the epidemiology and control of
malaria in The Gambia, west Africa. Trans R Soc Trop Med Hyg 1993,
87(Suppl 2):3-11.
28. Rowland MG: The Gambia and Bangladesh: the seasons and diarrhoea.
Dialogue Diarrhoea 1986, 3.
29. Poskitt EM, Cole TJ, Whitehead RG: Less diarrhoea but no change in
growth: 15 years’ data from three Gambian villages. Arch Dis Child 1999,
80:115-119, discussion 119-120.
30. Beverley PC, Maini MK: Differences in the regulation of CD4 and CD8 Tcell clones during immune responses. Philos Trans R Soc Lond B Biol Sci
2000, 355:401-406.
31. Currier JR, Stevenson KS, Kehn PJ, Zheng K, Hirsch VM, Robinson MA:
Contributions of CD4+, CD8+, and CD4+CD8+ T cells to skewing within
the peripheral T cell receptor beta chain repertoire of healthy
macaques. Hum Immunol 1999, 60:209-222.
32. Even J, Lim A, Puisieux I, Ferradini L, Dietrich PY, Toubert A, Hercend T,
Triebel F, Pannetier C, Kourilsky P: T-cell repertoires in healthy and
diseased human tissues analysed by T-cell receptor beta-chain CDR3
size determination: evidence for oligoclonal expansions in tumours and
inflammatory diseases. Res Immunol 1995, 146:65-80.
33. Cawthon RM: Telomere measurement by quantitative PCR. Nucleic Acids
Res 2002, 30:e47.
34. Douek DC, McFarland RD, Keiser PH, Gage EA, Massey JM, Haynes BF,
Polis MA, Haase AT, Feinberg MB, Sullivan JL, Jamieson BD, Zack JA,
Picker LJ, Koup RA: Changes in thymic function with age and during the
treatment of HIV infection. Nature 1998, 396:690-695.
35. Mueller SN, Jones CM, Stock AT, Suter M, Heath WR, Carbone FR: CD4+ T
cells can protect APC from CTL-mediated elimination. J Immunol 2006,
176:7379-7384.
36. Hung K, Hayashi R, Lafond-Walker A, Lowenstein C, Pardoll D, Levitsky H:
The central role of CD4(+) T cells in the antitumor immune response. J
Exp Med 1998, 188:2357-2368.
37. Blotta MH, Marshall JD, DeKruyff RH, Umetsu DT: Cross-linking of the CD40
ligand 1 on human CD4+ T lymphocytes generates a costimulatory
signal that up-regulates IL-4 synthesis. J Immunol 1996, 156:3133-3140.
38. Staszewski S, Miller V, Sabin C, Schlecht C, Gute P, Stamm S, Leder T,
Berger A, Weidemann E, Hill A, Phillips A: Determinants of sustainable CD4
lymphocyte count increases in response to antiretroviral therapy. Aids
1999, 13:951-956.
39. Prentice A, Watkinson M, Prentice AM, Cole TJ, Whitehead RG: Breast-milk
antimicrobial factors of rural Gambian mothers. II. Influence of season
and prevalence of infection. Acta Paediatr Scand 1984, 73:803-809.
40. Lisse IM, Aaby P, Whittle H, Knudsen K: A community study of T
lymphocyte subsets and malaria parasitaemia. Trans R Soc Trop Med Hyg
1994, 88:709-710.
41. Worku S, Bjorkman A, Troye-Blomberg M, Jemaneh L, Farnert A,
Christensson B: Lymphocyte activation and subset redistribution in the
peripheral blood in acute malaria illness: distinct gammadelta+ T cell
patterns in Plasmodium falciparum and P. vivax infections. Clin Exp
Immunol 1997, 108:34-41.
42. Sazawal S, Jalla S, Mazumder S, Sinha A, Black RE, Bhan MK: Effect of zinc
supplementation on cell-mediated immunity and lymphocyte subsets in
preschool children. Indian Pediatr 1997, 34:589-597.
43. van der Sande MA, Waight PA, Mendy M, Zaman S, Kaye S, Sam O, Kahn A,
Jeffries D, Akum AA, Hall AJ, Bah E, McConkey SJ, Hainaut P, Whittle HC:
Long-term protection against HBV chronic carriage of Gambian
adolescents vaccinated in infancy and immune response in HBV booster
trial in adolescence. PLoS One 2007, 2:e753.
Page 10 of 11
44. Maini MK, Reignat S, Boni C, Ogg GS, King AS, Malacarne F, Webster GJ,
Bertoletti A: T cell receptor usage of virus-specific CD8 cells and
recognition of viral mutations during acute and persistent hepatitis B
virus infection. Eur J Immunol 2000, 30:3067-3078.
45. Maini MK, Boni C, Lee CK, Larrubia JR, Reignat S, Ogg GS, King AS,
Herberg J, Gilson R, Alisa A, Williams R, Vergani D, Naoumov NV, Ferrari C,
Bertoletti A: The role of virus-specific CD8(+) cells in liver damage and
viral control during persistent hepatitis B virus infection. J Exp Med 2000,
191:1269-1280.
46. Allsopp RC, Chang E, Kashefi-Aazam M, Rogaev EI, Piatyszek MA, Shay JW,
Harley CB: Telomere shortening is associated with cell division in vitro
and in vivo. Exp Cell Res 1995, 220:194-200.
47. McFarland RD, Douek DC, Koup RA, Picker LJ: Identification of a human
recent thymic emigrant phenotype. Proc Natl Acad Sci USA 2000,
97:4215-4220.
48. Lewin SR, Ribeiro RM, Kaufmann GR, Smith D, Zaunders J, Law M,
Solomon A, Cameron PU, Cooper D, Perelson AS: Dynamics of T cells and
TCR excision circles differ after treatment of acute and chronic HIV
infection. J Immunol 2002, 169:4657-4666.
49. Hazenberg MD, Otto SA, Cohen Stuart JW, Verschuren MC, Borleffs JC,
Boucher CA, Coutinho RA, Lange JM, Rinke de Wit TF, Tsegaye A, van
Dongen JJ, Hamann D, de Boer RJ, Miedema F: Increased cell division but
not thymic dysfunction rapidly affects the T-cell receptor excision circle
content of the naive T cell population in HIV-1 infection. Nat Med 2000,
6:1036-1042.
50. Lisse IM, Poulsen AG, Aaby P, Normark M, Kvinesdal B, Dias F, Molbak K,
Knudsen K: Immunodeficiency in HIV-2 infection: a community study
from Guinea-Bissau. Aids 1990, 4:1263-1266.
51. Lisse IM, Whittle H, Aaby P, Normark M, Gyhrs A, Ryder LP: Labelling of T
cell subsets under field conditions in tropical countries. Adaptation of
the immuno-alkaline phosphatase staining method for blood smears. J
Immunol Methods 1990, 129:49-53.
52. Kestens L, Brattegaard K, Adjorlolo G, Ekpini E, Sibailly T, Diallo K, Gigase PL,
Gayle H, De Cock KM: Immunological comparison of HIV-1-, HIV-2- and
dually-reactive women delivering in Abidjan, Cote d’Ivoire. Aids 1992,
6:803-807.
53. Lisse IM, Bottiger B, Christensen LB, Knudsen K, Aaby P, Gottschau A,
Urassa W, Mhalu F, Biberfeld G, Brattegaard K, Diallo K, N’Gom PT, Whittle H:
Evaluation of T cell subsets by an immunocytochemical method
compared to flow cytometry in four countries. Scand J Immunol 1997,
45:637-644.
54. Yao XS, Diao Y, Sun WB, Luo JM, Qin M, Tang XY: Analysis of the CDR3
length repertoire and the diversity of TCR alpha chain in human
peripheral blood T lymphocytes. Cell Mol Immunol 2007, 4:215-220.
55. Kou ZC, Puhr JS, Rojas M, McCormack WT, Goodenow MM, Sleasman JW: TCell receptor Vbeta repertoire CDR3 length diversity differs within
CD45RA and CD45RO T-cell subsets in healthy and human
immunodeficiency virus-infected children. Clin Diagn Lab Immunol 2000,
7:953-959.
56. Drakeley CJ, Akim NI, Sauerwein RW, Greenwood BM, Targett GA: Estimates
of the infectious reservoir of Plasmodium falciparum malaria in The
Gambia and in Tanzania. Trans R Soc Trop Med Hyg 2000, 94:472-476.
57. Mulholland K: Malaria vaccine in children under 12 months of age. Lancet
1995, 346:1554-1555.
58. Chotard J, Inskip HM, Hall AJ, Loik F, Mendy M, Whittle H, George MO,
Lowe Y: The Gambia Hepatitis Intervention Study: follow-up of a cohort
of children vaccinated against hepatitis B. J Infect Dis 1992, 166:764-768.
59. van der Sande MA, Kaye S, Miles DJ, Waight P, Jeffries DJ, Ojuola OO,
Palmero M, Pinder M, Ismaili J, Flanagan KL, Aveika AA, Zaman A, RowlandJones S, McConkey SJ, Whittle HC, Marchant A: Risk factors for and clinical
outcome of congenital cytomegalovirus infection in a peri-urban WestAfrican birth cohort. PLoS One 2007, 2:e492.
60. Bello C, Whittle H: Cytomegalovirus infection in Gambian mothers and
their babies. J Clin Pathol 1991, 44:366-369.
61. Garderet L, Dulphy N, Douay C, Chalumeau N, Schaeffer V, Zilber MT, Lim A,
Even J, Mooney N, Gelin C, Gluckman E, Charron D, Toubert A: The
umbilical cord blood alphabeta T-cell repertoire: characteristics of a
polyclonal and naive but completely formed repertoire. Blood 1998,
91:340-346.
62. Talvensaari K, Clave E, Douay C, Rabian C, Garderet L, Busson M, Garnier F,
Douek D, Gluckman E, Charron D, Toubert A: A broad T-cell repertoire
Ngom et al. Journal of Biomedical Science 2011, 18:41
/>
63.
64.
65.
66.
67.
68.
69.
Page 11 of 11
diversity and an efficient thymic function indicate a favorable long-term
immune reconstitution after cord blood stem cell transplantation. Blood
2002, 99:1458-1464.
Kirk GD, Lesi OA, Mendy M, Akano AO, Sam O, Goedert JJ, Hainaut P,
Hall AJ, Whittle H, Montesano R: The Gambia Liver Cancer Study: Infection
with hepatitis B and C and the risk of hepatocellular carcinoma in West
Africa. Hepatology 2004, 39:211-219.
Hastie ND, Dempster M, Dunlop MG, Thompson AM, Green DK, Allshire RC:
Telomere reduction in human colorectal carcinoma and with ageing.
Nature 1990, 346:866-868.
Burns JB, Lobo ST, Bartholomew BD: In vivo reduction of telomere length
in human antigen-reactive memory T cells. Eur J Immunol 2000,
30:1894-1901.
Hingorani R, Choi IH, Akolkar P, Gulwani-Akolkar B, Pergolizzi R, Silver J,
Gregersen PK: Clonal predominance of T cell receptors within the CD8+
CD45RO+ subset in normal human subjects. J Immunol 1993,
151:5762-5769.
Son NH, Murray S, Yanovski J, Hodes RJ, Weng N: Lineage-specific
telomere shortening and unaltered capacity for telomerase expression
in human T and B lymphocytes with age. J Immunol 2000,
165:1191-1196.
Blattman JN, Antia R, Sourdive DJ, Wang X, Kaech SM, Murali-Krishna K,
Altman JD, Ahmed R: Estimating the precursor frequency of naive
antigen-specific CD8 T cells. J Exp Med 2002, 195:657-664.
Weng NP: Telomere and adaptive immunity. Mech Ageing Dev 2008,
129:60-66.
doi:10.1186/1423-0127-18-41
Cite this article as: Ngom et al.: Thymic function and T cell parameters
in a natural human experimental model of seasonal infectious diseases
and nutritional burden. Journal of Biomedical Science 2011 18:41.
Submit your next manuscript to BioMed Central
and take full advantage of:
• Convenient online submission
• Thorough peer review
• No space constraints or color figure charges
• Immediate publication on acceptance
• Inclusion in PubMed, CAS, Scopus and Google Scholar
• Research which is freely available for redistribution
Submit your manuscript at
www.biomedcentral.com/submit