Derivatives Demystified A Step-by-Step Guide to Forwards, Futures, Swaps and Options phần 2 docx
Bạn đang xem bản rút gọn của tài liệu. Xem và tải ngay bản đầy đủ của tài liệu tại đây (154.3 KB, 25 trang )
The Market Background 9
was up sharply, showing a rise of 65% over the period. Trading in equity index contracts in
the USA was boosted by the successful launch of an ‘e-mini
TM
’ futures contract on the S&P
500 index by CME, designed for electronic trading and targeted primarily at the retail market.
CHAPTER SUMMARY
A derivative is a product whose value depends on some other underlying asset such as a
commodity or a share or a bond or a foreign currency. Contracts are either traded on orga-
nized exchanges or agreed directly between two parties in the over-the-counter (OTC) market.
Exchange-traded contracts are generally standardized but carry the guarantee of the clearing
house associated with the exchange.
There are three main types of derivative product: forwards and futures; swaps; and options. A
forward is an agreement between two parties to deliver an asset in the future at a predetermined
price. Futures are the exchange-traded equivalent. A swap is an agreement between two parties
to exchange payments on regular dates for an agreed period of time. Each payment leg is
calculated on a different basis. In a standard or ‘plain vanilla’ interest rate swap one leg is
based on a fixed rate of interest and the other on a variable or floating rate of interest. A swap
is composed of a series of forward contracts. The holder of an option has the right but not
the obligation to buy (call) or to sell (put) an asset at a pre-set price. The other side of the
transaction is taken by the seller or writer of the option contract. Derivatives are used to manage
risk, to speculate on the prices of assets and to construct risk-free or arbitrage transactions.
The notional value of derivatives contracts outstanding globally at present amounts to trillions
of US dollars.
2
Equity and Currency Forwards
INTRODUCTION
A forward contract is an agreement made directly between two parties to buy and to sell a
commodity or financial asset:
r
on a specific date in the future;
r
at a fixed price that is agreed at the outset between the two parties.
Forwards are bilateral over-the-counter (OTC) transactions, and at least one of the two
parties concerned is normally a bank or some other financial institution. OTC transactions are
used extensively by corporations, traders and investing institutions who are looking for a deal
that is tailored to meet their specific requirements. Futures are similar in their economic effects
but are standardized contracts traded on organized and regulated exchanges (see Chapters 4
and 5). Forwards involve counterparty risk – the risk that the other party to the deal may default
on its contractual obligations.
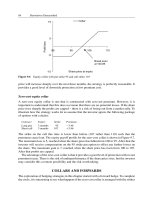
Suppose that a trader agrees today to buy a share in one year’s time at a fixed price of $100.
This is a forward purchase of the share, also called a long forward position. The graph in
Figure 2.1 shows the trader’s potential profits and losses on the deal for a range of possible
share values at the point of delivery. For example, if the share is worth $150 in one year’s time,
then the trader buys it through the forward contract and can sell it immediately, achieving a
$50 profit. However, if the share is only worth $50 in one year’s time, then the trader is still
obliged to buy it for $100. The loss in that instance is $50.
The other party to the transaction – the counterparty – has agreed to sell the share to the trader
in one year’s time for a fixed price of $100. This is a forward sale, also called a short forward
position. If the share is trading below $100 at the point of delivery then the counterparty
will make money on the deal – he or she can buy it for less than $100 and then deliver it
via the forward contract and receive exactly $100. On the other hand, if the share is worth
more than $100 in one year’s time then the counterparty will lose money on the forward deal.
Figure 2.2 illustrates the profit and loss profile of the short forward position at the point of
delivery.
THE FORWARD PRICE
A forward contract involves the two parties agreeing to buy and to sell an asset on a future date at
a fixed price. This rather begs the question: how can they possibly agree on what is a fair or rea-
sonable price for delivery on some date in the future? The standard answer is provided by what is
knownin the world of derivatives as a cash-and-carry calculation. This methodology is based on
the assumption that arbitrage opportunities should not be available in an active and efficient mar-
ket. An arbitrage is a set of transactions in which risk-free profits are achieved, because assets
are being mispriced in the market. Some traders refer to this type of opportunity as a ‘free lunch’.
12 Derivatives Demystified
-50
-30
-10
10
30
50
50 70 90 110 130 150
Share price at expiry
Net P&L per share
Figure 2.1 Share bought forward at $100: profit/loss at point of delivery
-50
-30
-10
10
30
50
50 70 90 110 130 150
Share price at expiry
Net P&L per share
Figure 2.2 Share sold forward at $100: profit/loss at delivery
To illustrate the methodology, let us suppose that a share is trading at $10 in the cash market –
the market for buying and selling securities for ‘spot’ or immediate delivery. We are contacted
by a client who would like to buy the share in exactly one year at a predetermined price. How
can we determine a fair price for this forward contract? We could take a view on the level at
which the share is most likely to be trading at the point of delivery, perhaps by contacting a
sample of research analysts or by inspecting charts of the recent price performance of the share
and forecasting future movements. The problem is that this is all highly speculative. If we get
it wrong and set the forward price – the price at which we will sell the share to the client after
one year – at too low a level, the deal could result in substantial losses.
Is there a way of establishing a fair price for the forward contract without having to take
this risk? The simple answer is ‘yes’. We borrow $10 and buy the share in the cash or spot
Equity and Currency Forwards 13
Spot + 1 year
Borrow $10 Principal repayment = -$10
Buy 1 share cost -$10 Interest = -$0.60
Dividend income = $0.20
Net cash flow = -$10.40
Figure 2.3 Cash flows resulting from carrying a share for one year
market, then hold or ‘carry’ it for one year so that it is available for delivery to our client at that
point. Suppose that the one-year interest rate is 6% p.a. and that the share is expected to pay
a dividend of $0.20 during the year ahead. In one year’s time we will have to repay the $10
borrowed plus $0.60 interest, though the funding cost is partially offset by the $0.20 dividend
received. Figure 2.3 shows the cash flows that result from ‘carrying’ the position in the share
in order to deliver it in one year’s time to our client.
The net cash flow in one year’s time arising from carrying the share is minus $10.40.
Therefore, just to break even on the transaction, we will have to charge the client at least
$10.40 to deliver the share through the forward contract. Thus $10.40 is the fair or theoretical
forward price established through a cash-and-carry calculation.
Components of the forward price
The theoretical forward price of $10.40 that we calculated has two components: the cost of
buying the share in the spot market, and the net cost of carrying it for delivery to our client
in one year’s time. The carry cost in turn has two components: the funding charge (interest
payable) minus the dividends received on the share.
Break-even forward price = Cash + Net cost of carry
$10.40 = $10 + ($0.60 − $0.20)
Net cost of carry = Funding cost −Dividend income
$0.40 = $0.60 − $0.20
Properly speaking, the net cost of carry is likely to be slightly less than this because the dividend
payment received during the course of the year can be re-invested. Ignoring this factor, however,
suppose that we could actually enter into a forward contract with a client today in which we
agree to sell the client the share in one year’s time at a fixed price of (say) $10.50. We promptly
agree the deal and at the same time we:
r
borrow $10 and buy the share in the cash market;
r
hold the share for one year, earning a dividend of $0.20.
After one year we repay the principal plus interest on the loan of $10.60.
Adding back the dividend receipt, the net cash flow is minus $10.40. If we are locked into
a forward contract in which we can definitely sell the share in one year’s time and receive
14 Derivatives Demystified
$10.50 from our client, we will make a profit of 10 cents per share. In theory this is risk-free
(it is an arbitrage profit) although in practice there may be some concern over whether our
counterparty on the forward contract might default on the deal. If we can insure ourselves
against this eventuality at a cost of less than 10 cents, then we really have achieved an arbitrage
profit.
In the real world, ‘free lunches’ of this nature should not persist for very long. Traders
would rush in to sell the share forward for $10.50, simultaneously buying it in the cash market
for $10 funded by borrowings. The effect would be to push the forward price back towards a
level at which the arbitrage opportunity disappears (it may also pull up the cash price of the
share). What keeps the forward price ‘honest’, i.e. at or around the fair value calculated by the
cash-and-carry method (in this example $10.40), is the potential for arbitrage profits.
If the forward price in the market is below fair value, traders will buy forward contracts
and short the share. In practice, shorting is achieved by borrowing the share with a promise to
return it to the original owner at a later date; it is then sold on the cash market and the proceeds
deposited in the money market to earn interest. The effect of traders buying forward contracts
and shorting the underlying will be to pull the forward price back up towards its theoretical or
fair value.
In reality the forward price of a financial asset such as a share or a bond can diverge to some
extent from the theoretical value established using the simple cash-and-carry method, before
arbitrage becomes possible. Transaction costs enter into the equation. Buying and holding a
share or a bond involves the payment of brokerage and other fees. Maintaining a short position
involves borrowing the asset and paying fees to the lender.
How does the cash-and-carry method work with forward contracts on non-financial assets?
It is commonly applied to gold and silver, which are held for investment purposes. However,
the method has to be treated with extreme caution in the case of commodities, which are assets
that are held primarily for the purposes of consumption.
With some commodities (such as fresh fruit) it simply does not apply at all, since storage
for delivery on a future date is not a practical proposition. In other cases it is of limited
application. Oil is a case in point. Quite often the spot price of oil is actually higher than the
forward or futures price in the market, although the simple cash-and-carry method suggests
that the situation should be the complete reverse. One explanation is that large consumers are
prepared to pay a premium to buy oil in the spot market, so that they can hold it in inventory
and ensure continuity of supply.
Forward price and expected payout
It is customary to think of the forward price of an asset as the expected future spot price on the
delivery date. In other words, the forward price is seen as a prediction of what the price of the
asset will actually be in the future, based on all the available evidence at the time the forward
is agreed (and subject to later revision based on new evidence).
There is at least one reason to believe this proposition: if forward prices were biased or
skewed in some way it would be possible to construct profitable trading strategies. Suppose
that forward prices in the market have a systematic tendency to underestimate the actual spot
prices on future dates. Then a trader who consistently bought forward contracts would tend to
make money on deals more often than he or she lost money. In some ways this seems unlikely
although, following arguments proposed by the economist John Maynard Keynes, it has been
suggested that this phenomenon actually does exist and the ensuing profits serve to attract
Equity and Currency Forwards 15
speculators into the market. There has been a great deal of empirical investigation into whether
or not forward and futures prices are in fact biased in some way, although overall the results
are still inconclusive.
If we assume that the forward price of an asset is the expected spot price on the future delivery
date, this has important implications. It is an expectation based on the currently available
evidence. As a forward contract moves towards the point of delivery new information will be
received, changing the expectation. If this is random information, some of it will be ‘good
news’ for the price of the underlying asset and some ‘bad news’. There is thus a chance that at
the point of delivery the underlying will actually be above the value that was expected when
the forward contract was initially agreed, but there is also a chance that it will be below that
value. If the new information is indeed random we could say that there is a 50:50 chance that
the spot price will be above (or below) that initially expected value. Therefore the chance of
making or losing money on a forward contract is about 50:50 and the average payout from the
deal is approximately zero.
This result is actually suggested by in Figures 1.1 and 1.2. The forward delivery price in this
example was $100. Assume that this is the expected spot price at the point of delivery and that
there is a 50:50 chance that the underlying will be above (or below) that value when delivery
takes place. Then the buyer of the forward has a 50% chance of making money on the deal and
a 50% chance of losing. The buyer’s average payout (averaging out the potential profits and
loses) is zero.
The seller of the forward also has an average payout of zero. It follows from this that neither
party should pay a premium to the other at the outset to enter into the forward contract, since
there is no initial advantage to either side. Note that the situation is completely different with
options. The buyer of an option pays premium to the seller precisely because he or she does
have an initial advantage – the right to exercise the contract in favourable circumstances but
otherwise to let it expire.
FOREIGN EXCHANGE FORWARDS
A spot foreign exchange (FX) deal is an agreement between two parties to exchange two
currencies at an fixed rate in (normally) two business days’ time. The notable exception is
for deals involving the US dollar and the Canadian dollar, in which case the spot date is one
business day after the trade has been agreed. The day when the two currencies are actually
exchanged is called the value date. A spot deal is said by traders and other market participants
to be ‘for value spot’. An outright forward foreign exchange deal is:
a firm and binding commitment between two parties . . .
to exchange two currencies . . .
at an agreed rate . . .
on a future value date that is later than spot.
The two currencies are not actually exchanged until the value date is reached, but the rate
is agreed on the trade date. Outright forwards are used extensively by companies that have
to make payments or are due to receive cash flows in foreign currencies on future dates. A
company can agree a forward deal with a bank and lock into a known foreign exchange rate,
thus eliminating the risk of losses resulting from adverse foreign exchange rate fluctuations.
The other side of the coin, of course, is that the contract must be honoured even if the company
could subsequently obtain a better exchange rate in the spot market. In effect the company
16 Derivatives Demystified
surrenders any potential gains resulting from favourable movements in currency exchange
rates in return for certainty.
As we will see, the outright forward exchange rates quoted by banks are determined by the
spot rate and the relative interest rates in the two currencies. Traders sometimes talk about
this in terms of the relative carry cost of holding positions in the two currencies. In effect, the
forward FX rate is established through a hedging or arbitrage argument – what it would cost a
bank to hedge or cover the risks involved in entering into an outright forward deal. If a forward
rate moves out of alignment with its fair or theoretical value, then this creates the potential for
a risk-free or arbitrage profit.
MANAGING CURRENCY RISK
This section illustrates the practical applications of outright forwards with a short example.
The case considers a US company that has exported goods to its client, an importer in the UK.
The British firm will pay for the goods in pounds sterling; the agreed sum is £10 million; and
the payment is due in two months’ time.
The current spot rate is £/$ 1.5, which means that one pound buys 1.5 US dollars. If the
invoice was due for immediate settlement, then the US company could sell the £10 million
on the spot foreign exchange market and receive in return $15 million. However the payment
is due in the future. If the pound weakens over the next two months, the US firm will end
up with fewer dollars, potentially eliminating its profit margin from the export transaction. To
complete the picture, we will suppose that the company incurs total costs of $13.5 million on
the deal and aims to achieve a margin over those costs of at least 10%.
Table 2.1 shows a range of possible £/$ spot rates in two months’ time, when the US firm
will be paid the £10 million. The second column calculates the amount of dollars the company
would receive for selling those pounds at that spot rate. The third column shows its profit or
loss on the export transaction assuming that its dollar costs on the deal are $13.5 million. The
final column calculates the margin achieved over the dollar costs.
If the spot exchange rate in two months’ time is 1.5 then the US exporter will receive
$15 million from selling the £10 million paid by its client. The profit in dollars is $1.5 million
and the margin achieved (over the dollar costs incurred) is 11%. On the other hand, if the spot
rate turns out to be 1.4 then the company will receive only $14 million for selling the pounds;
Table 2.1 Profit and profit margin for different spot exchange rates
Spot rate Received ($) Profit or loss ($) Margin over cost (%)
1.0 10 000 000 −3 500 000 −26
1.1 11 000 000 −2 500 000 −19
1.2 12 000 000 −1 500 000 −11
1.3 13 000 000 −500 000 −4
1.4 14 000 000 500 000 4
1.5 15 000 000 1 500 000 11
1.6 16 000 000 2 500 000 19
1.7 17 000 000 3 500 000 26
1.8 18 000 000 4 500 000 33
1.9 19 000 000 5 500 000 41
2.0 20 000 000 6 500 000 48
Equity and Currency Forwards 17
the profit is $500 000 but the margin is well below target at approximately 4%. This could have
a serious impact on the profitability of the business – and the future prospects of the senior
management!
There is a chance, of course, that the pound might strengthen over the next two months. If it
firms up to 1.6 dollars then the US exporter’s profit margin is a healthy 19%. The management
might be tempted by this thought, but if so they are simply speculating on foreign exchange
rates. Does the company have any special expertise in forecasting currency movements? Many
firms believe that they do not, and actively hedge out their foreign currency exposures. The
next section explores how the US exporter could manage its currency risks by using an outright
forward foreign exchange deal.
HEDGING WITH FX FORWARDS
The US company approaches its relationship bankers and enters into a two-month outright
forward FX deal. The agreed rate of exchange is £/$ 1.4926. The deal is constructed such that
in two months’ time:
the company will pay the £10 million to the bank . . .
and will receive in return $14.926 million.
The currency amounts are fixed, regardless of what the spot rate in the market happens to be
at the point of exchange. The forward contract is a legal and binding obligation and must be
fulfilled by both parties to the agreement. Table 2.2 compares the results for the US company
of hedging its currency exposure using the FX forward and of leaving the risk uncovered.
Column (1) shows a range of possible spot rates in two months’ time. Column (2) indicates
what would happen if the company left its currency exposure unhedged; it calculates the dollars
received from selling the £10 million due at that point at the spot rate. Column (3) shows that
if the forward deal is agreed at a rate of £/$ 1.4926 the US company will always receive
exactly $14.926 million. Column (4) calculates the difference between columns (2) and (3);
for example, if the spot rate in two months is at parity, the company would lose $4.926 million
as a result of not having entered into the forward FX deal.
Table 2.2 Dollars received by US exporter unhedged and hedged
(1) (2) (3) (4)
Received at Received at
Spot rate spot rate ($) forward rate ($) Difference ($)
1.0 10 000 000 14 926 000 −4 926 000
1.1 11 000 000 14 926 000 −3 926 000
1.2 12 000 000 14 926 000 −2 926 000
1.3 13 000 000 14 926 000 −1 926 000
1.4 14 000 000 14 926 000 −926 000
1.5 15 000 000 14 926 000 74 000
1.6 16 000 000 14 926 000 1 074 000
1.7 17 000 000 14 926 000 2 074 000
1.8 18 000 000 14 926 000 3 074 000
1.9 19 000 000 14 926 000 4 074 000
2.0 20 000 000 14 926 000 5 074 000
18 Derivatives Demystified
10
11
12
13
14
15
16
17
18
19
20
1.0 1.1 1.2 1.3 1.4 1.5 1.6 1.7 1.8
1.9
2.0
Spot rate in two months
$m
Unhedged Hedged
Figure 2.4 Dollars received hedged and unhedged
The results from the table are shown in Figure 2.4. The dotted line in the graph shows the fixed
amount of dollars the exporter will receive if it enters into the outright forward FX transaction.
The solid line is the quantity of dollars it will receive if it leaves the currency exposure unhedged.
If it agrees to sell the pounds forward to its bank at a rate of 1.4926, the US company will
receive exactly $14.926 million in return. Its total costs from the export transaction amount
to $13.5 million, so it would achieve a margin over cost of 10.6%, comfortably over its target
rate of 10%. The hedge has achieved its purpose.
THE FORWARD FX RATE
The theoretical or fair rate for entering into an outright forward foreign exchange deal is
established by the spot exchange rate and the interest rates on the two currencies involved.
In fact, it is a cash-and-carry calculation. In the previous section the US company hedged its
currency exposure by selling pounds for dollars at a forward exchange rate of 1.4926. Is this a
fair rate or not? To help to answer this question, let us suppose that we have some additional
market information.
r
£/$ spot foreign exchange rate = 1.5
r
US dollar interest rate = 3% p.a. = 0.5% for two months
r
Sterling interest rate = 6% p.a. = 1% for two months.
To simplify matters we will assume here that there are no ‘spreads’ in the market, that the
interest rates for borrowing and lending funds are exactly the same, and that the spot exchange
rates for buying and for selling pounds are exactly the same. In practice money dealers charge
a spread between their borrowing and lending rates, and currency traders quote a spread
between their buy (bid) and sell (offer or ask) rates. According to the data available, one pound
equals 1.5 US dollars on the spot FX market. Pounds can be invested for two months at an
interest rate of 1% for the period. Dollars can be invested at a period rate of 0.5%. Figure 2.5
Equity and Currency Forwards 19
Spot + 2 months
£100 £101
$150 $150.75
Figure 2.5 Results of investing pounds and dollars for two months
illustrates the results of investing £100 and $150 respectively for two months at those interest
rates.
In the spot market £100 equals $150. However £100 invested today would grow to £101 in
two months’ time. $150 would grow at a somewhat slower rate because the dollar interest rate
is lower. In two months it would be worth $150.75. This tells us the value of a pound against
the US dollar in two months’ time.
£101 = $150.75
So: £1 = 150.75/101 = $1.4926
This is the fair or theoretical two-month forward exchange rate. Forward deals agreed in the
market must be contracted at or around this level otherwise arbitrage opportunities are created.
To see why this is the case, suppose that dealers are actually prepared to enter into forward
FX deals in which the two currencies will be exchanged in two months’ time at a different
rate, say at the current spot rate of £1 = $1.5. Then an arbitrageur could step in and set up the
following deals today.
r
Borrow $150 for two months at a period interest rate of 0.5%.
r
Sell the $150 in the spot foreign exchange market and receive £100.
r
Deposit the £100 for two months at a period interest rate of 1%. At maturity the sterling
deposit, including interest, will have grown to £101.
At the same time, the arbitrageur would enter into an outright forward FX contract agreeing
to sell the £101 due in two months’ time for dollars at a rate of £/$ 1.5. After two months the
arbitrageur unwinds all the transactions as follows.
r
Repay the $150 borrowed plus interest, which equals $150.75.
r
Receive back the £100 deposited, which with 1% interest equals £101.
r
Sell the £101 for dollars under the terms of the forward contract and receive 101 ×1.5 =
$151.5.
As a result the arbitrageur will make a risk-free profit of $151.5 −$150.75 =$0.75, irrespective
of what has happened to exchange rates in the meantime. If the transaction was based on
$15 million rather than $150, then the profit would be $75,000. This profit is generated on the
assumption that pounds can be sold for delivery in two months’ time at a rate of £1 = $1.5.
If the rate was £1 = $1.4926 then the arbitrage profit disappears (give or take some rounding
in the figures). This simple example demonstrates why forward FX deals are transacted at
or around the theoretical fair value. If they are not, then traders will quickly rush in to create
arbitrage deals, and the actual market rate will move back towards its theoretical or equilibrium
value. In practice, dealing spreads and transaction costs complicate the story a little but the
general principle still holds.
20 Derivatives Demystified
FORWARD POINTS
In the example worked through above it is noticeable that the theoretical forward FX rate of
1.4926 is lower than the spot rate of 1.5. Market practitioners would say that the pound is at a
discount relative to thedollar for delivery intwo months. In other words, it buys fewer US dollars
compared to the spot rate. This results from the different interest rates in the two currencies. The
sterling rate was assumed to be 6% p.a. and the dollar rate 3% p.a. The situation can be explained
in economic terms. There are a number of reasons why investors might demand a higher return
for holding sterling compared to US dollar investments, and two main possibilities may be:
r
Sterling-denominated assets are riskier.
r
Investors believe that the real value of sterling assets will be eroded at a faster rate because
the pound has a higher rate of inflation compared to the US dollar.
There could be other reasons. For example, international investors might place a lower level
of trust in the conduct of monetary policy in the UK. It is clear, however, that inflation and
concerns about inflation are major factors. If investors anticipate that the pound will suffer from
higher inflation than the US dollar they will demand higher returns on sterling-denominated
assets in compensation. Also, the pound will trade at a discount against the dollar for forward
delivery as its real value in terms of purchasing power is eroding at a faster rate. Market
practitioners often quote currency forwards in terms of the discount or premium in forward
points compared to the spot rate. For example:
Spot rate = 1.5000
Forward rate = 1.4926
Forward points =−0.0074 (discount)
This is a discount of 74 points, where one point represents $0.0001; therefore, 74 points equals
$0.0074 per pound sterling.
FX SWAPS
An FX swap is the combination of a foreign exchange deal (normally for value spot) and a
later-dated outright forward deal in the opposite direction. Both deals are made with the same
counterparty and one of the currency amounts in the deal is normally kept constant. If the first
leg of the swap is for a value date later than spot, then the transaction is called a forward-
forward swap. The following example of an FX swap transaction uses the same spot rate and
interest rates from previous sections.
£/$ spot rate = 1.5
Sterling two-month interest rate = 6% p.a.
US dollar two-month interest rate = 3% p.a.
£/$ two-month forward rate = 1.4926
Imagine that a customer contracts a bank and agrees an FX swap transaction with the following
terms:
r
Spot leg. The customer sells the bank £10 million and receives in return $15 million (at the
spot rate).
Equity and Currency Forwards 21
Spot + 2 months
- £10 million + £10 million
+ $15 million - $14.926 million
Figure 2.6 FX swap cash flows
r
Forward leg. In two months’ time the customer is repaid the £10 million by the bank and
pays in return $14.926 million (at the two-month forward exchange rate).
The customer only pays back $14.926 million on the forward leg, despite having received
$15 million spot. The difference between the two amounts is $74 000. Why is there a difference?
It is determined by the interest rate differential between the two currencies. For the period of
the FX swap the customer is moving out of a higher return currency (the pound) and into a
lower return currency (the dollar) and must be compensated. In effect, the $74 000 is the cost
of the interest rate differential between the two currencies expressed in US dollars (the sterling
amount is kept constant in the deal). The cash flows resulting from the FX swap transaction
viewed from the customer’s perspective are illustrated in Figure 2.6.
By comparison, if a client enters into an FX swap with a bank and moves from a lower
to a higher interest rate currency, it will pay back more of that higher rate currency on the
forward leg than it receives on the spot leg of the swap (assuming the lower interest rate
currency amount is held constant). In this case the client would have to compensate the bank for
receiving the benefit of moving into the higher interest currency for the lifetime of the FX swap
transaction.
APPLICATIONS OF FX SWAPS
Pension fund managers can use an FX swap to transfer cash into a foreign currency for a
predetermined period of time, to increase diversification and boost returns by investing in
foreign shares and bonds. The foreign currency purchased on the spot leg of the swap will be
exchanged back into domestic currency at a fixed rate on the forward leg of the swap. This
helps to manage the currency risks associated with purchasing overseas assets.
FX swaps are also used by banks to manage cash flows resulting from currency and money
market transactions. For example, the swap illustrated in Figure 2.6 might be entered into
by a commercial bank which has to pay $15 million spot. It notices that it is also receiving
£10 million on that day. Rather than borrowing the dollars, it sells its excess pounds for dollars
in the spot leg of the FX swap, thereby covering its cash flows on the spot date. The result of
the FX swap is to move the bank’s sterling and dollar positions forward in time by two months,
without actually having to borrow or lend out funds on the money market.
The effect is illustrated in Figure 2.7. This can be a very efficient technique since, unlike
borrowingand lending money,the FX swap does not use the bank’s balance sheet. It is structured
as a spot deal combined with a commitment to re-exchange the two currencies in two months’
time.
22 Derivatives Demystified
Spot + 2 months
+ £10 million
- $15 million
Spot cash flows
- £10 million
FX swap
+ £10 million
+ $15 million - $14.926 million
Figure 2.7 Using an FX swap to manage cash flows
CHAPTER SUMMARY
A forward contract is an agreement between two parties to deliver a commodity or a financial
asset on a future date at a predetermined price. In many cases the fair or theoretical forward
price can be determined through a cash-and-carry calculation. This is based on what it would
cost the seller of the forward to cover his or her risks on the deal by buying the asset in the
cash market and holding or carrying it to deliver on the date specified in the forward contract.
If it is possible to buy or a sell a forward contract at a price other than the fair price then
(subject to transaction costs) it may be possible to construct profitable arbitrage transactions.
At a fair value the average or expected payout from a forward is zero, therefore, unlike an
option, neither party to the deal owes the other an initial premium. With certain assets such as
perishable commodities that cannot be stored or shorted the cash-and-carry method does not
apply.
Outright forward foreign exchange deals are extensively used by investing institutions, banks
and corporations to hedge against the risks posed by fluctuations in currency exchange rates.
The fair forward rate is determined by the spot rate and the interest rates in the two currencies.
A foreign exchange or FX swap is the combination of a foreign exchange deal and an outright
forward deal with a later value date in the opposite direction. Normally one currency amount is
held constant. FX swaps are used by banks to manage their cash flows in different currencies and
by fund managers who wish to hedge the risks associated with investing in assets denominated
in foreign currencies.
3
Forward Rate Agreements
INTRODUCTION
A forward rate agreement (FRA) is a bilateral contract fixing the rate of interest that will apply
to a notional principal sum of money for an agreed future time period. In fact the notional
principal never changes hands. It is simply used to calculate the compensation or settlement
amount that is paid by one party to the other. One side is said to be the buyer and the other the
seller.
r
Buyer. The buyer of the FRA is compensated in cash by the seller if the reference or
benchmark interest rate for the contract period turns out to be above that agreed in the
contract.
r
Seller. The seller of the FRA contract is compensated by the buyer if the benchmark interest
rate turns out to be below the contractual rate.
The natural buyers of FRAs are corporate borrowers who wish to hedge against rising interest
rates. Money market investors who wish to protect against declining interest rates are natural
sellers of FRAs. An FRA is a derivative instrument because its value is derived from spot or
cash market interest rates, that is, the interest rates on deposits and loans starting now rather
than in the future.
FRAs are very similar to the short interest rate futures contracts traded on the exchanges
(Chapter 5) except that FRAs are over-the-counter (OTC) transactions. As we have seen, an
OTC derivative contract is a legal and binding agreement made directly between two parties.
As such it cannot be freely traded and carries a counterparty risk – the risk that the other party
to the deal might fail to fulfil its obligations. On the other hand, the terms of the contract
are flexible and can easily be customized. FRAs are now dealt by banks in a wide range of
currencies and contract periods.
FRA APPLICATION: CORPORATE BORROWER
To illustrate the applications of the instrument, we will consider the case of a corporate borrower
that has an outstanding loan of £100 million. The interest rate on the loan is re-fixed twice a
year at six-month sterling LIBOR plus a margin of 50 basis points (0.50%) p.a.
LIBOR – the London Interbank Offered Rate – is the key benchmark interest rate that is
set every London business day by the British Bankers’ Association (BBA). It is the rate at
which top banks in the London market lend funds to each other. Because commercial banks
fund themselves at or around LIBOR, they lend money to customers at LIBOR plus a margin,
which earns a profit and provides some protection against the risk of default. LIBOR is quoted
for a variety of major currencies and a range of maturity periods. Six-month sterling LIBOR
is the London interbank rate for lending British pounds for a period of six months starting on
the day the rate is fixed by the BBA.
24 Derivatives Demystified
Table 3.1 Forward rate agreement terms
Notional principal: £100 million
Deal type: Client buys FRA
Contract rate: 5% p.a.
Start date: Now
Settlement date: In six months
Maturity date: In 12 months
Contract period: A six-month period starting in six months
Reference rate: Six-month BBA sterling LIBOR
In the case of our corporate, we will assume that the borrowing rate for the next six-month
period has just been fixed. However, the finance director is concerned that interest rates for
the subsequent time period might turn out to be appreciably higher; increased borrowing costs
would have a detrimental effect on the company’s profits, and potentially on the performance
of the share price. To protect against such an eventuality the financial director decides to buy
an FRA from a dealer. The terms of the contract are set out in Table 3.1.
The company will be compensated in cash by the FRA dealer if six-month sterling LIBOR
for the contract period turns out to be above the contractual rate of 5% p.a. If LIBOR is fixed
below 5% p.a. the company will have to make a settlement payment to the dealer. The payment
will be based on a notional principal of £100 million. Both parties, the company and the dealer,
sign the FRA contract, which is a legal and binding commitment. Typically deals are based on
outline legal terms drawn up by the British Bankers’ Association.
The settlement date in this case is six months after the contract starts. At that point the actual
BBA six-month sterling LIBOR rate for the period covered by the FRA will be known to both
parties. It will be announced on market information systems such as Reuters or Bloomberg.
If we suppose that the LIBOR rate gets set at 6% p.a., the dealer who sold the FRA will have
to compensate the company (the buyer) since LIBOR is above the contractual rate of 5% p.a.
The payment due at the FRA maturity date is calculated as follows (note that the interest rates
are expressed per annum but the FRA covers a six-month time period):
Compensation payment = £100 million × (6% – 5%) × 6/12
= £0.5 million
The company can then use this money to partially offset the interest payment it has to make
on its borrowings. It has a £100 million bank loan on which it pays a rate of interest of LIBOR
plus 0.5% p.a. If LIBOR for the period is fixed at 6% p.a. then its loan rate for the period will
be set at 6.5% p.a. Including the compensation payment received on the FRA, its payments
for the period are as follows:
Interest paid on loan = £100 million × 6.5% × 6/12 = £3.25 million
Less: Compensation received on FRA = £0.5 million
Net cost of borrowing = £2.75 million
Effective borrowing rate = £2.75 million / £100 million
= 2.75% per six months = 5.5% p.a.
Results of the FRA hedge
By entering into the FRA the corporate has in fact locked into an interest rate of 5.5% p.a.
for the period of time covered by the agreement. This is demonstrated in cash flow terms in
Forward Rate Agreements 25
Table 3.2 Effects of an FRA hedge
LIBOR fix Loan rate Interest FRA payment Net cash flow Effective rate
(% p.a.) (% p.a.) (
£m) (£m) (£m) (% p.a.)
4.0 4.5 −2.25 −0.50 −2.75 5.5
4.5 5.0 −2.50 −0.25 −2.75 5.5
5.0 5.5 −2.75 0.00 −2.75 5.5
5.5 6.0 −3.00 0.25 −2.75 5.5
6.0 6.5 −3.25 0.50 −2.75 5.5
6.5 7.0 −3.50 0.75 −2.75 5.5
7.0 7.5 −3.75 1.00 −2.75 5.5
Table 3.2. The first column shows a range of possible rates at which LIBOR might be fixed for
the contract period. The second and third columns calculate the company’s borrowing rate and
the interest cash flow on its loan in each circumstance. This is then combined with the FRA
compensation payment to establish the net cash flow for the period and the effective interest
rate paid by the company.
The results in Table 3.2 can be illustrated by a few examples.
r
LIBOR = 4% p.a. The company’s borrowing rate on its loan is 4.5% p.a. for the period. The
interest is £2.25 million for six months. LIBOR is below the FRA contract rate of 5% p.a.
Therefore the company has to pay the FRA dealer half of 1% of £100 million (for a six-
month period) which comes to £0.5 million. As its net borrowing cost is now £2.75 million,
effectively it is paying an annualized rate of 5.5% p.a. for the period.
r
LIBOR = 7% p.a. The borrowing cost on the loan is 7.5% p.a. The interest payment is
therefore £3.75 million. However a compensation payment of £1 million is due from the
FRA dealer. The net borrowing cost is now £2.75 million and the effective interest rate for
the period is 5.5% p.a.
The graph in Figure 3.1 shows the results from Table 3.2. The horizontal axis indicates a
range of possible LIBOR rates for the future time period covered by the FRA deal. The dotted
line shows the company’s effective rate of borrowing for the period if it bought the FRA. The
solid line shows what the borrowing rate would be if it had not purchased the FRA, i.e. if the
company had left the interest rate exposure unhedged.
If it buys the FRA the company is locked into a funding rate for the period of 5.5% p.a.
It is protected against increases in interest rates for that period. By the same token, however,
it cannot benefit from a fall in interest rates. The company may be prepared to take this risk
in return for certainty. If it fixes its borrowing cost for the period it may be easier to plan
its business operations, as one source of uncertainty has been eliminated. Hedging against
interest risk may also help to reduce the volatility of its earnings, and potentially boost the
share price.
FRA payment dates and settlement
The various dates relating to the FRA contract discussed in the previous sections are illustrated
in Figure 3.2. The notional is 100 million sterling. The start date is today. (By comparison
FRAs in dollars and euros normally start two business days after the deal is agreed.) The
26 Derivatives Demystified
4.5%
5.5%
6.5%
7.5%
4.0% 5.0% 6.0% 7.0%
LIBOR setting
Borrowing rate p.a.
Unhedged Hedged
Figure 3.1 Graph of FRA hedge vs unhedged position
Today
Start date
+ 6 months + 1 year
Settlement date Maturity date
Figure 3.2 Key dates on the FRA deal
contract period is a period of time starting in six months and ending 12 months from today. A
dealer would refer to this time period as 6v12 or 6x12.
In practice, the settlement amount on a FRA is normally paid up front on the settlement day
rather than at maturity, and by convention is discounted back at the LIBOR rate. If the LIBOR
rate for the contract period in our example was fixed at 6% p.a., then the compensation amount
would be calculated as follows:
Amount at maturity = £100 million × (6% − 5%) × 6/12
= £0.5 million
Amount if paid on settlement day =
£0.5 million
1 + (0.06 × 6/12)
= £485 437
The main reason why the payment is usually made on the settlement date rather at maturity
is because this helps to reduce credit risk. Both parties know what is owed and any delay in
payment increases the risk of default. If the compensation payment is made on the settlement
date then nothing at all actually happens on the maturity date of the FRA. However it has to
be stipulated in order to calculate the length of the contract period.
The FRA as two payment legs
Another way to look at the FRA deal in our case study is as a transaction with two dif-
ferent payment legs, as illustrated in Figure 3.3. Seen in this way, the FRA is a deal
Forward Rate Agreements 27
COMPANY
FRA
DEALER
5% p.a.
LIBOR
Figure 3.3 The FRA as two separate payment legs
COMPANY
FRA
DEALER
5% p.a.
LIBOR p.a.
LOAN
LIBOR + 0.5% p.a.
Figure 3.4 Loan plus FRA
in which:
r
the company pays the dealer a rate of 5% p.a. applied to £100 million for the six-month
contract period;
r
the dealer, in return, pays the company the actual LIBOR rate for that period applied to
£100 million;
r
the amounts from each leg are netted out and one side makes a cash compensation payment
to the other (discounted back to the settlement date).
For example, suppose that six-month sterling LIBOR for the contract period is fixed at 6% p.a.
The settlement or compensation amount would be calculated as follows:
r
The company owes £100 million × 5% × 6/12 = £2.5 million
r
The dealer owes £100 million × 6% × 6/12 = £3 million
r
Netted out, the dealer owes the company £0.5 million
r
If payment is made on the settlement date the dealer pays the discounted value £485 437.
Figure 3.4 shows the FRA agreement the company has entered into along with the underlying
loan it was seeking to hedge. It has achieved a net cost of borrowing for the contract period
equal to:
LIBOR + 0.5% − LIBOR + 5% p.a. = 5.5% p.a.
28 Derivatives Demystified
An FRA is a type of mini-interest rate swap (see Chapter 6). The main differences are
that in an interest rate swap there is a series of payments on future dates, not just one; and
the payments are normally made in arrears. The diagrams conventionally used to explain
the structure and applications of interest rate swap deals look very much like that shown in
Figure 3.4.
DEALING IN FRAs
The dealer in the case study explored in the previous sections of this chapter has sold an FRA
covering a period of time starting in six months and ending 12 months after the start date. The
forward interest rate agreed is 5% p.a. If this is the only deal on the dealer’s trading book then
there is an exposure to rising interest rates. If interest rates are set above 5% p.a., the dealer
will have to make a cash settlement payment to the buyer of the FRA.
The dealer may have a view that interest rates will fall, and may be quite content to assume
this risk. If the actual LIBOR rate at settlement is set below 5% p.a. the dealer will be paid
compensation by the buyer. But if the dealer does not have a properly considered view on
the future direction of interest rates, then it would be better to hedge or cover the risk. One
way to do this is to use the exchange-traded equivalent of an FRA, an interest rate futures
(see Chapter 5). Another approach would be to match the sale of an FRA with an offsetting
purchase, the effect of which is illustrated in Figure 3.5.
As before, the dealer has sold a 6v12 month FRA to the company that is concerned about
rising interest rates. This time it has also purchased an FRA covering the same future time
period and with the same notional principal. The client for the second deal is a money manager
who is worried about falling interest rates, which would adversely affect the returns made by
the fund. The rate agreed on this second FRA deal is 4.95% p.a. The money manager will
receive compensation on this FRA contract if the LIBOR rate for the contract period is set
below 4.95% p.a. Otherwise the FRA dealer will be compensated.
The rate of 4.95% p.a. is the dealer’s bid rate, the rate at which he or she buys FRAs for the
future time period 6x12. The rate of 5% p.a. is the dealer’s offer or ask rate. The difference –
five basis points – is the dealer’s spread. The spread exists partly to enable the dealer to make
COMPANY
FRA
DEALER
4.95% p.a.
LIBOR p.a.
MONEY
MANAGER
LIBOR p.a.
5% p.a.
Figure 3.5 Dealer sells and buys offsetting FRAs
Forward Rate Agreements 29
a profit on the FRA book, but, it also helps to provide some protection against volatile short-
term interest rates. A dealer will be prepared to sell or to buy an FRA without having an exactly
offsetting deal already in place, but this exposes the dealer to interest rate fluctuations until
such time as an offsetting deal is agreed or some other kind of hedge can be put in place.
FORWARD INTEREST RATES
An outstanding issue concerns the way in which the parties to an FRA can determine the
forward interest rate. One answer to this question is to look at arbitrage relationships. The exis-
tence of FRAs allows market participants to lock into rates for borrowing and for re-investing
money on future dates. For example, a trader could carry out the following transactions today:
r
Borrow pounds for one year at a fixed interest rate.
r
Deposit those funds for six months at a fixed interest rate.
r
Lock into a rate for re-investing the proceeds due from the deposit in six months’ time for a
further six months by selling a 6v12 month sterling FRA.
If the returns from investing and re-investing the pounds exceed the cost of borrowing the
money in the first instance, then the trader has constructed a ‘free lunch’ trade – an arbitrage
transaction. In an efficient financial market such a situation should not exist, or should not
persist for very long. The assumption that no arbitrage is possible can be used to calculate
the fair or theoretical forward interest rate at which a 6v12-month FRA should be sold on the
market, based on the market rates for borrowing and lending pounds for 12 months and six
months respectively.
This is true, although in practice the contract rates on FRAs are normally established through
the prices at which the relevant short-term interest rate futures contracts are traded on the
exchange (discussed in detail in Chapter 5). Because interest rate futures contracts in major
currencies such as sterling, dollars and euros are freely and actively traded by many market
participants, they are often taken as establishing the market’s consensus expectations on future
interest rates in those currencies. As such they are used to price a variety of over-the-counter
products such as FRAs and interest rate swaps, instruments whose values depend on expected
interest rates for future time periods.
CHAPTER SUMMARY
A forward rate agreement (FRA) is a contract agreed between two parties fixing the rate of
interest that will be applied to a notional sum of money for a future time period. The notional is
not exchanged; there is instead a cash compensation payment based on the difference between
the rate agreed in the contract and the actual market interest rate for the period, as established
by a benchmark such as LIBOR. The buyer of the FRA is compensated if LIBOR is found to
be above the contractual rate. Otherwise the buyer compensates the seller.
FRAs are often purchased by companies concerned about rising interest rates and sold by
money managers who are worried about falling re-investment rates. Dealers quote buy and sell
prices for a range of currencies and contract periods. The fair or theoretical contractual rate on
an FRA can be established from spot market interest rates. In practice, the rates for contracts
in a major currency are normally based on the rates implied in short-term interest rate futures,
which are the exchange-traded equivalents of FRAs.
4
Commodity and Bond Futures
INTRODUCTION
A futures contract is an agreement made through an organized exchange to buy or to sell a
fixed amount of a commodity or a financial asset on a future date (or within a range of dates)
at an agreed price. Unlike forward deals, which are negotiated directly between two parties,
futures are standardized. Delivery is guaranteed by the clearing house associated with the
exchange. A trader who contacts a broker and buys futures is said to have a long position. One
who sells futures has a short position. The value of a trader’s position is adjusted on a daily basis.
Futures are either traded by open outcry in trading pits in the form of an auction, or on
electronic screen-based trading systems, although the latter is undoubtedly the way ahead. The
Chicago exchanges currently (2003) operate both methods in tandem. In a pit-based market
brokers transact buy and sell orders on behalf of clients including banks, corporations and
private individuals; deals are also made by ‘locals’ who have purchased seats on the exchange
in order to trade on their own account. As soon as a trade is agreed the details are entered into
the exchange’s price reporting system. Data from the exchanges are published throughout the
world on websites and on electronic news services such as Reuters or Bloomberg. Nowadays,
deals made in trading pits may be recorded on hand-held electronic devices rather than on the
old cardboard tickets.
Both LIFFE and Eurex, the combined Swiss–German exchange, are wholly electronic mar-
kets. Trading on LIFFE is now effected through a computer system called LIFFE Connect; the
physical trading floor finally closed for business in 2000. The main functions of an exchange
are: to facilitate trading; to monitor conduct and ensure that the rules are adhered to; and to
publish the prices at which trades are agreed. The exchange does not buy or sell contracts.
Some exchanges, such as the CBOT, are (at the time of writing) established as not-for-profit
organizations; others, such as CME, are publicly traded companies whose shares are listed on
a stock exchange (in the case of CME it is the New York Stock Exchange).
Unlike over-the-counter (OTC) contracts, futures are standardized products, which encour-
ages active and liquid trading. On the other hand, the clearing house guarantee virtually elim-
inates credit or default risk. To set up a long or a short position a trader has to have a margin
account with a broker and must deposit initial margin into the account. This is a performance
bond (collateral) held against the possibility that a trader may not meet the contractual obli-
gations. The clearing house stipulates the minimum initial margin a broker has to collect. The
amount varies according to the type of contract and is based on a calculation of the maximum
likely movement in the value of the futures contract during the course of a day.
At the end of each day a trader’s margin account is adjusted in line with the closing price
of the futures contract – a process called marking-to-market. If a trader has a long position –
that is, has bought more contracts than he or she has sold – and the price has fallen, then
the loss will be subtracted from the margin account. On some exchanges this means that the
trader will automatically have to make a top-up payment called variation margin in order to
32 Derivatives Demystified
restore to its original level the amount held in the margin account. Other exchanges employ a
system of so-called maintenance margins such that the value of a contract has to move by a
certain amount before a variation margin call is triggered. Only the larger banks and financial
institutions are clearing members of an exchange and have direct accounts with the clearing
house. A trader who uses a smaller broker will deposit initial margin with that broker which,
in turn, makes all payments to the clearing house via a clearing member.
In summary,the effect of the margining system is to provide a very high measure of protection
against default. Firstly, traders have to deposit initial margin with the clearing house via their
broker before they can take out a position. Secondly, all open positions are marked-to-market
on a daily basis. If at the end of a trading day the futures price has fallen from yesterday’s close
then the accounts of the longs are debited with their losses and the accounts of the shorts are
credited with their profits. If the futures price has increased then the situation is the reverse.
If a trader receives a variation margin call and does not send the required funds in time, the
position will normally be closed out by his or her broker.
There are three main types of end-users of futures, although the same organization or
individual may take different roles in different circumstances.
r
Hedgers. These are using futures to protect or hedge against adverse movements in com-
modity prices, equity indices, interest rates, bond prices, etc. Examples include farmers who
are seeking protection against a fall in the market price of their crop; fund managers and
banks hedging against falls in equity or bond prices; commercial banks covering exposures
to changes in short-term interest rates.
r
Speculators. These buy and sell futures contracts to profit from changes in commodity prices,
interest rates, etc. They are prepared to accept risks that hedgers do not wish to assume, and
they provide liquidity to the market – that is, they help to ensure that there is an active market
in futures contracts with up-to-date prices, and that at any given time buyers and sellers are
both in operation.
r
Arbitrageurs. These look to exploit price anomalies by (for example) simultaneously trading
in futures and the underlying assets. If a futures contract is trading ‘rich’, i.e. at an expensive
level, an arbitrageur will short the overvalued futures and at the same time buy (go long)
the underlying asset in the spot market. Overall the arbitrageur is hedged against general
movements in the value of the asset since profits and losses on the short futures will offset
those on the long position in the asset. However, he or she will profit as and when the futures
price falls towards its correct market value.
COMMODITY FUTURES
Some readers may have seen the film Trading Places, released by Paramount Pictures in 1983,
starring Dan Ackroyd and Eddie Murphy. One of the key scenes depicts frenzied trading
in Frozen Concentrated Orange Juice (FCOJ) futures. The contracts are traded on the New
York Cotton Exchange (founded 1870) and now (since 1998) part of the New York Board of
Trade
R
.
The FCOJ-1 futures contract was first traded in 1966. Each contract was based on the
delivery of 15 000 pounds of orange solids, not limited to any country of origin. The quality
of the FCOJ that can be delivered is also specified, as are the licensed warehouses around the
USA where delivery can take place. Starting with the May 2005 expiry the exchange will list
instead two new contracts: FCOJ-A, in which juice must originate from Florida or Brazil; and
Commodity and Bond Futures 33
Table 4.1 FCOJ-A futures on the NYBOT
R
Unit of trading: 15 000 pounds of FCOJ
Price quotation: Prices are quoted in cents and hundredths of a cent per pound of FCOJ
Trading months: January, March, May, July, September and November
Table 4.2 FCOJ-1 futures prices
Last Open Volume Open interest
Month (cents) (cents) (contracts) (contracts)
September 2003 78.65 80.45 554 17 101
November 2003 80.55 82.25 257 4 576
January 2004 82.55 84.00 12 1 814
March 2004 84.55 82.85 20 1 064
Source: NYBOT
R
FCOJ-B which is not limited by origin. The specification of the FCOJ-A contract is shown in
Table 4.1. All contracts are guaranteed by the New York Clearing Corporation.
As is common with futures, very few contracts ever reach the point of delivery. Contracts
are bought and sold many times, and before the delivery month is reached traders start to
close out their positions. Those who are long contracts sell out and those who are short
buy back. Over all the exchanges it is estimated that fewer than 4% of futures contracts
ever reach delivery, in some cases fewer than 1%. This is fortunate because there are not
enough physical commodities in the world to deliver against all the futures contracts that are
traded.
The dominant suppliers in the orange market operate in Florida and Brazil, and much of the
produce is processed into concentrate. (The structure of the FCOJ-A contract reflects this fact.)
These two areas have different growing seasons so that the market operates throughout the
year, without violent cycles in prices. The primary factors affecting the price of FCOJ futures
contracts are the market forces of supply and demand that change the price of orange juice in
the spot market.
Futures prices and the basis
Table 4.2 shows data for FCOJ-1 futures on a trading day in August 2003. The prices are quoted
in cents per pound weight of FCOJ. On that day the September contracts opened at 80.45 cents.
In the table ‘volume’ shows the number of contracts traded that day. ‘Open interest’ shows
the total number of long or short contracts still open, not yet closed out. Notice that the open
interest is at its highest with the nearby delivery month September 2003. This is typical of
futures contracts generally. As a contract approaches the delivery date, traders start to close
out their positions, and open interest for that delivery month tends to decline. Traders who
wish to maintain their exposure will ‘roll’ their position by opening a new position in the next
delivery month.
We saw in Chapter 2 that the theoretical forward price of an asset can be determined by
what it would cost to buy the asset in the spot market, and then adding on what it would cost
to ‘carry’ or hold the asset to deliver to a buyer on a future date. The carry costs might include


![wiley finance, investment manager analysis - a comprehensive guide to portfolio selection, monitoring and optimization [2004 isbn0471478865]](https://media.store123doc.com/images/document/14/y/xf/medium_QyYI7IBVAK.jpg)