LARRY WILLIAMS LONG-TERM SECRETS TO SHORT-TERM TRADING phần 6 ppsx
Bạn đang xem bản rút gọn của tài liệu. Xem và tải ngay bản đầy đủ của tài liệu tại đây (458.04 KB, 25 trang )
125
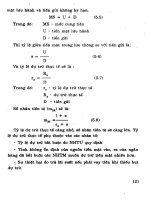
Figure 8.2 Greatest swing values in the bonds.
computer shows. In real-time trading, I will use a stop at or slightly above or below the open, once I am filled
on a long or short.
If price goes back there, after rallying the percentage of the swing value required to trigger a signal, the
move we were playing for is questionable, we got a momentum run, but it didn't stick. In absence of this
stop, you certainly must have one taking out the low of the day, this would be a sure sign of failure, thus
resulting in less loss than illustrated by the computer printout.
126
Figure 8.3 Greatest Swing value at .80 in the S&P 500.
More Uses for the Concept
Ihave also used this idea to help me when I am confused. If I am in a position and looking for a place
to exit, or maybe want to establish a position but do not have any clear-cut entry points, I will use the GSV
to tell me when the current spate of buying/selling has been reversed. All I need to do is calculate the buy
and sell swing values running the average as a tight stop or entry point.
127
Intraday traders can use this value a bit differently. What many of them want to do (not me, though)
is sell what should be an overbought area and, buy an oversold area. In this case, the GSV will tell you
about how far above the open you can sell, the largest failed value of the past few days, and then you
would place a stop and reverse slightly above that value. You would buy below the open a distance of the
largest failed down swing value, with a stop below that.
Here is a case in point. Table 8.1 shows the daily action of the S&P 500 in March 1998 along with
the sell swing values. Once we arrive at the 4-day average on March 16 and multiply it by 180 percent we
have a buy point (5.50 points) that much below the opening on the 17th with a fill at 1086.70. Table 8.1
shows how it looked.
Your stop on the long should be 225 percent of the 4-day average swing value of 3.57 or 8.00 - the
1092.20 open giving us a stop at 1084.20.
You can always determine the general area where a market should find support and resistance with
the GSV concept. My work suggests contra trend moves of 180 percent with a 225 percent stop work
quite well.
Yet another way I have traded and made money with this idea is to wait for a down close in the S&P
500 on Friday. I then buy Monday at the open plus Friday's high minus Friday's open swing value. I back
this with Bonds closing on Friday greater than they did 15 days ago. The following results show simply
using the bailout exit and a $2,500 stop. Practically speaking, I exit the trade at the open minus the swing
value, unless the swing value is very large. In that case, I admit defeat if price trades below the lowest
price seen in the day prior to going long. The time period here is from 1982 through March 1998. This is
the most successful interday mechanical trading technique I know of.
It does not require a quote machine, any software, or constant phone calls to your broker. Once the
setup is present (Bonds greater than 15 days ago, and Friday closes down), you buy at the next day's open
plus the buying swing value from Friday. Certainly, this takes no great skill, only the willingness
to
Table 8.1 Daily Action of the S&P 500
128
Figure 8.4 Greatest swing value buying on Mondays following a down close.
patiently wait for trades, then the gumption to put them on (see Figure 8.4).
Similar trading strategies can be developed for all markets using the GSV concept; just make certain
you first define valid setups for the buys and sells. My favorite setups are days of the week, highly correlated
data2 streams, seasonals, market patterns, and overbought/sold conditions.
Some Pointers
Over the years, I have tried various time periods to see whether there is any ideal number of days to use
in the calculation. My original thought was that one would want to use a 10-day period to arrive at the best
average; after all, the more observations of swing value variance the more stable the answer should be, or so
I thought. I was wrong on that. In almost all cases, the previous 1 to 4 days produce the best value in trading
or developing systems.
The basics here involve volatility breakouts above or below the opening. The amount of breakout we
are looking for is the amount that contained moves up to this point. Thus a critical element is to only take
buy signals after down days, sells after up days.
Finally, keep in mind this is a "dumb" technique, it knows not when a big trade will come or even
when a winning trade will be delivered on a silver platter. That is why you cannot pick and choose these
trades, you must simply take them, one at a time, as they come out of the hopper. If you pick and choose,
you will invariably pick the losers and walk away from the winners. It is nothing personal, we all do, and the
way to beat this devil is to take 'em all.
129
To my way of thinking, the GSV concept is the most solid and logical approach to volatility
breakouts. This failed swing measure has such great merit that I hope someone else, maybe you, will take
it past the point I have reached. Perhaps the better answer lies in the standard deviation approach
mentioned earlier, perhaps in using the GSV in relationship to the previous day's range. I am really not
certain. What I am certain of is that this is one of the most powerful techniques in my bag of tricks and
perhaps the most durable. It has served me well since I had the insight into the idea in 1977. Fancy math
may improve the results, but it is not necessary to make this work.
Chapter 9
Short-Term Trading from a Quote Screen
The markets can be understood looking backward but must be traded looking forward
What I have shared with you so far is the general way- I trade. I use daily- bar charts to set up patterns
and relationships that usually spur short-term moves of 2 to 4 days. This is my style it may not be yours.
People like the idea of (day- trading as there Is no risk of anything “hapening overnight." Their
fear is a large adverse move may take place from today's close to tomorrow's opening. Their fear is news.
change. and uncontrollable price action. They like the idea that at the end of the day it is all over, win,
lose, or draw. There are no anguishing losses to take home and interrupt your sleep. Make no mistake
about it, all this is true. but for every-thing you get in life you give up something in life. What you give
up when day trading is any opportunity at all to catch a large and sustained move as mentioned earlier.
To most people, the term “short-term trading" means being glued to a quote screen throughout the
market trading day. They envision images of high-pressure guy or girl with a phone in each car, screaming
something, like "Buy Chicago, sell New York.".
131
132
Certainly, this type of trading is hectic, and if you are going to trade this way, you had better make
certain you have the temperament required for the job. I will tell you what I think that temperament is, then
tell you what my quest for this Holy Grail of commodity trading has revealed.
Quote screen traders need three qualities; intensity, the ability to make intelligent choices, and the
capacity to react without any more thinking to the conditions at hand.
If you are the type who needs time to make a decision, or freezes, refusing to take action once a
decision has been made, this is not your game. Winning at this game requires making instant decisions and
immediately reacting; there is no time for pontificating or reconsidering. If you cannot make decisions this
way, you will be slaughtered in a matter of months. It is a game of the quick and the dead. If you are not
quick, you will be dead. It is as simple as that. Shortterm trading of this nature requires the physical ability
to instantly pounce on a market and just as instantly reverse the decision you made just a few seconds ago, if
that is what conditions dictate. It is a good thing the meek inherit the earth because they will never get rich
as day traders.
Following the interday ebb and flow of prices on a screen, day after day after day, requires the ability to
be focused and intense every hour of each trading session. This is not an occupation for daydreamers. If you
cannot maintain concentration, you will get hurt; it is forgetting to do what you should do, not being there
(physically or mentally) at that one critical minute, 60 seconds, that spells the difference between life and
death in your trading. It is not easy work to stay this focused and intense, particularly when your spouse calls
to ask you some mundane question about the garden or plumbing at home, or a close friend calls to chat. Do
you have the guts to tell them you can't talk now, to hang up on a close friend, to refuse to take calls from
your wife or husband, If so you are qualified for the job, if not, better rethink day trading.
I assure you the instant you get distracted by that phone call is the instant the market will have a major
move, catching you off guard. Well, don't say I didn't warn you. Now let's look at the object of this game.
You must also be able to change your view of the future in an instant. This is not a career for hardheaded
people.
How a Quote-Screen Trader Makes Money
A short-term trader has one objective: to catch the current trend of the market. That is it. That is all you
should try to do.
It sounds easy, but trust me-it is far from simple, and for two reasons. The first is that trend
identification is an art and science unto itself, and more abstract art at that.
133
It is a blend of Picasso and Cezanne with a splash of Chagall tossed in for fun. Second, even if you
correctly spot the trend change, your reactive mind may screw things up and blow it for you. This is
especially true if you are long with a loss or nominal profit and suddenly get a sell signal.
Do not confuse day trading with your long-term outlook; that is about something happening in the
future. Day traders don't-can't-care about the future. Your only concern is being in phase with the current
short-term trend. Your mission, should you accept this assignment, is to mimic what the market is doing. If
it is up, you should be long, if down, short. Trying to forecast short-term tops and bottoms is a surefire way
to rapidly deplete your bankroll. You want to be with the trend; it is your only friend.
Since greed is a stronger emotion than fear, your response will most often be to "hold and hope"
which means you bypass the current new trend, holding on to the long position hoping the sell will be
wrong when you should have spun on a dime. Dopes hope, winners are spinners.
My point is we are trying to do two very difficult things, beat the identification of trend changes and
beat our "brains" by outsmarting ourselves. That is the challenge. My first technique for identifying trend
changes comes from the short-term "ringed" high and low concept we went over in Chapter 1. This
concept allows us to identify short-term swing points. A trend change from up to down occurs when a
short-term high is exceeded on the upside, a short-term trend change from down to up is identified by price
going below the most recent short-term low. Figure 9.1 depicts such trend changes in a classic manner,
study it well because reality comes next.
Figure 9.1 Classic patterns of trend change.
134
Swing Points as Trend Change Indication
Here are a couple of pointers on this technique. Although the penetration of one of these short-term
highs, in a declining market, indicates a trend reversal to the upside, some penetrations are better than others.
There are only two ways a short-term high or low is broken. In an uptrending market, the low that is
violated or fallen below will be either a low prior to making a new rally high, as shown at (A) in Figure 9.2,
or a low that occurs after decline of a high that then rallies making a lower short-term high; it then declines
below the low prior to the rally that failed to make a new high, as shown at (B).
The "better" indication of a real trend change is the violation of the low shown at (A).
Figure 9.2 Breaking a short-term high or low.
135
By the same token, a trend reversal to the upside will occur in one of the two following patterns: in
(A) the rally peak prior to a new low is violated to the upside, or in (B) the market makes a higher low, then
rallies above the short term high between those two lows. In this case, again, the (A) pattern is the "better"
indication of a real trend reversal.
With that in mind, look at Figure 9.3, which shows a 15-minute bar chart of the September Bonds in
1989. The major trend moves were adequately captured by this technique.
Figure 9.4 again shows Bonds, this time in April 1998, and again you see how the penetration of
short-term high and low points enables a trader to be in phase with most of the trend moves for a 10-day
time period.
You can use this technique two ways. Some traders may simply buy long and sell short on these
changes in trend. That's a basic simplistic way to use this technique. A more educated approach would be
to take buy/sell signals when confirmed by TDW, TDM, secondary data, and so on, thus filtering our trades
with something other than wiggles and waggles on a chart.
Finally, we may use this indication of trend to tell us we can buy on pullbacks, and sell on rallies in
unison with the underlying trend. If our indication of trend is positive, and there has been a reversal to the
upside, then we can take buy signals from short-term measures or techniques.
Figure 9.3 T-Bonds (1 5-minute bars). Graphed by the "Navigator"
(Genesis Financial Data Services).
136
Figure 9.4 T-Bonds (15-minute bars). Graphed by the "Navigator"
(Genesis Financial Data Services).
The Three-Bar High/Low System
At one point in my career, I had over 30 consecutive winning trades using this next short-term
trading strategy. You will first have to calculate a 3-bar moving average of the high and a 3-bar moving
average of the lows. (Each bar represents the time period displayed on your chart. Use 5-minute charts for
lots of signal, or 15-minute charts if you want a little less hectic trading career.) This is automatically done
on all quote machines, although "in the old days" 1 did it by hand. You can have the old days!
The strategy is to buy at the price of the 3-bar moving average of the lows-if the trend is positive,
according to the swing point trend identification technique-and take profits at the 3-bar moving average of
the highs.
Sell signals are just the opposite. This means you will sell short at the 3-bar moving average of the
highs and take profits at the 3-bar moving average of the lows. It is downright foolish to do this unless there
is a reason to take only short sales. Our reason might well be that our swing point reversal system has told us
the trend is down. Then, and only then, sell the high and cover at the lows.
Now let's try to make some order out of all this. Figure 9.5 shows the addition of the 3-bar moving
averages and the swing lines. I have marked the
137
Figure 9.5 T-Bonds (15-minute bars). Graphed by the "Navigator"
(Genesis Financial Data Services).
Figure 9.6 T-Bonds (1 5-minute bars). Graphed by the "Navigator"
(Genesis Financial Data Services).
138
points where trend changes; we switch from buying the lows to shorting the highs following these reversals.
The 3-bar high and low entry points are also shown. The game goes like this; trend reversal up so we buy
the 3-bar low line and take profits at the 3-bar high and await a pullback to the 3-bar low. If the 3-bar low
would create a trend reversal for selling, however, pass on the trade. Sells are just the opposite; await a trend
reversal down, then sell all the 3-bar highs and take profits at the 3-bar lows.
Figure 9.6 has all the trend reversals marked off, so you can begin paper trading by looking for the buy
and sell entries and exits. I suggest you walk through this chart to get a sense of how one can trade this very
short-term approach. Note these are 15-minute bars, but the concept will work on 5minute to 60-minute bars
as well.
A New Indicator for Short-Term Traders Will-Spread
Markets move for real reasons, not because of technical whirling dervishes. Things happen in life
because there are consequences to actions. Charts do not move the markets. Markets move the charts. In
keeping with that, I also think short-term swings occur because of some external factor. Price never rallies
because it is rallying, the rally is the symptom of a cause. Detect that cause and we are several light years
ahead of the average short-term or day trader.
One of my favorite causative indicators is my Will-Spread index, a measure of the flow of price
between the primary market we are trading and a secondary market that influences the primary. As you
know, Bonds influence stocks, and Gold influences Bonds; Will-Spread allows us to spot the inner workings
of these market relationships. The index is constructed or calculated by first dividing the price of the market
we are trading, the primary market, by the secondary market and multiplying by 100. This creates a spread
between the two markets allowing a basic comparison of market interaction.
For short-term trading on 15-minute bar charts in particular, and most other time frames as well, I then
create a 5-period exponential of the spread and subtract that from a 20-period exponential of the spread. By
so doing, we can see when one market is heating up over another and get a better sense of these inner-market
influences. Granted, this is not a perfect system, but the only perfect approach to day trading I have ever
seen are those myriad of ads in commodity magazines and newspapers. You can absolutely trust me on this:
those are 90 percent hype and 10 percent substance. If anyone really had such an outstanding system, he or
she could make 100 times more money trading without the hassle of having to deal with the public. In
addition, the tax advantages of trading are gargantuan compared with hawking systems. I have
139
yet to see a totally mechanical day trading system that consistently makes money. Day trading is an art
form that must be based on good concepts to be successful.
An Actual Example
Figure 9.7 shows a 30-minute bar chart of the June 1998 Treasury Bonds. Will-Spread, based on
the spread between Gold and Bonds, is the index at the bottom of the chart. Our trading strategy should be
to look for market rallies whenever this index moves from negative territory, below the zero line, to above
it into positive land. A sell is just the opposite; when the index has been positive and then falls below the
zero line, it is probably time to sell.
I do not use this index as a be-all, know-all system. I use it as a tool to keep me in correct alignment
with the true trend of the market I am trading. In this case, we are looking at Bonds versus Gold. Once
price goes from being negative to positive, I will most always wait for one more thing to happen.
I want the very next trading bar to rally above the high of the bar that switched the index from negative to
positive. I am looking for final confirmation that the trend is still alive.
Figure 9.7 T-Bonds (30-minute bars). Graphed by the "Navigator"
(Genesis Financial Data Services).
140
I am not nearly as comfortable without this confirmation taking place. An exception can be made if
other technical gauges such as trendlines or positive oscillator readings are appearing on your chart or
screen. You can take such trades, but there is no better proof of a market's ability to rally than taking out the
high or falling below the low when a crossing from positive to negative has taken place.
Let's start with the May 8, 1998 chart. The first 30-minute bar saw a big down move resulting in a
negative crossing, but the following bar did not fall below that bar's low so no entry. Finally on the 13:50
bar, we would have sold short as the index was negative and we traded below the prior bar's low. Our entry
would have been 120 7/32.
Will-Spread stays negative all that day as well as the next, finally turning positive on May 12 on the
9:50 bar. Now comes the acid test will the rally continue? And it does as the 10:20 bar trades at 119 14/32
netting us a gain of 25 ticks or $750 per contract.
We are now long at 119 14/32 and looking for a negative crossing to go short. The first break below
zero occurs on May 14 on the 12:50 bar. Again, we wait for confirmation, but none comes on the next bar.
We now wait for that bar's low to be violated. Our "trailing" stop to exit and reverse is finally elected when
the 14:20 bar trades down to 120 4/32. Our net gain is 20 ticks or just a little over $600 per contract.
We steel our nerves for the short trade and await a new development, a penetration of Will-Spread back
into the positive zone. This does not take place until the 8:50 bar on May 18. The rally continues with a
full-fledged buy at 120 14/32 on that day. We lost money on the short, in fact, our net loss was 10 ticks or
$312.50.
Could we have prevented this loss? Sure, in retrospect as Monday morning quarterbacks, but blindly
following the rules, you would have taken the hit. When this happens, and it most certainly will, I take
consolation in the following statement:
Casinos do not win on every roll of the dice either.
We did end the day with a 5-tick profit or about $150 to help lick our wounds and offset the loss, and
the next trade (remember, traders fight wars not battles) would have made $500 per contract.
An astute trader may have exited the short position on the second bar of trading when it took out the
previous bar's high. Reasons? Will-Spread was quickly approaching the zero line. We should limit losses,
and price had a volatility breakout at 120 5/32 for a net loss of just 1 tick or $32.50 plus commissions. You
may not have chosen to exit, but that would have been my choice on the strength of the action of
Will-Spread in conjunction with the breakout of the trading range. As I said, this is a thinking person's
business.
141
If you were in a quandary about what to do, you could have looked at a 5- or 15-minute chart on
May 18. There you would have noticed both time frames giving a clear-cut penetration of Will-Spread to
the upside suggesting the best course of action would have been-at the very least-to pitch your short
position.
Will-Spread and the S&P 500 Stock Index
This same idea works quite well in helping us catch short-term swings in the various stock index
contracts such as the New York Stock Exchange, Dow Jones, Value Line, the Mini S&P as well as the
S&P 500 full-size contract.
Although Gold makes the world of Bonds go around, it does not have as strong an impact on stocks.
As you now know, however, interest rates do; so I suggest you use either T-Bills or Bonds in your
Will-Spread setup. Using 30minute bar charts, I am employing the difference between a 3-period and
15period exponential average. Admittedly, this is a lot of work to do by hand, but the better quote software
such as Omega's Trade Station and Genesis Data have now built my indicator into their programs.
Instead of just randomly choosing time periods to present to you to illustrate the value of Will-Spread
I am first going to show you "The Anatomy of a Crash," by highlighting the biggest crash of all times, the
1987 debacle, as well as the 1997 and 1998 waterfall slides.
The Crash of 1987
Here it is in all its glory; the largest stock market decline in the history of the world! A decline that
changed lives and fortunes, a decline of such disastrous proportions lawyers were still suing for damages
from the drop 5 years later. Even now, books are written claiming to know why it took place or explain it
away. Academics have suggested many ways to prevent the damages of such speculative busts in the
future. Big deal, I say; it was predictable-then-not now, with Will-Spread (see Figure 9.8). This amazing
index dipped into the negative zone on October 14 at 311.50 staying short all the way through the debacle
telling its followers the bottom was not yet in sight. Interest rates vis-a-vis T-Bills were not supportive of
the market and without that confirmation we should not look for any buy signals. Indeed, just about any
buying, other than the absolute low, would have proven costly.
The exit or first crossing back into positive territory came on October 20, 1987, with the S&P bloodied
and battered at 219.50, a profit of $46,000 per contract. The margin at the time was only $2,500 (Figures
142
9.9 and 9. 10).
Figure 9.8 S&P 500 Index (30-minute bars). Graphed by the "Navigator"
(Genesis Financial Data Services).
Figure 9.9 S&P 500 Index (30-minute bars). Graphed by the "Navigator"
(Genesis Financial Data Services).
143
Figure 9.10 S&P 500 Index (30-minute bars). Graphed by the "Navigator"
(Genesis Financial Data Services).
Although Will-Spread can stand on its own, it can be used in conjunction with other known facts about
the market. As just one example, you have read about a huge bias for stocks to rally at the first of every
month, especially in February, March, May, July, September, October, and November. Thus one possible
short-term strategy you could employ at the start of every month would be to take Will-Spread buy signals
when the positive crossings occur, with special focus on the previously named months. Here is a recap of all
such signals for 1997 starting with January. Stay with me as I "walk" and talk you through what happened
and what you could realistically could have done using this combination of ingredients.
January1997. Will- Spread did its thing crossing on January 2, 1997, with an entry at 744.70, staying
positive until the negative crossing on January 6, by then the S&P rallied to 752.00 with a profit of 7.30
points!
February1997. On January 29, the first-of-the-month rally was clearly indicated by a positive crossing
at a price of 774.60 with an exit two days later on the close of January 31 as Will-Spread had begun to
deteriorate. We know this is a 2- to 3-day bias, so let's take the 13.90 profit at the end of our time window
unless the index is particularly bullish.
144
March 1997. We did not get an entry until March 3 at 792.90. This was not much of a trade, but took
out 1. 10 points profit with a crossing on March 4 when the S&P was trading at 794.00.
April 1997. Oh, I just love Will-Spread. A conventional month-end trader would have bought and
lost money. But, you and I are smarter, we do not trade just technical and seasonal stuff alone, we know
inner-market relationships provide meaningful insights into what is going on. That is why we bypassed the
trade. Will-Spread did not give a buy until April 7, way outside the hot zone.
May 1997. We could see the month-end rally coming on April 28 when a bullish signal was given at
772.40 with an exit on May 1, 1997 at 800.50. This was a quick and explosive trade for an amazing 28.10
points profit!
June 1997. Here comes our first losing trade: a buy was given on May 28 with a positive crossing that
went negative just a few bars later at 851.20. I would have pitched this trade the same day at 849.00 for a
loss of 2.3 points. But, the hot zone of month-end/start was still there, so when Will-Spread turned positive
on May 30, there was no reason not to take the trade; we were still in the time zone. Entry price was 844.70
with an exit on June 2 at 848.00 making up the loss on our first shot at the trade.
July 1997. Well, we are given another lesson in humility, going long on a positive crossing on June 30
at 896 with an exit the same day, a 6.0 point loss at 890! Wow, that was quick and ugly. But just like the end
of june, we see another positive crossing on July 1, so we go long at 898. Our strategy is simple, wait for a
negative crossing or two days in the trade. We wait. Will-Spread crosses to the downside just a few hours
later at 897.80 for a .20 loss. Another crossing comes late in the day on July 1, so we reenter at 900.25 and
hold until our sell on july 7 at 927.55, netting 21.10 points in july.
August 1997. Along comes the first of the month, but Will-Spread is tracking in the negative area so we
have no trade. Again, our filter has kept us out of what appeared on the surface to be bullish. As the time
approached, we could see the fundamentals were not there to justify the trade.
September 1997. More humility. There is a clear-cut crossing on August 29 with an equally clear-cut
exit and loss the same day at 902.55 for our biggest loss of the year of 3.20 points.
145
But we stick with it, taking the buy signal on September 2 at 912.50 and watch a very powerful rally
unfold lasting until September 3 when we close out the trade at 928.90, again recouping our earlier loss.
That was close, but the combination of the time influence and inner market influence coupled to keep us in
the black, with this 15.50 point gain +1295.
October 1997. We had to wait until the first of the month when a crossing took place forewarning
us a rally was on the way. There was an additional chance to buy again as Will-Spread dipped into negative
for one bar, but with no follow-through for a sell and an immediate upturn on October 2 at 965.30, giving
another positive crossing until time ran out with a negative crossing. The rally stopped, for us at least, at
968.75, a 3.45 point gain.
November 1997. This was almost too easy. The crossing came on October 31 at 919.00 with an
equally clear exit at 947 for a very profitable trade of 28.0 points. This is how I wish it worked every
month!
December 1997. Another storybook trade with a positive crossing on the first of the month at
962.50 and an exit on December 2 at 973.20. It was, as old Blue Eyes used to sing, a "very good year," 13
total trades with 10 winners. More importantly, the net profits of 99.70 points, or $24,925, illustrate the
validity of combining fundamentals with time influences. The time influence is always there, but without a
valid underpinning-the stage being set on a fundamental basis-I will pass, thank you. There are too many
good trading opportunities where we can get such high odds that there is no reason to go slumming for
trades just because there is one element "that may work." The more the merrier, that is my adage!
Chapter 10
Special Short-Term
Situations
History does repeat itself, just not with precision.
It is time to develop a checklist of possible short-term trading opportunities, we can accept or reject
each month. You can do this yourself by gleaning out of my trading opportunities that appeal to you. To
give you a feel for doing this, I devote this chapter to setting up specific trades you should be looking for
each month. These trades are based on times of the month and holiday
The time-of-the-month trade is hardly a new idea. As noted earlier the concept has been known for
years. Here are my improvements and adaptions to a long-standing market truism: stock prices rally around
the first of the month. The light I shed on this play was to find out that Bond prices experience this same
monthly uplift as demonstrated earlier. We will develop a winning strategy based on these insights.
Month-End Trading in Stock Indexes
There are now several vehicles speculators can use to catch these savings. The S&P 500 stock index
has been the kingpin of trading stock market moves but lately, the lower margin S&P minicontract has been
147
148
Figure 10.1 S&P 500 buying first day of each month.
grabbing smaller investors' attention. The newcomer in this group, though, is the Dow Jones 30 index, a
futures contract that mimics the world-famous Dow Jones Average. I expect this to become an even more
important index to trade in the future.
The strategies discussed here are based on the S&P 500 for one simple reason; we have more data
because this stock index began trading in 1982, the Dow 30 in 1997. But, the strategies can be applied to all
the stock indices; just alter your stop based on margin, contract size, and current volatility.
I went back to 1982 and tested buying the S&P 500 index on the open of the first trade day of every
month with an exit on the first profitable opening. The stop I chose was only $1,500, but was not used on the
day of entry; however, after the entry day it was in place at all times. There have been 129 trades making a
net gain of $73,437, about $7,000 a year for trading only once a month. The numbers of this system are
excellent; the accuracy is 85 percent, average profit per trade (that's net gain, winners minus losers, divided
by total trades). Drawdown came in at $3,325, less than 5 percent of total gains. This is good stuff (see
Figure 10.1).
Target Months
If you are getting the hang of this game, you may have already asked yourself if some months do
better than others. The answer is yes, as the following printouts show. The story they tell is that the worst
months, in the past 16 years, have been January, February, and October. These should be your target months
to avoid or be cautious of seasonal trading. I suggest you study the month-by-month recaps presented in
Table 10.1.
149
Making It Better
Although some of our speculative competitors are aware of this repetitive pattern, most do not
consistently take advantage of it nor have they figured out about skipping some months. That is a big
improvement, but we can do even better.
How? By only taking these first-of-the-month trades when Bonds are in an uptrend. As I demonstrated
earlier, an uptrend in Bonds is conducive to stock market rallies. A pretty good rule, and easy to follow, is to
only buy on the first of a month, any month-if Bonds have closed higher the day prior to our anticipated
entry than 30 days ago. This is evidence Bonds should be supportive of a stock market rally.
Month-End Trading in the Bond Market
Next, let's look at buying the first trading day of every month in the Bonds, as we did in the S&P
500. The results are quite profitable based on the rules of using an $1,100 stop and exiting on the first
profitable opening. This approach to trading comes close to 70 percent accuracy and has a very large average
profit per trade considering that we are in for only one day on average (see Figure 10.2).
We can dramatically improve these results by simply by-passing the poorer performing months which,
as shown in Table 10.2, are January, February, April, and October, with December being a question mark.
150
Figure 10.2 Bonds buying first day of each month.
As mentioned, the month-end up move in stocks has been written about for years; all I have done is
figure out how to better qualify trades for this time period. Until now, the tendency for Bonds to rally at this
same time has been known by only a few of my students. My research and actual trading over the years
show this is also an excellent time for short-term swing moves in Bonds and Bills.
Figures 10.3 and 10.4 should give you an overall view of this technique's strength. Figure 10.3 shows
the growth in an account that would have
151
Figure 10.3 End-of-month T-Bonds system (U.S. T-Bonds day session 1983-1996).
Figure 10.4 End-of-month S&P 500 (1983-1996).