create your own hedge fund increase profits and reduce risks with etfs and options phần 6 pot
Bạn đang xem bản rút gọn của tài liệu. Xem và tải ngay bản đầy đủ của tài liệu tại đây (385.95 KB, 25 trang )
get price (or lower). Of course, you may never buy the shares, but you keep
the put premium as your profit and consolation prize.
If your investment objective is to earn a profit and you are willing to
own the shares (but would rather not), then choose an out-of-the-money
put, as there is less chance you will be forced to buy stock when expiration
day arrives. But don’t sell just any put—be certain there is enough time pre-
mium in the option to allow you to earn a minimum return on your invest-
ment. Each investor has to establish a minimum target, but the suggestion
here is that the minimum should not be less than 0.5 percent per month
(after commissions). (Personally I currently aim for a minimum return of
1
1
⁄
2 percent per month.)
RISK AND MARGIN CONSIDERATIONS
Writing uncovered put options is a very attractive strategy. One major reason
is risk. This investment method is slightly less risky than simply buying and
holding stocks, and every investment advisor tells the world that owning a di-
versified portfolio of stocks is a prudent investment choice. As an added
bonus, the chances of earning a profit are increased (compared with buy and
hold) when you write uncovered put options (or covered call options).
An investor who buys 1,000 shares of stock at $20 per share is investing
$20,000. When you write 10 put options with a strike price of 20, you are ac-
cepting the obligation to buy 1,000 shares of stock at $20 per share at a later
date. You may never have to honor that obligation, but if you do, your risk
becomes the same as the investor who buys the shares now. But you have
the advantage of having sold 10 put options, and the cash you received low-
ers the cost of your investment. Of course, your maximum profit is limited
to the cash you receive when writing the puts.
If your position is cash backed—that is, if you have $20,000 cash in
your account in case you are called on to honor the obligation to buy
stock—then you are in the same position as any other stockholder when
share prices decline.
Warning
Sometimes put writers make careless decisions and find themselves in
trouble. This occurs when investors sell too many put options. Investors
with $20,000 to invest know that $20,000 is the maximum possible loss (un-
less they choose to trade on margin and borrow cash from their brokers).
When buying stock, investors know how much cash to spend and do not
buy extra shares.
Option Strategies You Can Use to Make Money 107
4339_PART3.qxd 11/17/04 1:16 PM Page 107
However, put writers might erroneously think that it isn’t a big deal to
sell 20 or 30 put options, instead of only 10. After all, they might mistakenly
believe, “What’s the harm in selling an option that costs only $50 per con-
tract? That’s a pretty small trade. If I can make $500 selling 10 puts, why
don’t I just sell 30 and make $1,500?” This mind-set must be avoided. When
writing put options, always think about what you are going to do if you are
assigned an exercise notice. If you are assigned on 30 puts with a strike
price of 20, you must purchase 3,000 shares at $20 for a net cash outlay of
$60,000. If you don’t have sufficient cash in your account and cannot either
transfer that cash into your account immediately or borrow it from your
broker, you are going to receive a margin call.
4
That’s an event you don’t
want to happen and something that is easily avoided.
Advice: Don’t overextend yourself. When you begin your put-writing
strategy, be certain you are fully cash backed. Later, when you have more
experience, you can begin to use a small amount of margin. But the more
margin you use, the greater the risk. Please don’t be careless.
The main risk with adopting a strategy of writing uncovered put op-
tions for unwary investors is not the strategy itself, but their inability to rec-
ognize that it is easy to sell too many put options. This cannot happen to
you if you are constantly aware of the cash you need, just in case you are
assigned an exercise notice on each and every put option you sell. Such an
assignment is unlikely before expiration day, but if you are aware, then you
will not sell too many put options.
It’s true that you can avoid being assigned an exercise notice if you re-
purchase any options you sold previously—before you are assigned. But
sometimes an assignment notice arrives unexpectedly, and it’s too late to
repurchase the puts once you receive the assignment notice. Each broker
108
CREATE YOUR OWN HEDGE FUND
The Importance of Being Earnestly Cash-Backed
Note: The covered call writer does not have the problem of writing too
many covered calls because that strategy uses cash to buy stock. The cov-
ered call writer understands the necessity of not opening new positions
when out of money. It is less obvious when the uncovered put writer who
uses margin is out of money. Thus, it’s important to keep track of the
amount of cash required, if you are assigned on all of the puts you sold.
4339_PART3.qxd 11/17/04 1:16 PM Page 108
handles this sticky situation differently, so be certain you know what your
broker does when you don’t have enough cash to cover an assignment.
Write uncovered puts. Collect those premiums. Buy stocks you want to
own at favorable prices. But don’t sell more put options than your financial
condition allows. Be aware that each option you sell may obligate you to
purchase 100 shares of stock, so always know how you will pay for that
stock if and when you receive an assignment notice. To repeat: The main
risk of this strategy is writing too many put options and not knowing what
to do if assigned on each of the put options you sell.
One further risk is worth considering when you write an uncovered
put. It’s possible to miss out on a surge in the value of the shares you want
to buy, but an unlikely combination of events is required before this risk
comes into play.
• The stock drops in price to a point where you would have bought it.
• The stock then rallies substantially beyond the strike price of the put
option.
If these events happen, then the investor who buys shares easily out-
performs the investor who writes the uncovered put option. Although this
scenario occasionally occurs, it is far more likely that the put writer
achieves a better financial result than the investor who enters a low bid in
an attempt to buy stock. After all, the put writer outperforms whenever the
shares decline in price, remain relatively unchanged, or increase in value up
to the break-even point (see box). This investment strategy is very similar
to covered call writing in that it produces better results the vast majority of
the time.
Option Strategies You Can Use to Make Money 109
Break-Even Points for Put Writers
Break-even points for put writers are the same as those for call writers (see
Chapter 9). The upside break-even point is the stock price at which you
make the same profit as the investor who is simply long stock. That point
equals the strike price plus the put premium. Above that price, the investor
who owns stock makes additional profits and the put writer does not.
The downside break-even point is the stock price below which selling
the put option is no longer profitable. That price equals the strike price
minus the put premium.
4339_PART3.qxd 11/17/04 1:16 PM Page 109
COMPARING RISK: COVERED CALL
WRITING AND UNCOVERED PUT WRITING
As mentioned earlier, the risks associated with covered call writing and un-
covered put writing are identical. When you adopt covered call writing, you
buy stock and collect the premium from writing a call option now. When
you adopt uncovered put writing, you agree to buy stock later (if called on
to do so) and collect the premium from writing a put option now.
The data in Table 11.1 illustrates the cost and risks associated with ei-
ther position. In our example, the stock is priced at $42 per share, and you
write an option with a strike price of 40.
• An identical investment ($3,850) is required, either in cash for the cov-
ered call or cash kept in reserve (so the put option is cash backed) for
the uncovered put.
• Maximum profit occurs when the stock is above the strike price (40)
when expiration arrives.
• Maximum profit equals the time premium of the option.
• Maximum loss (stock goes bankrupt) is $3,850.
SUMMARY
Uncovered (naked) put writing is a bullish strategy for investors who want
to reduce the downside risk of owning stocks. When adopting this strategy,
investors either collect a profit when the put expires worthless or buy the
shares they want to own at a reduced price when assigned an exercise no-
tice. Profits are limited to the premium collected when writing the option.
Despite opinions to the contrary, this strategy is more conservative
than that of simply owning stock and increases the chances of outperform-
ing the market over an extended period of time. Just remember not to
overextend your resources.
110
CREATE YOUR OWN HEDGE FUND
4339_PART3.qxd 11/17/04 1:16 PM Page 110
111
CHAPTER 12
Historical Data
BuyWrite Index and
Volatility Index
I
t’s one thing to read about an options strategy, but I’m sure you want to
know if the strategy really performs as advertised. Does it really en-
hance returns for stock market investments? Fortunately evidence
shows it does.
BUYWRITE INDEX
The Chicago Board Options Exchange (CBOE) publishes data for BXM, or
BuyWrite index, a benchmark designed to track the performance of a hy-
pothetical covered call writing strategy. BXM is based on a portfolio that
approximates ownership of each of the stocks in the S&P 500 index (SPX)
and writing covered call options on the index. Data for this index are avail-
able beginning in June 1988.
The performance of the BXM is based on the following five-step in-
vestment strategy. (Note: This description is presented to enable you to un-
derstand how the BXM works; this investment methodology is not
recommended for readers to follow.)
1. Buy and maintain ownership of a portfolio of stocks that mimics the
S&P 500 index. An investor does not have to own the entire index, as
long as the stock portfolio has a very high correlation with that index.
2. Write the near-term SPX call option early in the morning on the third
Friday of each month.
1
4339_PART3.qxd 11/17/04 1:16 PM Page 111
3. To provide a constant methodology, the call that is sold always has
one month remaining to expiration. The strike price is always just
above the current index level (the first call option that is out of the
money).
4. The call is held through expiration and is cash settled (see box) based
on prices at the opening of the market on the third Friday of the month.
Note: The strategy used to calculate the BXM does not allow for any ad-
justments. In the real world, the results of an investor who adopts this
methodology may differ from that of the official BXM if that investor
makes an adjustment to the position. Chapters 15 and 16 provide ex-
amples of how and why investors may want to make such adjustments.
5. Every month, a new one-month call option is written, based on the
identical strategy. Because assignments are cash settled, an investor
who adopts this strategy never has to worry about selling and repur-
chasing stocks, except for making an occasional change in portfolio
makeup (when the composition of the index changes). If the investor is
assigned an exercise notice, no shares of stock change ownership.
Now that the BXM exists, an important question remains: What does
it tell us about the financial results of adopting a covered call writing
strategy? If writing covered calls is an advantageous strategy, would fol-
lowing that strategy produce meaningful benefits in the real world? The
existence of the BXM index provides information needed to answer the
question.
2
112 CREATE YOUR OWN HEDGE FUND
Cash-Settled Exercises and Assignments
Because SPX options are cash settled, the portfolio owner never has to re-
linquish shares. When a cash-settled option expires in the money, the op-
tion owner’s account is credited, and the option writer’s account is debited,
the proper amount of cash. The cash amount is equal to the number of
points by which the option is in the money, multiplied by 100.
For example, if the investor using the BXM strategy writes an SPX call
with a strike price of 1,110 and if the settlement price of the SPX (based on
opening prices of each of the stocks on the third Friday of the month) is
$1,117.35, then the writer of the call option must deliver cash to the owner
of the option. That cash amount is $1,117.35 – $1,110.0, or $7.35 × 100.
That translates into $735 per contract.
If an option is out of the money at expiration, it simply expires worth-
less and no cash is transferred.
4339_PART3.qxd 11/17/04 1:16 PM Page 112
It’s possible to compare investment returns when owing a diversified
portfolio of stocks (index mutual funds) with returns using a covered call
writing strategy. Keep in mind that the BXM strategy has a slightly bullish
bias, because the option written is always slightly out of the money. Index
mutual funds have a totally bullish bias, as they are fully invested in stocks
and earn profits when stock prices increase and suffer losses when they
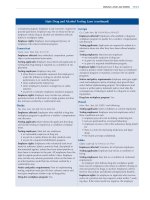
decrease. Figure 12.1 illustrates the comparison.
The figure clearly shows that the option-writing strategy easily outper-
formed an investment plan of simply buying and owning stocks over this
16-year period. It’s also noteworthy that this was a bullish period for the
market, with the S&P rising from the mid-260s in June 1988 to over 1,100 in
mid-2004. As discussed in Chapter 10, covered call writing outperforms a
buy-and-hold strategy through most stock market conditions, but compares
less well in strongly rising markets. Even though these 16 years were pri-
marily bullish, covered call writing significantly enhanced investors’ re-
turns on investments.
Table 12.1 presents the year-by-year comparison of investment results.
The buy-write strategy enhanced investment returns in only 9 of the 16
Historical Data 113
FIGURE 12.1 BuyWrite Index versus S&P 500 Index June 1988–March 2004
Source: Chicago Board Options Exchange
SPX and BXM were set to a value of $1.00 as of June 1, 1988. Actual SPX was
266.69. Upper line represents BXM, worth 6.30 times its initial value as of March
2004. Lower line represents SPX, worth 4.20 times its initial value as of March 2004.
BuyWrite Index versus S&P 500 Index
June 1, 1988–March 2004
7.00
6.00
5.00
4.00
3.00
2.00
1.00
0.00
06/88 06/90 06/92 06/94 06/96 06/98 06/00 06/02
Date
Performance
4339_PART3.qxd 11/17/04 1:16 PM Page 113
periods (15 full years and 1 partial year), but as Table 12.1 shows, in some
years those additional profits were substantial (more than 17.5 percent in
2000 and almost 16 percent in 2002). The purpose of adopting a covered call
writing strategy is to improve the probability of outperforming the market
over an extended period of time. As the results show, this anticipated en-
hancement was a reality for the period for which data are available. From
June 1988 through June 2004, BXM returned 525 percent and SPX returned
317 percent.
There are going to be years when you may wish you never heard of cov-
ered call writing. For example, notice how the S&P index easily outper-
114 CREATE YOUR OWN HEDGE FUND
TABLE 12.1 Year-by-Year Profit Comparison
BXM versus SPX
Year 1-Year 1-Year
Ending BXM Gain SPX Gain Diff
Start 100.00 266.69
1988 108.13 8.13% 277.72 4.14% 3.99%
1989 135.17 25.01% 353.40 27.25% –2.24%
1990 140.56 3.99% 330.22 –6.56% 10.55%
1991 174.85 24.39% 417.09 26.31% –1.91%
1992 195.00 11.52% 435.71 4.46% 7.06%
1993 222.50 14.10% 466.45 7.06% 7.05%
1994 232.50 4.50% 459.27 –1.54% 6.04%
1995 281.26 20.97% 615.93 34.11% –13.14%
1996 324.86 15.50% 740.74 20.26% –4.76%
1997 411.41 26.64% 970.43 31.01% –4.37%
1998 489.37 18.95% 1,229.23 26.67% –7.72%
1999 592.96 21.17% 1,469.25 19.53% 1.64%
2000 636.81 7.40% 1,320.28 –10.14% 17.54%
2001 567.25 –10.92% 1,148.09 –13.04% 2.12%
2002 523.92 –7.64% 879.82 –23.37% 15.73%
2003 625.38 19.37% 1,111.92 26.38% –7.01%
Total Gain 525.38% 316.93%
(Compounded)
Source: Chicago Board Options Exchange
BXM: BuyWrite index
SPX: S&P 500 index
Start: Data from June 1, 1988
Diff: BXM One-Year Gain Minus SPX One-Year Gain
Total Gain Compounded: From June 1, 1988 to December 31, 2003
4339_PART3.qxd 11/17/04 1:16 PM Page 114
formed the BXM during the very bullish years of 1995 to 1998. But over the
longer term, this strategy is very likely to continue to provide substantial
benefits—reduced volatility and additional profits—when compared with
simply buying and holding a diversified stock portfolio.
Before you decide to rush into adopting an investment approach that du-
plicates the BXM strategy, consider some drawbacks. If you want to own a
basket of stocks that attempts to mimic the performance of the S&P 500
index, you must determine the proper number of call options to sell to obtain
the best possible hedge. Here is an example of how to make the calculation:
If the current price of the SPX index is $1,100, the formula for the quan-
tity of index options contracts needed to hedge the entire portfolio is:
Amount to be hedged (the current market value of the portfolio)
÷ strike price of the SPX options contract × 100
For example, if the portfolio you construct in an attempt to mimic the
performance of the S&P 500 is worth $250,000, and if you write an SPX op-
tion with a strike price of 1100, then to hedge the portfolio properly, you
want to sell
250,000 ÷ (1100 × 100) contracts
That’s 2.27 contracts. Fractional contracts are not allowed, so you
would write two contracts to provide the best possible hedge. This process
hedges $220,000 of your portfolio, leaving the remaining $30,000 unhedged.
That’s great when the market rises, but it is not as good when the market
falls. Fortunately, it’s not necessary to leave yourself exposed to that de-
gree of market risk. Although adopting this methodology does allow you to
minimize commissions (because the options are cash settled, you don’t
have to constantly buy or sell the underlying shares), it’s inconvenient and
adds unnecessary risk when you cannot hedge your entire portfolio.
Thus, I recommend that you do not attempt to mimic the returns of the
BXM index by adopting the methodology just described. There is a much
simpler, much more efficient method available to you. The method involves
constructing a diversified portfolio from among the many optionable ex-
change traded funds and then writing covered call options on those shares.
Be sure to buy ETFs in increments of 100 shares. To match the returns of
the BXM most closely, you can write call options that are slightly out of the
money.
3
The details are discussed in Part IV.
Although worthwhile to understand how the performance of the BXM
index is calculated, trying to match that index’s performance is not an effi-
cient methodology for the vast majority of investors. Stick with a covered
call writing program in which you can easily hedge your entire portfolio.
Historical Data 115
4339_PART3.qxd 11/17/04 1:16 PM Page 115
FURTHER EVIDENCE THAT COVERED
CALL WRITING WORKS
The data for BXM presents compelling evidence that covered call writing is
a viable strategy. Those who disapprove of writing covered calls argue that
the limited upside potential makes the strategy unattractive. What the
naysayers fail to mention is that it’s much more common for markets to
make small directional movements rather than to be strongly bullish. It is
just those small movements that produce outstanding results for the strat-
egy of covered call writing. It is well worth taking the chance of missing out
on part of a huge upward move, because such moves are uncommon. But
even when those sharp upswings happen, the covered call writer makes out
very well, as the strategy has a bullish bias. In Table 12.1 you can see how
much better the S&P performed during the bullish run from 1995 to 1998,
but the performance of the BXM was pretty impressive also, averaging a re-
turn of 20.51 percent (versus 28.01 percent).
There is additional evidence to support the superiority of adopting cov-
ered call writing. Richard Croft, an investment counselor and portfolio
manager, and associates have constructed a buy-write index based on the
Standard & Poor’s Toronto Stock Exchange 60 index (TSE60). It is named
the Montreal Exchange Covered Call Writers index (symbol: MCWX). Data
are available beginning in late December 1993.
4
The covered call strategy
outperformed the buy-and-hold strategy in 8 of the 10 years of data avail-
ability. Table 12.2 shows that while the TSE60 index approximately dou-
bled, the covered call index nearly tripled.
The investment methodology used by Croft is slightly different from
that used by the CBOE and the BXM index. The TSE 60 index portfolio is
comprised of an ETF, the Standard & Poor’s Toronto Stock Exchange 60
Index Participation Fund. At expiration, options are cash settled, so it is
never necessary to buy or sell shares of the ETF. The strategy calls for writ-
ing a call option that is closest to the money (rather than the first out-of-the-
money option) at the end of the trading day (rather than early in the
morning) on the Monday following expiration. Thus, this strategy leaves the
investor naked long (unhedged) all day Monday following expiration.
(Croft does not explain why the option trades are not made early Monday
morning.) These statistics provide additional evidence supporting the idea
that covered call writing enhances portfolio performance.
Not only are returns on an investment enhanced, an additional benefit
of the covered call writing strategy is those returns are achieved with a re-
duction in volatility. Croft notes that the annual returns achieved by cov-
ered call writers are more consistent than those achieved by owners of the
ETF.
5
The CBOE publishes a graph showing the standard deviation of the
116
CREATE YOUR OWN HEDGE FUND
4339_PART3.qxd 11/17/04 1:16 PM Page 116
annualized returns is reduced by 33 percent when the buy-write strategy is
utilized.
6
In layman’s terms, the annual profit (or loss) differs from the av-
erage profit by a smaller amount when the covered call strategy is
adopted—hence, the portfolio value is less volatile.
VOLATILITY INDEX
The CBOE Volatility index (VIX) was originally designed to track the im-
plied volatility (IV) of the Standard & Poor’s 100 index (OEX). A change
was made in 2003, and the VIX now tracks the IV of the SPX (S&P 500
index). The methodology used to calculate the value of the index was up-
dated at the same time. The calculation includes options with a variety of
strike prices in the front two expiration months.
7
Information is available
online for those interested in details of the calculation method.
8
Originally introduced in 1993 (using data dating back to 1986), the VIX
soon became the benchmark for measuring implied volatility. VIX is a mea-
sure of future volatility expectations, rather than of actual historical
Historical Data 117
TABLE 12.2 Year-by-Year Profit Comparison
MCWX versus TSE60
1-Year 1-Year
Year MCWX Gain TSE60 Gain Diff
1993 102.0 221.49
1994 105.0 2.94% 221.84 0.16% 2.78
1995 119.0 13.33% 250.51 12.92% 0.41
1996 156.0 31.09% 321.59 28.37% 2.72
1997 191.0 22.44% 378.09 17.57% 4.87
1998 193.0 1.05% 375.98 –0.56% 1.61
1999 231.0 19.69% 495.86 31.88% –12.20
2000 269.0 16.45% 528.72 6.63% 9.82
2001 268.0 –0.37% 442.55 –16.30% 15.93
2002 247.0 –7.84% 373.15 –15.68% 7.85
2003 287.0 16.19% 458.72 22.93% –6.74
10–Year Gain 181.37% 107.11%
(Compounded)
Source: Montreal Stock Exchange
MCWX: Montreal Exchange Covered Call Writers Index
TSE60: the Toronto Stock Exchange 60 Index
Diff: BuyWrite Index minus TSE60
4339_PART3.qxd 11/17/04 1:16 PM Page 117
volatility. High implied volatility (high option prices) means there is an ex-
pectation that the market is going to be more volatile than usual before op-
tions expiration. But the index represents more than that to some traders
and has come to represent a measure of market sentiment, with high VIX
measurements indicating “fear” and low measurements indicating “com-
placency.” That fear represents concern about a large market decline, and
high VIX readings are considered bearish for the market. The highest read-
ings ever recorded occurred during and immediately after the stock mar-
ket crash of October 1987, when the VIX reached an incomprehensible
150. (For comparison, in mid-2004, the VIX is near 15.) When the market
reopened a few days after the terrorist attacks of September 11, 2001, the
VIX reached a level of “only” 49.
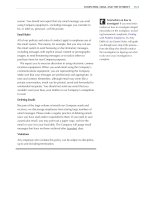
Figure 12.2 presents VIX data from 1990 through year-end 2003. The
data in the figure begins in 1988 because the 1987 data (VIX 150 in October)
would dwarf all other VIX values.
118
CREATE YOUR OWN HEDGE FUND
How Implied Volatility Affects Option Prices
High implied volatility (IV) translates into high option prices. For example,
consider a call option (stock is 50) with six months until expiration and a
strike price of 50:
When the implied volatility is 15, the option trades at $2.35
When the implied volatility is 30, the option trades at $4.40
When the implied volatility is 49 (as in September 2001), the option
trades at $7.00
When the implied volatility is 150 (as in October 1987), the option
trades at $20.10
It may be difficult to believe, but the bid for options that routinely
trade for less than $3 today were more than $20 for a few days in October
1987. And people were desperate to buy those options to protect their re-
maining assets. In addition, asking prices were much higher than bid prices
as few people were willing to sell options.
4339_PART3.qxd 11/17/04 1:16 PM Page 118
WHAT DO ALL THESE DATA MEAN
FOR COVERED CALL WRITERS?
You have seen the evidence demonstrating the viability of writing options
as part of a conservative strategy. The future is unknowable, but:
• BXM data show covered call writers earned a higher return than buy-
and-hold investors over a 16-year period.
• VIX is cyclical and periodically turns higher, then lower. It is difficult to
predict when these ups and downs will occur. The BXM data tell us that
it pays to stay with covered call writing during both highs and lows in
the VIX.
• The VIX is currently below its recent range but well above the record
lows. If it eventually turns higher, covered call writing should produce
even better returns than it offers today.
Let’s move on to the specific recommendations of how you can con-
struct a portfolio according to the teachings of modern portfolio theory
and enhance your expected profits by writing covered calls or uncovered
puts.
Historical Data 119
FIGURE 12.2 CBOE Volatility Index (VIX), January 1, 1988–June 30, 2004
Source: Chicago Board Options Exchange
VIX (CBOE Volatility Index) 1988 - 2003
60
50
40
30
20
10
0
01/88 01/90 01/92 01/94 01/96 01/98 01/00 01/02 01/04
Date
Index
4339_PART3.qxd 11/17/04 1:16 PM Page 119
4339_PART3.qxd 11/17/04 1:16 PM Page 120
PART IV
Putting It
All Together
4339_PART4.qxd 11/17/04 12:57 PM Page 121
4339_PART4.qxd 11/17/04 12:57 PM Page 122
123
CHAPTER 13
Building a
Portfolio
Y
ou know that modern portfolio theory (MPT) stresses the importance
of owning a well-diversified portfolio. You’ve seen how exchange
traded funds (ETFs) offer many advantages over traditional mutual
funds for investors who have (or can accumulate) at least several thousand
dollars to invest. You’ve learned about options and how they can be used to
enhance the returns on your portfolio. It’s time to tie it all together and de-
velop an investment methodology that increases the probability of beating
the market on a consistent basis.
BUILDING A WELL-DIVERSIFIED
PORTFOLIO
The first step is deciding what constitutes a proper portfolio for you. You
don’t have to be married to that portfolio; you can make changes whenever
you deem it advisable. To get started, select the types of investments you
want to own. Some sample portfolios follow, but they are merely examples.
One may be suitable for you, but the purpose of using examples is to illus-
trate how easy it is to compile your own portfolio.
Begin by allocating your assets. This is not an easy task for many in-
vestors; they simply invest all their available money in the stock market. Al-
though it is not the best way to proceed, if you fall into that category, or if
you want to invest all your assets in stocks, it’s your money and you are en-
titled to make that choice.
4339_PART4.qxd 11/17/04 12:57 PM Page 123
After deciding how much to invest in the stock market, use that money
to purchase a suitable mix of ETFs. Choose only ETFs that have listed op-
tions (see Tables 13.1 and 13.2 at the end of this chapter) and buy in round
lots (increments of 100 shares). You may decide that one broad-based ETF
is sufficient diversification, or you may prefer to tweak your portfolio to in-
clude several types of ETFs.
You can buy ETFs that invest in domestic or foreign companies. You
can choose those that invest in small, medium, or large companies. You can
invest in specific sectors of the market. Of course, you can build your port-
folio out of any combination of ETFs that suits you.
Keep in mind:
• Trading expenses are important. Each ETF purchase requires the pay-
ment of a commission to your broker. Writing options on each ETF re-
quires paying another commission. Thus, concentrating your holdings
into fewer ETFs minimizes expenses. More important, using the ser-
vices of a deep-discount broker makes a significant difference in the
performance of your investment portfolio. You don’t ever want to find
yourself in a position where you want to make a trade but decide not do
so because trading expenses are too high.
• To use options efficiently, you want to own round lots (100-share in-
crements) of each ETF in your portfolio.
1
Each sample portfolio assumes an investment of $100,000, but you can
make adjustments to fit your financial condition. It’s easier to see how the
method works when real prices are used, and the prices throughout this
chapter were current in mid-2004.
SAMPLE PORTFOLIOS, ASSUMING
AN INVESTMENT OF $100,000
Sample Portfolio #1: Based on a Single Broad-Based Index If
you want to limit your portfolio to a single ETF and if you are interested in
owning shares in the American stock market, VTI provides the broadest
possible diversification. VTI is the symbol for the Vanguard Total Stock
Market VIPERs. This ETF tries to replicate the performance of the Wilshire
5000 index by owning a sampling of the stocks representing that index. As
of year-end 2003, according to the Vanguard Group, VTI represented own-
ership in 3,651 different stocks. It’s inefficient for this ETF to own shares of
each stock in the Wilshire 5000 index because many of those stocks are dif-
124 CREATE YOUR OWN HEDGE FUND
4339_PART4.qxd 11/17/04 12:57 PM Page 124
ficult to buy or sell in any reasonable quantity. Because sampling comes
very close to mimicking the performance of the entire index, it’s sufficient
to own these 3,600+ different stocks.
VTI is priced at approximately $110, so buy 900 shares spending
$99,000.
Sample Portfolio #2: Based on a Different Broad-Based Index
An alternative investment is the Russell 3000 index, consisting of the 3,000
largest publicly listed U.S. companies, representing about 98 percent of the
total capitalization of the entire U.S. stock market. According to Barclays
Global Investors, the ETF owned 2,946 of the 3,000 stocks early in 2004. The
symbol for the iShares Russell 3000 Index is IWV.
Priced near $65, you can buy 1,500 shares, investing $97,500.
Portfolios Based on Size of Companies
Sample Portfolio #3: Small-Cap Lover’s Portfolio Some in-
vestors prefer to own a portfolio consisting of smaller, faster-growing com-
panies, believing these stocks can provide better returns. During most
periods in our history, small-caps have outperformed the stocks of larger
companies, but this has not always been true.
To emphasize small caps, you can add shares of IWM to your portfolio.
IWM is the symbol for the iShares Russell 2000 index, which is comprised
of the smallest 2,000 companies in the larger Russell 3000 index. In other
words, it holds no shares of any of America’s largest 1,000 companies. Ob-
viously, the more shares of IWM you add, the more your portfolio empha-
sizes smaller capitalization stocks.
One possible portfolio:
Buy 1,000 shares of IWV (price approximately $65; cost $65,000).
Buy 300 shares of IWM (price approximately $117; cost $35,000).
Sample Portfolio #4: Mid-Caps You can build a portfolio consisting
of mid-cap stocks by purchasing shares of MDY, the S&P MidCap 400 index,
or IJH, the iShares representing the same index. As of this writing, MDY is
a better choice because the options are more actively traded.
Buy 900 MDY at $109, investing $98,100.
Sample Portfolio #5: Larger Companies Diamonds (DIA), the
ETF representing ownership of the 30 stocks in the Dow Jones Industrial
Building a Portfolio 125
4339_PART4.qxd 11/17/04 12:57 PM Page 125
Average, is a good choice for an investor who wants to concentrate on
owning shares of large, well-known companies.
If you prefer to own an ETF that has more than 30 stocks in its portfo-
lio and is better diversified then OEF, the iShares S&P 100 index fund may
be appropriate. This ETF tracks the performance of the Standard & Poor’s
100 index (OEX).
Buy 400 DIA at $105, investing $42,000.
Buy 1,000 OEF at $56, investing $ 56,000.
Sample Portfolio #6: Portfolio Avoiding Smaller Companies
If you prefer to own a mix of larger and mid-size companies and omit small-
capitalization stocks from your portfolio, consider:
Buy 500 MDY at $109, investing $54,500.
Buy 800 OEF at $56, investing $44,800.
Concentrating on Growth Stocks or Value Stocks
When investing in ETFs, you have the choice of buying a balanced portfo-
lio or a portfolio emphasizing either growth stocks or value stocks. For ex-
ample, several of the iShare ETFs that match the performance of a specific
index also offer ETFs that divide the stocks in the index into a growth sec-
tor and a value sector. These ETFs include the Russell 1000, Russell 2000,
Russell 3000, S&P MidCap 400 index, and S&P SmallCap 600 index.
Thus, you can buy shares of an ETF representing the entire index, or
just the growth or value portion of the indexes.
Here’s how it works: The stocks in a given index are ranked by their
price-to-book ratios. To determine the ratio, each stock’s price per share is
divided by its book value.
2
This ratio compares how the stock market val-
ues the shares of a company compared with the value of the company on its
financial statements.
The stock list is then divided into two parts. The stocks with the high-
est price-to-book ratios are placed in the growth index and those with the
lowest price-to-book ratios are placed in the value index.
The growth and value component indexes based on the Russell indexes
contain some duplication of stocks, as the fund managers consider some
stocks suitable for both the value and growth portfolios. The growth and
value components of the MidCap 400 and SmallCap 600 indexes do not
have any duplication of stocks.
The bottom line is that you have the choice of investing in only part (ap-
proximately half) of each of these indexes, if you prefer to emphasize either
growth or value stocks.
126
CREATE YOUR OWN HEDGE FUND
4339_PART4.qxd 11/17/04 12:57 PM Page 126
Sample Portfolio #7: Emphasizing Growth Stocks
Buy 400 VTI (Wilshire 5000) at $110, investing $44,000.
Buy 200 IJK (MidCap 400 Growth) at $123, investing $24,600.
Buy 300 IJT (SmallCap 600 Growth) at $93, investing $27,900.
Sample Portfolio #8: Emphasizing Value Stocks
Buy 300 DIA at $105, investing $31,500.
Buy 300 IJK (MidCap 400 Value) at $115, investing $34,500.
Buy 300 IJS (SmallCap 600 Value) at $105, investing $31,500.
Note: This portfolio is balanced between large-, mid- and small-
capitalization stocks and places two-thirds of the capital into value stocks.
Sample Portfolio #9: Includes
Investments in Foreign Stocks
It’s not necessary to limit your investments to American companies. Good
asset allocation suggests investing internationally. EFA is an ETF that at-
tempts to mimic the performance of the MSCI EAFE index—the Morgan
Stanley Capital International Europe, Australasia, and Far East—the bench-
mark used in the United States to measure international equity perfor-
mance. EFA invests in stocks from Europe, Australia, Asia, and the Far
East.
Priced near $140, shares of EFA can be added to any portfolio to pro-
vide additional diversification.
Sample portfolio stressing American mid-caps and foreign stocks:
Buy 100 EFA at $140, investing $14,000.
Buy 400 MDY at $109, investing $43,600.
Buy 400 VTI at 109, investing $43,600.
Sample Portfolio #10: Investment
in Specific Market Sectors
If you are willing to go against the teachings of MPT (this is not recom-
mended, but if it suits your investment style, you certainly are allowed to
make this type of investment) and accept the risks and potential rewards
that come with a less-diversified portfolio, you can apportion some of your
capital to specific industries. You can do this by owning shares of either
sector SPDRs or HOLDRs.
Building a Portfolio 127
4339_PART4.qxd 11/17/04 12:57 PM Page 127
If you believe that proper asset allocation includes investing in real es-
tate, one path to achieving that goal is to own shares of real estate invest-
ment trusts (REITs). You easily can invest in a suitable group of REITs by
owning shares of the iShares Cohen & Steers Realty Majors Index Fund
(ICF). This ETF seeks investment results corresponding to the perfor-
mance of large, actively traded U.S. real estate investment trusts, as repre-
sented by the Cohen & Steers Realty Majors index.
Adding real estate investments helps diversify your portfolio. If you be-
lieve that one or two specific sectors of the market (e.g., biotechnology)
represent the wave of the future and will outperform other types of invest-
ments, you may decide to allocate some of your investment capital to those
industries. A sample portfolio might contain:
Buy 100 BBH (Biotech HOLDRs) at $140, investing $14,000.
Buy 300 XLF (Financial Sector SPDR) at $29, investing $8,700.
Buy 100 ICF (Cohen & Steers REITs) at $106, investing $10,600.
Buy 100 MDY (MidCap 400 SPDR) at $109, investing $10,900.
Buy 500 VTI (Vanguard Total Market VIPERs) at $109, investing
$54,500.
SUMMARY
Although most ETFs do not have listed stock options, the variety of ETFs
that are optionable is sufficiently diverse to allow you to build a portfolio
that meets almost everyone’s needs. Table 13.1 contains the current list of
optionable ETFs. Table 13.2 lists the optionable HOLDRs and sector SPDRs.
Now that you know how to build a portfolio that meets your require-
ments, it’s time to think about the type of option strategy to adopt when
managing your portfolio.
128 CREATE YOUR OWN HEDGE FUND
4339_PART4.qxd 11/17/04 12:57 PM Page 128
Building a Portfolio 129
TABLE 13.1 Optionable ETFs
Underlying Exchange Traded Fund Symbol
DIAMONDs (DJIA) DIA
Nasdaq 100 Index Tracking Stock QQQ
FORTUNE 500 Index Tracking Stock FFF
iShares Cohen & Steers Realty Major ICF
iShares Dow Jones US Utilities Sector IDU
iShares Dow Jones US Energy Sector IYE
iShares Dow Jones US Financial Sector IYF
iShares Dow Jones US Healthcare Sector IYH
iShares Dow Jones US Technology Sector IYW
iShares Dow Jones US Telecommunications Sector IYZ
iShares Russell 1000 IWB
iShares Russell 1000 Growth IWF
iShares Russell 1000 Value IWD
iShares Russell 2000 IWM
iShares Russell 2000 Growth IWO
iShares Russell 2000 Value IWN
iShares Russell 3000 IWV
iShares Russell 3000 Growth IWZ
iShares Russell 3000 Value IWW
iShares Russell MidCap IWR
iShares Russell MidCap Growth IWP
iShares Russell MidCap Value IWS
iShares S&P 100 Index Fund OEF
iShares MidCap 400 Index IJH
iShares MidCap 400 BARRA Growth Index IJK
iShares MidCap 400 BARRA Value Index IJJ
iShares SmallCap 600 Index IJR
iShares SmallCap 600 BARRA Growth Index IJT
iShares SmallCap 600 BARRA Value Index IJS
MidCap SPDRs MDY
PowerShares Dynamic Market Portfolio PWC
PowerShares Dynamic OTC Portfolio PWO
Vanguard Total Market VIPERs VTI
iShares Goldman Sachs Networking Index IGN
iShares Goldman Sachs Semiconductor Index IGW
iShares Goldman Sachs Software Index IGV
iShares Goldman Sachs Technology Index IGM
iShares MSCI EAFE Index EFA
StreetTRACKS Dow Jones Global Titans Index DGT
Fidelity NASDAQ Composite Index ONQ
Source: American Stock Exchange
4339_PART4.qxd 11/17/04 12:57 PM Page 129
130 CREATE YOUR OWN HEDGE FUND
TABLE 13.2 Optionable HOLDRs and Sector SPDRs
Underlying Exchange Traded Fund Symbol
Biotech HOLDRs BBH
Broadband HOLDRs BDH
Europe 2001 HOLDRs EKH
Internet Architecture HOLDRs IAH
Internet HOLDRs HHH
Market 2000+ HOLDRs MKH
Oil Service HOLDRs OIH
Pharmaceutical HOLDRs PPH
Regional Bank HOLDRs RKH
Retail HOLDRs RTH
Semiconductor HOLDRs SMH
Software HOLDRs SWH
Telecom HOLDRs TTH
Utilities HOLDRs UTH
Wireless HOLDRs WMH
iShares NASDAQ Biotechnology Sector IBB
Select SPDR—Health Care XLV
Select SPDR—Materials XLB
Select SPDR—Consumer Staples XLP
Select SPDR—Energy XLE
Select SPDR—Financial XLF
Select SPDR—Industrial XLI
Select SPDR—Technology XLK
Select SPDR—Utilities XLU
Select SPDR—Consumer Discretionary XLY
Source: American Stock Exchange
4339_PART4.qxd 11/17/04 12:57 PM Page 130
131
CHAPTER 14
Finding Your Style
Choosing an Option to Write
Y
ou now own a diversified portfolio consisting of exchange traded
funds (ETFs), or are ready to purchase such a portfolio. For those
readers who do not yet have enough in savings to justify the brokerage
commissions involved in beginning this process, you can begin a savings
program by paying yourself first. This means investing some money from
every paycheck before you tackle any of your other bills. Go for passive in-
vesting and choose an index fund that charges very low fees. Periodically, as
you amass sufficient funds to benefit from the recommended program, you
can cash in your index funds to purchase ETFs and begin writing covered
calls against them. Depending on the ETFs you want to own, $10,000 may be
enough to get started. Thus, even if you are not yet ready to begin this pro-
gram, by mastering the investment methods described here, you will be pre-
pared to do so when your financial situation allows.
Once you own your ETF portfolio, the next step is selecting which call
option to write against each of your holdings. Sometimes you have a myr-
iad of choices; other times there may be just two or three options from
which to choose. It’s important to understand how to think about making a
final decision. There are no wrong decisions, but you have much to gain by
making the choice that provides the best fit for your investing style. In this
chapter we’ll go through an example, in detail, showing the thought
processes involved in considering each of the choices. That puts you in po-
sition to make an intelligent decision when selecting the option to write. In
the next chapter we’ll take an even closer look at the covered call writing
strategy as we follow a hypothetical portfolio for an entire year.
4339_PART4.qxd 11/17/04 12:57 PM Page 131