create your own hedge fund increase profits and reduce risks with etfs and options phần 9 pps
Bạn đang xem bản rút gọn của tài liệu. Xem và tải ngay bản đầy đủ của tài liệu tại đây (252.02 KB, 25 trang )
TABLE 15.9A
October Expiration Trades
B/S/W
Qty
SYM
Price
Call
Prem
Comm
Invested
B
500
VTI
111.40
10.00
($55,710.00)
W5
VTI
Oct 112
1.50
17.50
$732.50
B
200
MDY
114.15
10.00
($22,840.00)
W2
MDY
Oct 115
1.75
13.00
$337.00
EFA
140.01
W1
EFA
Oct 141
2.50
11.50
$238.50
B
200
OEF
57.04
10.00
($11,418.00)
W2
OEF
Oct 57
1.20
13.00
$227.00
Invested
($88,433.00)
Cash Start
$92,468.50
Cash Now
$4,035.50
182
4339_PART4.qxd 11/17/04 12:57 PM Page 182
TABLE 15.9B
October Expiration Positions
Profit
Down
ETF
Qty Price
Call
Invested
Break-Even Potential
Protect Return
VTI
500 111.40 Oct 112 ($54,967.50)
109.94 $1,012.50 1.32%
1.84%
MDY
200 114.15 Oct 115 ($22,493.00)
112.47
$487.00 1.48% 2.17%
EFA
100 140.01 Oct 141 ($13,762.50)
137.63
$317.50 1.70% 2.31%
OEF
200 57.04 Oct 58 ($11,181.00)
55.91
$399.00 1.99% 3.57%
Total Invested ($102,404.00)
$2,216.00
2.16%
Cash
$4,035.50
Total Account
$106,439.50
MAX Value
$108,655.50
183
4339_PART4.qxd 11/17/04 12:57 PM Page 183
TABLE 15.9C
October Expiration Results
Opening Ending
Current
Current
Sale
ETF Price Price Assigned
Position Cost
Value
Proceeds P/L
% P/L
VTI
111.40 112.03 Yes
0 ($54,967.50)
$55,980.00 $1,012.50 1.84%
MDY
114.15 114.80 No 200
($22,493.00) $22,960.00
$467.00 2.08%
EFA
140.01 142.13 Yes
0 ($13,762.50)
$14,080.00 $317.50 2.31%
OEF
57.04 57.25 No 200
($11,181.00) $11,450.00
$269.00 2.41%
Total
($102,404.00) $34,410.00 $70,060.00
$2,066.00 2.02%
Cash Start
$4,035.50
Cash End
$74,095.50
Beginning Account Value
$106,439.50
Ending Account Value
$108,505.50
184
4339_PART4.qxd 11/17/04 12:57 PM Page 184
Covered Call Writing In Action 185
NOVEMBER EXPIRATION
The overseas markets are lower this morning, but since I was assigned on
my short call position, I currently don’t own any shares of EFA. I’ll repur-
chase this morning and write my slightly OTM call option, as usual.
The markets are quiet and I am now fully invested. I used my idle cash and
now own 300 shares of OEF. But in order to have enough cash, I was forced
to write the slightly ITM OEF Nov 57 call because the Nov 58 call would not
have generated enough cash to enable me to buy that extra 100 shares of
OEF. As it is, I barely made it; my idle cash is now only $8. Because I have so
little cash, I will be unable to roll my positions up, if I were inclined to do so.
The November expiration trades are listed in Table 15.10A.
Positions are listed in Table 15.10B.
November was a strong month for small-capitalization stocks, but un-
fortunately my portfolio is underweighted in them. I was able to participate
to a small extent because my holding in VTI includes companies of all sizes.
But small-cap stocks rose over 3 percent in November while the rest of the
market drifted over a narrow trading range. The overseas markets contin-
ued to slide, and my EFA option expired worthless. All things considered,
it was a fine month and my year-to-date profits continue to increase.
Note: Diversifying the portfolio to include overseas stocks worked
against me this month. But owning such investments reduces risk. Earlier
this year owning overseas investments worked in my favor. Overall, diver-
sifying has been a benefit. Perhaps I should consider further diversification
when I reallocate my assets for the coming year. It’s something to think
about, but for now, I’ll stick with my current portfolio and won’t try to
chase the latest trend in the market by loading up on smaller stocks. The re-
sults for November are listed in Table 15.10C.
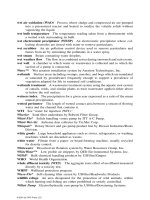
TABLE 15.10A November Expiration Trades
B/S/W Qty SYM Price Call Prem Comm Invested
B 500 VTI 112.01 10.00 ($56,015.00)
W5VTI Nov 112 1.70 17.50 $832.50
B MDY 114.77
W2MDY Nov 115 1.80 13.00 $347.00
B 100 EFA 140.08 10.00 ($14,018.00)
W1EFA Nov 141 2.20 11.50 $208.50
B 100 OEF 57.18 10.00 ($5,728.00)
W3OEF Nov 57 1.00 14.50 $285.50
Invested ($74,087.50)
Cash Start $74,095.50
Cash Now $8.00
4339_PART4.qxd 11/17/04 12:57 PM Page 185
TABLE 15.10B
November Expiration Positions
Profit
Down
ETF
Qty Price
Call
Invested
Break-Even Potential
Protect Return
VTI
500 112.01 Nov 112 ($55,172.50)
110.35
$802.50 1.49% 1.45%
MDY
200 114.77 Nov 115 ($22,607.00)
113.04
$373.00 1.51% 1.65%
EFA
100 140.08 Nov 141 ($13,799.50)
138.00
$280.50 1.49% 2.03%
OEF
300 57.18 Nov 57 ($16,868.50)
56.23
$157.50 1.66% 0.93%
Total Invested ($108,447.50)
$1,613.50
1.49%
Cash
$8.00
Total Account
$108,455.50
MAX Value
$110,069.00
186
4339_PART4.qxd 11/17/04 12:57 PM Page 186
TABLE 15.10C
November Expiration Results
Opening Ending
Current
Current
Sale
ETF Price Price Assigned
Position Cost
Value
Proceeds P/L
% P/L
VTI
112.01 112.15 Yes
0 ($55,172.50)
$55,980.00 807.50 1.46%
MDY
114.77 114.97 No 200
($22,607.00) $22,994.00
387.00 1.71%
EFA
140.01 137.35 No 100
($13,799.50) $13,735.00
(64.50) –0.47%
OEF
57.18 57.22 Yes
0 ($16,868.50)
$17,080.00 211.50 1.25%
Total
($108,447.50) $36,729.00 $73,060.00
1,341.50 1.24%
Cash Start
$8.00
Cash End
$73,068.00
Beginning Account Value
$108,455.50
Ending Account Value
$109,797.00
187
4339_PART4.qxd 11/17/04 12:57 PM Page 187
188 CREATE YOUR OWN HEDGE FUND
Note that something very interesting happened this month in my MDY
position. I made more money than I thought I could possibly make from this
position. When I calculate my best possible return, I assume the ETF rises
above the strike price and I am assigned an exercise notice. When that hap-
pens, I pay an assignment fee of $20. This time MDY closed at 114.97, or
only 3 cents below the strike price. Thus, I did not receive an exercise no-
tice, did not pay the $20 fee, and my 200 shares are worth only $6 less than
they would be if they were priced at the strike price. I have $6 less but saved
$20 for an increased profit of $14. Not a lot of money, but a great result!
My year-to-date profit is almost 10 percent while the S&P 500 index is
barely 3 percent ahead.
DECEMBER EXPIRATION
The markets are mixed this morning, and I reinvested my cash. Call option
prices are a bit lower than they have been recently. Not a lot lower, but five to
ten cents less for each option I’m selling. I could wait a day or two and hope
that option prices rebound, but I won’t do so for three important reasons:
1. Not only do I want to be fully invested at all times, but I also want
those investments to be hedged at all times.
2. There is no guarantee that option prices will rebound, and they might
even decline further.
3. Because options are a wasting asset, the price I expect to receive when
writing a call declines daily (all things being equal).
The trades are listed in Table 15.11A.
My positions for December are listed in Table 15.11B.
December is a good month for the market. The holiday rally is in full
force both here and overseas. I never reach the point where I want to roll
my positions to higher strikes.
I did not participate in a portion of the rising market. The S&P 500
index moves 5 percent higher in December and I settle for my maximum
profit, which is 1.41 percent for the month. I’m still doing better than the
overall market for the year, but this result illustrates one of the risks in-
volved when using a covered call writing program—upside profits are lim-
ited unless I roll my positions in a timely manner. I’ve decided that making
my target profit each month is more than acceptable, and if others do bet-
ter when the bull market is alive, that’s OK. I know I’ll do better than other
4339_PART4.qxd 11/17/04 12:57 PM Page 188
Covered Call Writing In Action 189
investors when markets move lower or are stagnant. Besides, I’m not in
competition with anyone else. I’m managing my money to fit my needs.
My results for the month of December are listed in Table 15.11C.
I see no reason to alter my investment style and will continue on the
same path for the final month of the year.
JANUARY EXPIRATION
The recent rally means I must repurchase my ETFs at much higher prices
than before. I was assigned on all positions and have only cash remaining
in my account. This is the equivalent of being forced to roll my positions to
higher strike prices. Of course, I can refuse to roll the positions by stub-
bornly writing ITM calls. I won’t succumb to that trap because (I have to re-
peat it to myself often to make sure I resist the temptation) I know I am not
good at predicting in which direction the market is going to move next.
Thus, I’ll stay with writing options that are at the money for domestic in-
vestments and one point out of the money for my foreign holdings.
The high prices present another problem. I no longer have enough cash
to repurchase the full positions I owned last month. I’m cutting back my
OEF investment to 200 shares.
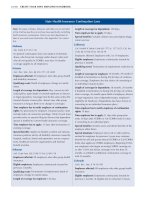
TABLE 15.11A December Expiration Trades
B/S/W Qty SYM Price Call Prem Comm Invested
B 500 VTI 111.94 10.00 ($55,980.00)
W5VTI Dec 112 1.55 17.50 $757.50
MDY 115.02
W2MDY Dec 115 1.80 13.00 $347.00
EFA 137.01
W1EFA Dec 138 1.95 11.50 $183.50
B 300 OEF 57.20 10.00 ($17,170.00)
W3OEF Dec 57 0.90 14.50 $255.50
Invested ($71,606.50)
Cash Start $73,068.00
Cash Now $1,461.50
4339_PART4.qxd 11/17/04 12:57 PM Page 189
TABLE 15.11B
December Expiration Positions
Profit
Down
ETF
Qty Price
Call
Invested
Break-Even Potential
Protect Return
VTI
500 111.94 Dec 112 ($55,212.50)
110.43
$767.50 1.35% 1.39%
MDY
200 115.02 Dec 115 ($22,657.00)
113.29
$323.00 1.51% 1.43%
EFA
100 137.01 Dec 138 ($13,517.50)
135.18
$262.50 1.34% 1.94%
OEF
300 57.20 Dec 57 ($16,904.50)
56.35
$175.50 1.49% 1.04%
Total Invested ($108,291.50)
$1,528.50
1.41%
Cash
$1,461.50
Total Account
$109,753.00
MAX Value
$111,281.50
190
4339_PART4.qxd 11/17/04 12:57 PM Page 190
TABLE 15.11C
December Expiration Results
Opening Ending
Current
Current Sale
ETF Price Price Assigned
Position Cost
Value Proceeds
P/L
% P/L
VTI
111.94 117.44 Yes 0
($55,212.50)
$55,980.00 767.50 1.39%
MDY
115.02 120.99 Yes 0
($22,657.00)
$22,980.00 323.00 1.43%
EFA
137.01 145.22 Yes 0
($13,517.50)
$13,780.00 262.50 1.94%
OEF
57.20 58.88 Yes 0
($16,904.50)
$17,080.00 175.50 1.04%
Total
($108,291.50) $0.00 $109,820.00
1,528.50 1.41%
Cash Start
$1,461.50
Cash End
$111,281.50
Beginning Account Value
$109,753.00
Ending Account Value
$111,281.50
191
4339_PART4.qxd 11/17/04 12:57 PM Page 191
192 CREATE YOUR OWN HEDGE FUND
January trades are listed in Table 15.12A.
My positions are listed in Table 15.12B.
The year-end rally continues for a few days, but after the New Year’s
break, the market heads lower. The downward move is without conviction,
and January expiration arrives with the market losing less than one-half of
1 percent for the expiration period. This represents another good month for
my covered call writing program. For the past 12 months I’ve been working
on my new investment strategy. I’ve learned a great deal and am going to
continue writing covered calls next year.
The results for January expiration are listed in Table 15.12C.
My profits for the year are 12.32 percent, while the S&P 500 index
gained 9.0 percent over the same time period. I have a busy weekend ahead.
Besides making the usual decision about which ETFs to own, it’s time to
make my annual decision on how to allocate my assets. I want to decide
just how much of my overall portfolio should be invested in the stock mar-
kets of the world. Thus, I’ll either be adding some additional cash to my
covered call writing program or removing some for investment elsewhere.
I’m looking forward to another profitable year with my newfound invest-
ment methodology.
In Chapter 16 we’ll take a similar (but less detailed) look at how writ-
ing uncovered put options works. There are educational points of interest,
even for investors who intend to stay with the covered call strategy.
TABLE 15.12A January Expiration Trades
B/S/W Qty SYM Price Call Prem Comm Invested
B 500 VTI 117.49 10.00 ($58,755.00)
W5VTI Jan 118 1.45 17.50 $707.50
B 200 MDY 121.00 10.00 ($24,210.00)
W2MDY Jan 121 2.00 13.00 $387.00
B 100 EFA 145.48 10.00 ($14,558.00)
W1EFA Jan 147 2.00 11.50 $188.50
B 200 OEF 58.91 10.00 ($11,792.00)
W2OEF Dec 59 0.85 13.00 $157.00
Invested ($107,875.00)
Cash Start $111,281.50
Cash Now $3,406.50
4339_PART4.qxd 11/17/04 12:57 PM Page 192
TABLE 15.12B
January Expiration Positions
Profit
Down
ETF
Qty Price
Call
Invested
Break-Even Potential
Protect Return
VTI
500 117.49 Jan 118 ($58,047.50)
116.10 $932.50 1.19%
1.61%
MDY
200 121.00 Jan 121 ($23,823.00)
119.12 $357.00 1.56%
1.50%
EFA
100 145.48 Jan 147 ($14,369.50)
143.70 $310.50 1.23%
2.16%
OEF
200 58.91 Jan 59 ($11,635.00)
58.18 $145.00 1.23%
1.23%
Total Invested ($107,875.00)
$1,745.00
1.62%
Cash
$3,406.50
Total Account
$111,281.50
MAX Value
$113,026.50
193
4339_PART4.qxd 11/17/04 12:57 PM Page 193
TABLE 15.12C
January Expiration Results
Opening Ending
Current
Current
Sale
ETF Price Price Assigned
Position Cost
Value
Proceeds P/L
% P/L
VTI
117.49 116.98 No 500
($58,047.50) $58,490.00
442.50 0.76%
MDY
121.00 120.35 No 200
($23,823.00) $24,070.00
247.00 1.04%
EFA
145.48 146.13 No 100
($14,369.50) $14,613.00
243.50 1.69%
OEF
58.91 58.71 No 200
($11,635.00) $11,743.50
107.00 0.91%
Total
($107,875.00) $108,916.50 $0.00
1,040.00 0.96%
Cash
$3,405.00
Beginning Account Value
$111,281.50
Ending Account Value
$112,321.50
194
4339_PART4.qxd 11/17/04 12:57 PM Page 194
195
CHAPTER 16
Uncovered Put
Writing in Action
Writing uncovered puts has some advantages over writing covered calls:
• It is less expensive because commissions are reduced. The trade involves
writing one put option. Covered call writing consists of two trades: buy-
ing exchange traded fund (ETF) shares and writing one call option.
• Initiating a position does not require legging into the position you want
to own because writing the put option is a single transaction.
1
• It is easier to close a position when locking in a profit. Buying a put to
close a position is a simple one-step process.
However, there is one disadvantage to writing uncovered puts that is more
important than the advantages: Some brokers do not allow their customers to
write naked put options under any circumstances. If your broker prohibits this
strategy, it’s strongly recommended that you find a more cooperative broker.
However, if you wish to maintain your account with that broker, covered call
writing is an equivalent investment strategy. (See Chapter 15.)
One word of caution is required. When writing naked put options, if
your positions are cash backed then you never have to worry about receiv-
ing a margin call from your broker. A position is cash backed when there is
sufficient cash in the account to pay for stock if you are assigned an exer-
cise notice for the put options you sold. If the cash is in your account, the
maximum risk for the position is known (and is essentially equivalent to
that of any other shareholder).
2
If you do not have enough cash, and if you are assigned an exercise
notice on puts you wrote, it’s possible your broker will issue a margin call,
4339_PART4.qxd 11/17/04 12:57 PM Page 195
requiring you to (immediately) deposit additional cash or securities into
your account. This is a situation you want to avoid. Some brokers don’t
provide any warning and simply close positions (of their choosing) to raise
the needed cash.
If you are writing naked puts for the first time, begin by having cash to
back all your positions. As you become more acquainted with writing un-
covered puts and the risks involved,
3
you may decide to borrow money
from your broker and own uncovered put positions that are only partially
backed by cash. Using margin provides an opportunity to increase your
profits, but it also enhances risk.
4
Trading on margin is not for everyone,
and a discussion of this topic is beyond the scope of this book.
You must be certain not to write more uncovered puts than your finan-
cial situation allows. This is especially true if you are trading with borrowed
money from your broker (margin). Please reread the warning in Chapter 11.
QUICK REVIEW
Consider two positions:
1. Covered call
Buy 200 shares of MDY at $118.
Write 2 Dec 118 calls at $2.00.
2. Naked put
Write 2 Dec 118 MDY puts at $2.00.
Table 16.1 lists the risks and rewards of owning each position. Notice
the risk profiles are identical. The maximum potential profit and the down-
side break-even point are the same. Neither position is riskier than the
196
CREATE YOUR OWN HEDGE FUND
TABLE 16.1 Compare Covered Call with Uncovered Put
Covered Call Uncovered Put
Long Position 100 MDY @ 118 None
Short Position 1 MDY Dec 118 call @ 2 1 MDY Dec 118 put @ 2
Max Profit $200 $200
Max Loss $11,600 $11,600
Max Profit MDY above 118 MDY above 118
Extra Gain if above 118 $0.00 $0.00
Downside B/E 116 116
Loss if below B/E $100 per point $100 per point
B/E: Break-even point
4339_PART4.qxd 11/17/04 12:57 PM Page 196
other, regardless of well-meaning investment advisors who tell you that
writing naked options is dangerous.
Let’s take a closer look at a hypothetical three-month trading period.
The purpose is to illustrate the thoughts that occur to the investor/trader
and how potential problems are resolved.
JUNE EXPIRATION
I have $100,000 to invest. After careful consideration, I’m going ahead with
the naked put writing program. I’m going to concentrate on the American
stock market. Yet with thousands of stocks, I feel sufficiently diversified.
I’ve had success investing in small-capitalization stocks over the years, so I
am going to emphasize those in my portfolio. I’m also investing a small
amount in high-technology stocks. I’ve decided to take positions in these
ETFs:
• IWV (Russell 3000 index consists of the 3,000 largest capitalized stocks)
• IWM (Russell 2000 Index consists of the smallest 2,000 stocks in the
3000 index)
• QQQ (Nasdaq 100 index)
My plan is to be virtually 100 percent cash backed, but I’m not going to be
concerned if I fall a few dollars short.
5
There are currently five weeks until
the June expiration.
I found it simple to make my trades, and the positions are listed in Table
16.2A. I’m writing put options that are slightly out of the money, positions
that are equivalent to covered call positions that are slightly in the money.
Uncovered Put Writing In Action 197
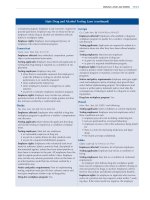
TABLE 16.2A June Expiration Trades
Cash
B/S/W Qty SYM Price Put Prem Comm Net Credit Backing
W4IWV 65.10 Jun 65 $0.90 16.00 $344.00 $26,000.00
W4IWM 118.00 Jun 118 $3.00 16.00 $1,184.00 $47,200.00
W7QQQ 38.22 Jun 38 $0.85 20.50 $574.50 $26,600.00
Collected $2,102.50
Required $99,800.00
Cash Start $100,000.00
Cash Now $102,102.50
Excess Cash $2,302.50
Net Credit: Cash collected from writing put options
Cash Backing: Cash required to maintain each position, if not using margin
Required: Total cash required to maintain all positions, if not using margin
Excess Cash: Cash above requirement
4339_PART4.qxd 11/17/04 12:57 PM Page 197
Methodology
If the put expires worthless, then I’ll achieve the same result I would have
achieved with a covered call position. That means I’ll have the same profit
(in reality, a slightly higher profit due to reduced commissions) and no
residual position. I’ll have to reinvest in a new position after expiration.
If the put finishes in the money, I’ll be assigned on my position and own
the ETF shares, paying the strike price. This is the identical result as the
covered call writer has when the call options expire out of the money (and
worthless), leaving that investor owning the ETF shares. Just as the cov-
ered call writer writes new calls after expiration, I plan to do exactly the
same.
If those covered call options expire worthless, I’ll continue to write
new calls the following month. If I am assigned and forced to sell my ETF
shares, I’ll continue with my investment strategy by initiating a new posi-
tion—writing naked puts for the following expiration period.
Thus, if my puts expire worthless, I’ll continue with my plan to write
new puts. But if I’m assigned and own the shares, I’ll revert to the covered
call writing program. This method is flexible.
Note: When writing naked puts, the profit potential equals the premium
collected from those sales.
The positions and the profit potential for each position are listed in
Table 16.2B.
June (this is not the same year as used for the covered call writing ex-
amples) is a mixed bag for the market. The S&P 500 is unchanged, but tech-
nology stocks take a beating and I am assigned on my QQQ puts. However,
the good news is that my other puts expire worthless. Overall my first
month writing naked puts is profitable. The results are listed in Table 16.2C.
JULY EXPIRATION
I own shares of QQQ so am writing call options against them. I’m also initi-
ating new positions in IMV and IMW put options.
The market opens almost unchanged from last Friday’s close, and I
quickly open my new positions. The trades are listed in Table 16.3A. The
July expiration is only four weeks away, so option premiums are lower
than last month.
There was enough excess cash to allow me to buy an extra 100 shares
of QQQ and write eight calls, instead of seven. I chose not to make this
trade, even though I want to remain as fully invested as possible. Here’s
why: I feel I already have enough invested in the technology index and pre-
198
CREATE YOUR OWN HEDGE FUND
4339_PART4.qxd 11/17/04 12:57 PM Page 198
TABLE 16.2B
June Expiration Positions
Cash
Profit
Down
ETF Qty Price Put
Put Sale
Backing
Break-Even Potential Protect
% P/L
IWV
4 65.10 Jun 65
$344.00 $26,000.00 $64.19 $344.00
1.40% 1.32%
IWM
4 118.00 Jun 118 $1,184.00
$47,200.00 $115.09 $1,184.00 2.47%
2.51%
QQQ
7 38.22 Jun 38
$574.50 $26,600.00 $37.21 $574.50
2.65% 2.16%
Collected
$2,102.50
$2,102.50
2.11%
Required
$99,800.00
Account Value $100,000.00
Cash
$102,102.50
MAX Value $102,102.50
Cash Backing:
Cash required to buy ETF shares, if assigned on puts.
Break-Even:
Downside break-even price. Includes payment of $20 assignment fee.
% P/L: Profit divided by cash backing requirement.
Note:
This is the conservative calculation. If using margin, potential returns are
significantly higher.
MAX Value:
Value of account, if all puts expire worthless.
199
4339_PART4.qxd 11/17/04 12:57 PM Page 199
TABLE 16.2C
June Expiration Results
Opening Ending
Current
Current
ETF Price
Price Assigned Position
Cost
Value
P/L
% P/L
IWV
65.10 65.05 No
0
344.00 1.32%
IWM
118.00 118.04 No
0
1,184.00 2.51%
QQQ
38.22 36.67 Yes
700
$26,045.50 $25,669.00 (376.50) –1.45%
Total
$26,045.50 $25,669.00 1,151.50
1.15%
Cash Start
$102,102.50
Cash End
$75,482.50
Beginning Account Value
$100,000.00
Ending Account Value
$101,151.50
Current Position:
Number of shares owned, if assigned
Cost:
# Shares
× Strike Price + $20 (assignment fee) – put premium collected
%P/L:
Profit (Loss) / (Cash Backing Requirement)
Cash End:
Starting cash less ETF cost
200
4339_PART4.qxd 11/17/04 12:57 PM Page 200
Uncovered Put Writing In Action 201
fer to put my money to work by buying additional shares of the Russell 2000
index. I’ll use idle cash to buy 100 shares of IWM at my first opportunity.
My current positions are listed in Table 16.3B.
July is a losing month for the market. The decline starts slowly and
picks up momentum as the days pass. Within two weeks the S&P 500 index
has declined almost 3 percent. My positions are still reasonable, as two of
the three ETFs I own are trading near my break-even prices. I don’t want to
roll the positions but will do so in the interests of protecting the value of my
portfolio. If I don’t roll, I’ll be betting the market will recover its recent
losses. I don’t want to find myself betting on the direction of the next mar-
ket move. By owning a bullish portfolio, I’m already positioned to profit
when the market rallies, so buying additional protection against loss is a
prudent investment choice.
Notice my downside protection for IWV is only about half that for the
other ETFs (Table 16.3B). Here’s why: The Russell 3000 index is not very
volatile, and the implied volatility of the options is fairly low. As a result, the
premium I collect when writing new IWV options is less than the premium
I receive from writing options on my other ETFs. Lower option premium
means less downside protection as well as lower potential profit.
One of the reasons I prefer to own shares of IWV is because of its re-
duced volatility. It is safer to own IWV shares than it is to be an investor in
some of the other ETFs. In return for that extra safety, I must accept lower
option prices (less risk = less reward). This is one of those areas in which
each investor’s individual tolerance for risk enters the picture. If you prefer
to seek higher returns and are willing to own a more volatile investment,
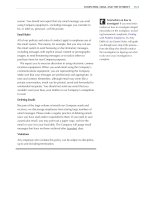
TABLE 16.3A July Expiration Trades
Net Cash
B/S/W Qty SYM Price Option Prem Comm Credit Backing
W4IWV 65.02 Jul 65 Put $0.85 16.00 $324.00 $26,000.00
W4IWM 118.06 Jul 118 Put $2.95 16.00 $1,164.00 $47,200.00
W7QQQ 36.70 Jul 37 Call $0.75 20.50 $504.50
Collected $1,992.50
Required $73,200.00
Cash Start $75,482.50
Cash Now $77,475.00
Excess Cash $4,275.00
Option: Call or put
Cash Backing: Cash required to maintain each uncovered put position
4339_PART4.qxd 11/17/04 12:57 PM Page 201
TABLE 16.3B
July Expiration Positions
Profit
Down
ETF Qty Price Option
Cash Backing Invested
Break-Even Potential Protect
% P/L
IWV
4 65.02 Jul 65 Put $26,000.00
$64.24 $324.00 1.20% 1.25%
IWM
4 118.06 Jul 118 Put $47,200.00
$115.14 $1,164.00 2.47% 2.47%
QQQ
700 36.70
QQQ
7
Jul 37 Call
$25,185.50 $35.98 $694.50
2.81% 2.76%
$25,185.50
$2,182.50
2.22%
Required $73,200.00
Account Value $101,150.50
Cash
$77,475.00
MAX Value $103,333.00
202
4339_PART4.qxd 11/17/04 12:57 PM Page 202
Uncovered Put Writing In Action 203
then the mix of ETFs in your portfolio can be shifted to reflect those
wishes. For example, if I were interested in trying to earn a higher return, I
would own fewer shares of IWV and more shares of IWM.
Note: Indexes are composed of many stocks and are less volatile than
most individual stocks. One reason: When some stocks in the index de-
crease in value, others increase. These price changes offset each other,
making the overall index less volatile. Thus, if you are seeking even higher
returns from writing covered calls or writing uncovered puts, then you can
include some individual stocks in your portfolio mix. Just be aware that
doing so significantly increases overall risk. Here’s why: Any individual
stock can have a surprise announcement at any time, and that announce-
ment can have a large influence on the stock price. It is far less likely that
the price of an index will undergo a rapid price change; such a change re-
quires a news event that affects the whole stock market. This is more of the
same old story—seek a higher return on your investment if you choose to
do so, but you must accept a higher risk in an attempt to earn that return.
Having decided to roll my positions, the trades are listed in Table 16.3C.
My positions and optimal results are listed in Table 16.3D.
The IWV numbers represent one of the potential unhappy outcomes
when forced (for safety considerations) to roll a position. The potential
profit is negative. Thus, if the best possible result is obtained—the put ex-
pires worthless—the position still loses money for the month. This occurs
because it cost more cash to roll the position than I received when writing
the puts in the first place. Thus, I have a net debit,
6
and there is no way to
recover that cash from the current position.
The market continues to drift lower and then rallies. Expiration arrives
with the major market indexes lower by about 3 percent for the month. The
QQQ calls expired worthless, and I was assigned on my short IWV put
options.
But something unusual happened with my IWM position. Two puts
expired worthless, and I was assigned on the other two. This situation
doesn’t occur often, but whenever the option is within a few pennies of the
strike price, it’s possible for options to expire worthless, even if they are in
the money.
There are several reasons why slightly ITM options can expire
worthless:
• When options cease trading a few minutes after the market closes on
expiration Friday, there is usually no bid higher than zero for these op-
tions.
7
Thus an investor who still owns these options is unable to sell.
• If the option owner decides to exercise the option, there are expenses
and risks involved.
• The option owner must pay a commission to exercise the options
4339_PART4.qxd 11/17/04 12:57 PM Page 203
TABLE 16.3C
July Expiration: Trades To Roll Position
Current Bought
Buy Sold
Sell Spread
Net
ETF Qty Price Option
Price Option
Price Cash
Comm Cash
IWV
4 63.08 Jul 65 Put $2.05
Aug 63 Put $1.00 ($1.05) $32.00
($452.00)
IWM
4 114.50 Jul 118 Put $4.10
Aug 115 Put $3.40 ($0.70) $32.00
($312.00)
QQQ
7 35.48 Jul 37 Call $0.15
Aug 36 Call $0.80 $0.65 $41.00
$414.00
Cost to Roll
($350.00)
Old Cash
$77,475.00
New Cash
$77,125.00
Net Cash:
Difference between buy and sell prices.
Negative value:
net debit paid; positive value: net credit collected.
204
4339_PART4.qxd 11/17/04 12:57 PM Page 204
TABLE 16.3D
July Expiration: Positions after Rolling
Current New
Put Sale
Cash
Profit
Down
ETF Qty Price Option
Proceeds Invested Backing
Break-Even Potential Protect
Return
IWV
4 63.08 Aug 63 Put ($128.00)
$25,200.00 None ($128.00) None –0.51%
IWM
4 114.50 Aug 115 Put $852.00
$46,000.00 112.87 $852.00 1.42%
1.85%
QQQ
700 35.48
($24,771.50)
35.39 $408.50 0.26% 1.65%
QQQ
7
Aug 36 Call
($24,771.50) $71,200.00
$1,132.50
1.12%
Cash
$77,125.00
Beginning Value $101,150.50
New MAX Value $102,283.00
Qty:
Number of options or ETF shares
Put Sale Proceeds:
Total for month: original put sale plus cost to roll
Break-Even:
“None” means position cannot return a profit this month
Down Protect:
“None” means there is no price at which position is profitable this month
205
4339_PART4.qxd 11/17/04 12:57 PM Page 205
206 CREATE YOUR OWN HEDGE FUND
• The option exerciser incurs the risk of owning a position—long if
the option is a call and short if the option is a put—in the underlying
asset until the market opens next Monday. The market can easily
move in the wrong direction, resulting in a significant loss.
• The option exerciser must pay another commission to close the
position.
• Two commissions plus market risk make it easy for the investor
who owns the option simply to allow it to expire worthless. There is
too much expense and risk involved in attempting to capture the few
pennies of intrinsic value in the option.
Results for July are listed in Table 16.3E.
July was an interesting month. Not only did I earn a small profit when
the market was lower, but I also discovered for myself that I cannot make
any assumptions regarding assignments. I now know it’s important to
check with my broker before making any trades on the Monday follow-
ing expiration to verify which options expired worthless and which were
assigned.
8
AUGUST EXPIRATION
I am still long my QQQ shares and am writing new call options against them.
I now own 200 IWM shares, so I have two call options to write. Because
I want a position representing 400 shares and because I prefer to write put
options, I’ll also write two new put options. Thus I’ll have two separate po-
sitions in IWM: two covered calls and two uncovered puts. That’s equiva-
lent to two covered straddles.
9
I was assigned on my IWV shares, and I am writing calls to hedge the
position. But after writing new options this month, I’ll have enough excess
cash to increase my investment in IWV. I plan to purchase 100 additional
shares of IWV and write an additional call. There are two points of interest
here.
1. I prefer writing a put option, but because I already own 400 shares and
am writing four call options, it’s easier (and saves money in commis-
sions) to add to my covered call position than to write a new uncovered
put position. If I were buying more than 100 shares, then I would prob-
ably choose to write put options.
2. To ensure that I have enough cash to make this new trade and to mini-
mize commissions, I plan to make this transaction last. First, I’ll sell all
the options I’m selling this month. (This generates some of the cash I
4339_PART4.qxd 11/17/04 12:57 PM Page 206