Professional Stock Trading System Design and Automation phần 5 pot
Bạn đang xem bản rút gọn của tài liệu. Xem và tải ngay bản đầy đủ của tài liệu tại đây (1.3 MB, 16 trang )
114
5 Geometric Trading
5.3.3 Electro-Optical Engineering
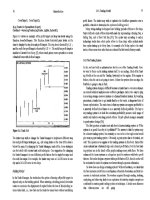
This is our favorite rectangle of all time, as shown in Figure 5.4. We emphasize
the point about not using trend filters for rectangles because stocks tend to move
up above rectangles at bottoms and explode down out of rectangles at tops (refer
to Figure 5.2). Here, the rectangle was under the MA50 at the breakout.
Figure 5.4. Electro-Optical Engineering Rectangle
5.3.4 Stericycle
Figure 5.5 is an example of multiplicity- multiple rectangles and multiple signals
all coming together to form a powerful move.
5.4 Double Bottom
115
5.4 Double Bottom
Much of the technical analysis literature places geometric patterns into either
bullish or bearish categories. For example, the double bottom is considered to be a
bullish formation. Our stance is that a double bottom is bullish only if it works.
The problem with bottoms and tops is that by the time they can be recognized,
the good trade may have already occurred. If a stock has established a low several
bars ago, then every bar thereafter approaching that low is a potential double
bottom. The question for the trader is: How must the price action develop to
prove that in fact a double bottom has occurred, and how soon can a long trade
be entered? If the price breaks below the previous low, then should the trader go
short on that breakdown?
The answer is that the trader requires a bullish bar pattern to trigger a long
entry. When price tests a previous low, then that is a possibly bullish Test pat-
tern. Since a Test bar must close near the high of its range, this is the first sign
that a double bottom has probably been established, and only then can a long
entry be considered. The pattern does not have to strictly be a Test pattern, but
simply a bar that closes near the high.
In Figure 5.6, look at the last bar of the double bottom. The line can only be
drawn once the low of the day has been established, and that is not known until
the end of the day (although confidence increases as the end of the day ap-
proaches). If one thinks of the optimal entry under intraday conditions, then the
trader must be alerted to the condition that a double bottom is possibly being
formed based on the current low of the day, i.e., the double bottom line can be
drawn in real-time throughout the day and redrawn as the low of the day
changes, as long as the low stays within the parameters of what constitutes a
double bottom.
116
5 Geometric Trading
The best intraday solution is to enter a trade when a stock goes green, at which
point the long entry is triggered. The risk/reward ratio of this trade is good be-
cause the stop can be placed at the low of the day, and then the position can be
held until the end of the day. If the stock closes up on the day or even near the
high, then the trader has effectively anticipated the double bottom, and the
nightly scans will recognize the double bottom with a bar that closed strongly on
the day. In turn, other traders will take long positions on the following day when
the high is exceeded.
Figure 5.6 is an example of a single double bottom (one line). In the next
few examples, we show how consecutive instances of the same pattern (multiple
lines) alert the trader to impending moves. Further, we apply the concept of an
ATR factor to construct bottom and top formations where the pivot points are
not perfectly connected.
5.5 Double Top
The chart in Figure 5.7 shows a Double Top formation of three parallel lines
with the same origin. Notice how two of the lines do not touch the exact high of
the origin of the double top because we use the same principle that has been ap-
plied throughout the book: a range factor or a percentage of the ATR. For all
bottoms and tops, the Acme software uses a RangeFactor of 0.3, or 30% of the
ATR. Thus, if a high is within the tolerance of a previous high, then the forma-
tion qualifies as a double top.
5.5 Double Top
117
For example, suppose the current high is 21.5 and the high of the previous high
pivot bar is 21.25, a difference of 0.25 points. If the ATR of the stock is 0.9,
then the allowable difference is 0.3 x 0.9 = 0.27 points. Consequently, this high
qualifies as a double top.
At this point, the concept of multiplicity cannot be emphasized enough.
The first double top in Figure 5.7 is an NR bar. The second double top is a
bearish Cobra, signified by the close at the low of the day. At this point, the
trader may not even wait for the short trigger with two consecutive double tops.
Finally, the third double top is a Hook that breaks the low of the previous day.
This serves as another confirmation for a short entry. The EasyLanguage code
for detecting a Double Top is shown in Example 5.4.
The code for finding bottoms and tops is based on the concept of a pivot bar,
also known as a swingbar. Each pivot bar has a characteristic known as strength,
a. reference to the number of bars on either side of the bar. For a high pivot, the
strength refers to the number of bars on either side that are lower than the pivot
price. For a low pivot, the strength refers In the number of bars that are higher
than the pivot price. Further, each pivot can have a separate left strength and
118
5 Geometric Trading
right strength. If a high pivot bar has a left strength of three and a right strength
of two, then the three highs to the left and the two highs to the right are lower
than the pivot bar high. Typically, the left strength is equal to the right strength
for symmetry. The default strength for the Acme indicators is four.
The AcmeDoubleTop function has a chart window to look for high and low
pivots, scoped by the parameter LookbackBars. It first locates a high pivot and a
low pivot. If both are found, then the function goes on to test other conditions
to qualify the pattern as a double top. First, the origin of the double top must be
at least seven bars away (this parameter can be adjusted). Second, the difference
between the high of the current bar and the high of the origin of the top must be
less than a certain percentage of the ATR; by definition, either of these values
must be the highest high of the range. Finally, the high pivot must be greater
than the low pivot.
5.6 Triple Bottom
The difference between the double bottom and triple bottom is that the former is
drawn across two pivots and the latter across three pivots. Figure 5.8 is an exam-
ple of a double triple bottom. Note the difference between an intraday entry on
the second triple bottom and an entry the following day. The stock closed near
39 on the day of the second triple bottom, nearly three points above the low of
36, making a second day entry a low-probability trade. On that second day, the
stock gapped open at 39, tested 40, and closed at the low of the day near 38.
5.7 Triple Top
119
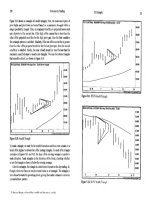
5.7 Triple Top
The Triple Top has cachet. A stock attempts to break out for the third time, and
all of the bulls get lathered up about its big breakout potential. As with any
other simple pattern, its success rate is not as high as one might be led to believe.
If the pattern were that easy to trade, then there would be a Web site named
www.tripletop.com, and every trader would flock to it.
In Figure 5.9, notice how many times in early June the index tried to break
above the triple top-once, then three bars later twice, the next bar, and the next
bar. A buy stop a tick above the high would have been stopped out twice, while
an ATR factor would have prevented both trades.
Figure 5.9. Triple Top
5.8 Triangle
A Triangle is a consolidation pattern with a narrowing range. A trend line slop-
ing down connects the highs, and a trend line sloping up connects the lows. As
with other geometric patterns, we devised a new way of looking at a triangle
with multiplicity. The formation is called a Stealth Triangle because of its re-
semblance to the B-2 Spirit
1
, a multi role bomber.
120
5 Geometric Trading
Figure 5.10 shows an example of a stealth triangle. First, the most recent pairs of
pivot highs and pivot lows are located based on a minimum Strength within a
range specified by Length. Then, an imaginary trend line is projected across each
pair of pivots to the current bar. If the high of the current bar is less than the
value of the projected trend line for the high pivot pair, then the first condition
for a triangle pattern is satisfied. Similarly, if the low of the current bar is greater
than the value of the projected trend line for the low pivot pair, then the second
condition
is
satisfied.
Finally,
the
slope
of
each
trend
line
must
be
less than
the
maximum specified slope to avoid acute triangles. We scan for obtuse triangles
that resemble shims
2
, as shown in Figure 5.10.
To trade a triangle, we wait for the stealth formation and then enter a trade on a
break of the highest or lowest bar of the nesting triangles. In each of the triangle
examples in Figures 5.11 and 5.12, the slope of the moving average is a guide to
trade direction. Trade triangles in the direction of the trend, checking whether
or not the triangle is above or below the moving average.
Like the rectangle, the triangle is a short-term formation for day trading, al-
though it does not have as much reversal value as a rectangle. The triangle is
more biased towards the prevailing trend, giving the trader a chance to enter on
a consolidation pattern.
5.8 Triangle
121
6 Volatility Trading
There are some things
You learn best in calm,
and some in storm.
Willa Cather
Most human beings are conditioned from childhood that if we can buy some-
thing at a cheaper price, then it must be a great deal, and we feel good about the
purchase. Since stocks trade in prices, we take the mental leap and assume that a
cheaper stock is a bargain, expecting those good feelings in return for a higher
stock price. When the stock continues lower, more shares are purchased because
the price is an even better bargain, and the buyer is wondering what these sellers
must be thinking. This "buy the dip" strategy worked well during the bull mar-
ket of the 1990's but fell apart in the early 2000's.
As with any strategy, the efficacy of a system depends on where and when
it is applied, as shown by the bottom-fishing example. The Acme V system is
self-checking because it takes a long position only within the context of what
it defines as bullish conditions. For example, the system requires the stock to
be trading above its 50-day moving average-a simple yet effective filter.
The Acme V System is the most unorthodox system of all. Even with the
moving average filter, it still breaks most of the rules because it is a counter-
trend system for volatile stocks. It is the only Acme system that does not take
short positions because it has a few other tricks under its sleeve, and one of those
tricks is the so-called Tuesday Turnaround effect [16].
The key to the system is the weekend because Saturday and Sunday do
matter. Before the weekend, a given stock or index has established its weekly
low and high. If this stock or index finishes the week near its weekly low, then
this weakness creates weekend anxiety for the buyers. When trading resumes
the following week, the stock will continue its descent, triggering a further
sell-off in the stock. While the panicked investors bail out of the stock, the V
system steps in, absent of any news that is causing the decline. This is where
the
professional
traders
drink
from
the
pool
of
liquidity
and hunt in the
land
of
volatility,
where
the trader
without
a
plan
is
prey.
124
6 Volatility Trading
The V System is a strategy especially suited for options because of the extreme
volatility. Buying a stock in the V Zone is dangerous because there may be no
apparent reason for the decline, especially if it is bucking the market and sector
trend. This strategy works best during general market declines and is tailored to
the sector indices. When a sector signal is generated, find the best-performing
stocks in that sector, and buy a basket of them.
This system does not work well for industrial and financial stocks. Because
of their cyclical nature and tendency to trend, these stocks tend not to have mid-
week reversals. In contrast, the strategy works well for both biotechnology and
technology stocks.
6.1 Linear Regression
The basis for the V system is a statistical method known as linear regression [20].
Linear regression analyzes past data to project future values using least squares
fitting, computing a formula for a line drawn through these data. For a stock
chart, the regression line can reference any bar price in the formula: open, high,
low, or close.
Since we are attempting to pick a bottom, we use the low prices, so the
regression line is drawn through the lows of the data, as shown in Figure 6.1.
The rectangle contains the projection of the previous four lows to Low 5. We
select a regression length of five bars because the V system works on the weekly
6.1 Linear Regression
125
Proceeding to the next bar, we calculate the linear regression for the previous
four bars to project a line towards Low 5, highlighted by the rectangle on the
chart in Figure 6.2. Now, compare the slope of the regression line in Figure 6.1
with the line in Figure 6.2. The former slope is at a steeper downward angle,
while the latter is more horizontal. This is the basis of the V system. As soon as
the slope starts to flatten out, we want to consider a long entry.
Figure 6.2. Linear Regression Line, Point 2
The easiest way to detect the changing slope is to connect the dots for each lin-
ear regression projection. The result is the linear regression curve shown in Figure
6.3. Note how the curve descends and then ticks up at the point where the long
entry is taken.
The astute trader will speculate about how the V system went long when the
slope of the regression curve was down on the previous bar, given that the value
of the curve is not known until the end of the trading day. The answer is that the
linear regression value is projected one bar into the future, giving us a statistical
jump on the other traders (refer to the discussion on real-time trade entry versus
end-of-day entry in Chapter 5). Instead of participating in just a follow-through
day, the trader is able to capitalize on the first day as well.
Unlike the other systems, the V system enters on a stop order above the pre-
vious day's close instead of the high, i.e., when the stock goes green plus the
ATR percentage. In the following section, we discuss the other conditions that
make
the V
system
more
robust.
126
6 Volatility Trading
6.2 Volatility Trading System (Acme V)
Since V bottoms are tricky, the system has strict requirements for entry. The
system takes entries only on Tuesdays or Wednesdays. In the past several years,
Monday has been a relatively bullish day as well [16], so the trader may wish to
change the code to accommodate Mondays. A stock that has not reversed by
late Wednesday or Thursday will tend to close on the low of the week
The second condition is that the stock must be above its 50-day moving av-
erage. We are trying to simulate bullish conditions and to filter out all stocks
and indices trading below their 50-day moving average. During the prolonged
bull market, we did not need this filter but learned quickly once the market
turned down in the spring of 2000.
The third condition is that the low of the current bar is greater than the pro-
jected low of the regression curve. When a stock is falling sharply, it tends to
outpace the regression curve, i.e., the lows are below the curve. As soon as the
projected low is above the curve, then this condition is satisfied.
The other entry conditions are that the high of the current bar must be the
lowest high of the regression range, the current bar's range must be less than a
given percentage of the ATR, and the high of the current bar must be greater
than yesterday's low (no gap down).
6.2 Volatility Trading System (Acme V)
127
6.2.2 Short Signal
The V System does not have a corresponding short entry. The design of this
strategy is "an exercise left to the reader." Our recommendation is that the short
entry be symmetric to the long entry. Use the linear regression of the high and a
stock below its 50-day moving average.
The EasyLanguage code for the Acme V System is shown in Example 6.1.
Since
the
stop
order
is
being
triggered
above
the
close,
and not above the
high
as
in the other systems, the ExitFactor may be set higher.
128
6 Volatility Trading
6.3 Examples
129
6.3 Examples
The following charts are examples of trades generated by the Acme V System.
Each example uses Equity of $100,000 and the Percent Volatility Model with a
risk of 2%.
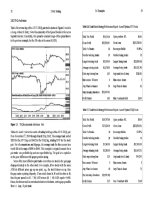
6.3.1 Microsemi Corporation
Figure 6.4 shows an entry right at the 50-day moving average. Note the differ-
ence between entering at the moving average on the same day versus entering
the next day on a breakout above the high - a difference of almost two points.
Figure 6.4. Microsemi Corporation Volatility
Given the performance of the market from early 2000 to early 2002, with the
Nasdaq declining over 60%, we tested the performance of the V system over this
period since it is a long-only system. Over one thousand stocks from various
sectors were back-tested using daily data from the TradeStation historical data-
base. The results are shown in Table 6.1.
The profit factor for the test period is 1.75. Although the winning percent-
age is under 50%, the average winner was nearly twice the amount of the average
loser. The next step is to test the V system near the 50 day moving average to
sec if results are improved by using a support level.
130
6 Volatility Trading
Table 6.1. Acme V System Performance from March 2000 - March 2002
% Winners
Winners
Avg Win
Losers
Avg Loss
Profit Factor
47.2%
1491
$2,609.83
1669
-$1,333.79
1.75
Table 6.2 shows the results of confining entries to prices within half the ATR of
the 50-day moving average. The profit factor decreased from 1.75 to 1.20, with
a winning percentage of only 39%. Now, confess that you expected the profit
factor to be higher because of support at the moving average. Intuitively, such a
conclusion is logical, but in trading one learns quickly that the logical choice is
not the best choice.
Let's explore the reasons for the disparity in results. Return to the beginning
of the chapter and read the first page. Assume the trader has a choice between a
V signal that is five points above the moving average and another signal that is
one point above the moving average. Considering the number of points above
the moving average, describe the key factors that differentiate these two trades.
Clearly, there are two distinguishing factors, and they are both psychological. In
the trader's mind, the second trade is both "cheaper" (comfort factor #1) and
also conformist (comfort factor #2 because the literature tells the trader to buy
when a stock approaches the 50-day moving average). The reality is that a stock
that has been trading above a key moving average and then proceeds to test that
average will strike fear among the long holders and inspire short entries as well.
Our modus operandi is: Support is meant to be broken.
Table 6.2. Acme V System Performance near 50-day MA from March 2000 - March 2002
% Winners
Winners
Avg Win
Losers
Avg Loss
Profit Factor
39.2%
131
$2,463.57
203
$1,322.13
1.20
6.3 Examples
131
6.3.2 Veritas Software
The V system enters near the low of the day, as shown in Figure 6.5. This is the
only way to put the odds in your favor when a stock is in a downtrend. Entering
on a high stop gives too much of the profit away. In general, the V system is an
excellent system for intraday range trading. The trader can enter when the stock
goes green and either close the position at the end of the day with a profit or get
stopped out close to the low.
6.3.3 webMethods
Figure 6.6 shows two examples of V entries well above the fifty-day moving av-
erage. The advantage of the V system over traditional ADX/DMI combination
systems is that the ADX and DMI can filter out trades even if a stock is trading
above its moving average. Further, the DMI is deceptive because when a stock is
in a long, shallow downtrend, the DMI ratio will flip from positive to negative,
even though the long-term trend is up.
Do not eliminate stocks priced below $20 per share. Both of the entries in
Figure 6.6 occurred in the $15-$16 range, and at the time, webMethods had an
ATR of ~1.3. Most of the industrial and cyclical stocks trade at much higher
prices
with
lower
ATRs.
We
remind
you to
drink
from
the
fountain
of
liquidity.
132
6 Volatility Trading
Figure 6.6. webMethods Volatility
6.3.4 SeaChange
The second Acme V entry in Figure 6.7 is a losing trade that followed a choppy
downtrend. Entries after inside days are slightly more difficult but risk-limited.
6.3 Examples
133
6.3.5 Biotechnology Index
Run the V system on all of the indices to get a sense of where the sectors are
trading. For the entry in Figure 6.8, we buy either the Biotechnology HOLDR
(BBH:Amex) or a basket of biotechnology stocks in the Nasdaq 100 such as
Amgen (AMGN:Nasdaq), Biogen (BGEN:Nasdaq), and Protein Design Labs
(PDLI:Nasdaq). The advantage of using the sector indices to trigger trades is
that they trend smoother than individual stocks, and the average holding period
is longer. The disadvantage of trading a basket of stocks is that it is a difficult
combination of maintaining multiple positions and picking stocks that may not
trade synchronously with the index. Instead, we prefer high-cap stocks that are
components of the BBH.
6.3.6 Computer Associates
The chart in Figure 6.9 shows a V entry in Computer Associates (CA:NYSE).
The problem with this entry is the gap down that occurred two days earlier. Our
reaction to this chart is that the V system code should be changed to look for
down gaps over the entire linear regression range. If there are any gaps over the
range, then the trade is nullified.
Ultimately, the trader's goal is to eliminate mistakes, which means not tak-
ing trades such as the one in Figure 6.9. What may seem as minor observations
134
6 Volatility Trading
directly affect the bottom line, and so these observations will become ingrained
with practice and experience.
7 Range Trading
A speculator is a man
Who observes the future,
and acts before it occurs.
Bernard Baruch
In his
book
The
Science
of
Hitting,
Ted
Williams
describes
how he
calculated
that the strike zone was approximately seven balls wide and eleven balls high.
The result was a matrix of baseballs, and he calculated his batting average for
each ball in the matrix
1
. While the ordinary batter decided between ball and
strike, Williams refined the strike into seventy-seven separate categories [37].
Williams also determined that once a batter started swinging at pitches just
several inches outside of the strike zone, the strike zone expanded from 4.2
square feet to 5.8 square feet, an increase of almost 37 percent. Once a pitcher
learned a batter would swing at bad pitches, then that's all the batter would get,
and the batter was destined to be a .250 hitter.
Now, imagine if the "Splendid Splinter" applied his analysis to the stock
market and turned his attention to the range. He would sort all of the ranges
into their various sizes and then determine his batting average, or profit factor,
for each range. He would conclude that when the range is narrow (in the strike
zone), his profit factor is higher. In contrast, when the range is wide (out of the
strike zone), his profit factor is lower.
The average trader analyzes a trade as either a winner or a loser-a ball or a
strike. The professional trader analyzes a trade from its risk/reward ratio [13]. If
the trader uses range to determine stops, then the risk numerator is the range it-
self (the higher the range, the higher the risk), and the reward denominator is
the profit target. For example, if a long entry is triggered at the high of the bar,
and the range is 1.5 times the ATR, then the trader is probably swinging out of
the strike zone.
136
7 Range Trading
7.2 Range Patterns
137
7.1 Range Ratio
The Acme N System is based on a simple concept called the Range Ratio. We
want a ratio value less than one because a day with a low Range Ratio (RR) is
generally followed by a wide range (WR) day under volatile market conditions.
To calculate the RR, divide the current day's range by the Average True Range
(ATR) over a certain reference range to estimate today's volatility. For example,
if the ATR of Juniper Networks for the past seven days is 2.5, and today's range
is 2.0, then the Range Ratio is 2.0 / 2.5, or 0.8.
The Range Ratio has two inputs: Length1 and Length2. The default values
are one and seven, referred to as RR 1:7. The first range does not have to be the
range of just the current bar; it can span a number of bars, so one can experiment
with other ratio values such as 2:10 or 3:12. The Acme N system uses a default
threshold of 0.7; once the RR falls below this value, the system trades a breakout
in the direction of the trend.
The Range Ratio indicator is a separate plot that tracks the ratio of the ATR
of one range of bars to the ATR of another range of bars. When the ratio is less
than a certain percentage, the chart is in consolidation and is poised to break
out. When the ratio is greater than a certain percentage, then the next bar will
probably be a narrow range (NR) bar. In Figure 7.1, each time the ratio is less
than 0.7 or 70%, the next day is a wide range day.
7.2 Range Patterns
The Acme N system integrates the Range Ratio with other narrow range pat-
terns developed by Cooper and Crabel [4, 6]. Further, we have developed other
variations, such as two NR
5
days in a row and an NR% bar. All of these other
NR patterns are part of the Acme Range Patterns, as shown in Table 7.1.
Table 7.1. Range Patterns
Description
Two Consecutive Inside Days
Inside Day with the Narrowest Range of the last n bars
Two Consecutive Narrowest Range bars over n bars
Narrowest Range of the last n bars
Range is x% of the Average True Range
7.2.1 Inside Day 2 (ID2)
The Inside Day 2 pattern (ID2) is two consecutive Inside Days (ID)
2
, as shown
in Figure 7.2. It is the same as Cooper's Boomer pattern [4].
138
7 Range Trading
7.2 Range Patterns
139
7.2.2 Inside Day-Narrow Range 4 (IDNR
4
)
The Inside Day-Narrow Range 4 pattern (IDNR
4
) is an inside day with the
narrowest range of the past four days [3], as shown in Figure 7.3.
Figure 7.3. IDNR
4
Example
7.2.3 Narrow Range 2 (NR2)
The Narrow Range 2 pattern (NR2) is two consecutive NR bars over a given
range. Figure 7.4 shows a chart with two consecutive NR
5
days (NR2
5
).
7.2.4 Narrow Range 10 (NR
10
)
The Narrow Range 10 pattern (NR
10
) is the narrowest range of the last ten days,
as shown in Figure 7.5.
Figure 7.5. NR
10
Example
7.2.5 Narrow Range % (NR%)
The Narrow Range % pattern (NR%) is based upon a percentage of the ATR.
Dunnigan defines an NR in the context of an Upswing or Downswing, where
an NR bar is any bar with a range less than half of the widest range bar in the
swing [9]. Four examples of an NR%
50
bar are shown in Figure 7.6.
Figure 7.4. NR2
5
Example
140
7 Range Trading
7.3 Range Trading System (Acme N)
141
7.3 Range Trading System (Acme N)
With all of the patterns defined, we can now implement a range trading system
known as the Acme N System. The Acme N System is based on a combination
of Cooper's short-term swing techniques [4]; Crabel's narrow range patterns [6]
and the Acme Range Ratio. The N system is a traditional momentum system
because it uses the ADX and pullbacks - the difference is that trades are entered
only on breaks of NR bars.
The Acme N system requires one of the following five criteria to establish
the existence of a "Narrow Range Condition":
1. Two consecutive NR bars (NR2 pattern), or
2. Two consecutive ID bars (ID2 pattern), or
3. Narrowest range of the last n bars (NR pattern), or
4. Inside day and narrow range bar (IDNR pattern), or
5. The Range Ratio (RR) is less than a certain percentage.
Once a low-volatility condition has been established, the range of the current
bar must be less than a certain percentage of the ATR, i.e., it is an NR% bar of
70% or less (this is the RangePercent parameter).
The trader should choose the option of using traditional technical filters for
a momentum system. Historical testing has shown that the higher each of these
values is set, the better the performance of the system. The N system uses the
following filters:
- Minimum Price
- Minimum ADX
- Minimum HV
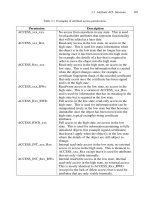
We now define the rules of the system, including the filters. First, we enumerate
the narrow range conditions.
Narrow Range Condition
1. Is the current bar an NR
5
bar and the previous bar an NR
5
bar?
2. Is the current bar an ID bar and the previous bar an ID bar?
3. Is the current bar an NR
10
bar?
4. Is the current bar an ID bar and an NR
4
bar?
5. Calculate the Range Ratio (RR) tor the current bar divided by the
range of the last 7 bars (RR 1:7). Is the RR 1:7 less than 0.7?
If any of the above range conditions are true, then the Narrow Range Condition
is satisfied. Finally, the Range Percentage is applied to the bar to qualify it as a
potential Acme N trade entry.
7.3.1 Long Signal
Calculations
1. Calculate the ATR for the past 20 bars (ATR
20
).
2. Multiply the Range Percentage (RP) of the current bar by ATR
20
.
3. Calculate the ADX for the filter length (ADX
14
).
4. Calculate the 50-bar moving average (MA
50
).
5. Calculate the historic volatility for the filter length (HV
14
).
Entry Rules
1. Narrow Range Condition = True
2. Range <=RP*ATR
20
3. Close > 20
4. ADX
14
>=18
5. HV
14
>=0.5
6. Retracement Bars >= 2
7. Median Price > MA
50
8. Buy the next bar at or above the High + (EntryFactor * ATR
20
)
Exit Rules: Profit Target
1. Sell half of the position at or above the High + (ProfitFactor * ATR
20
)
2. Sell half of the position at or above the High of ProfitBars ago +
(2 * ProfitFactor * ATR
20
)
Exit Rules: Stop Loss
1. Sell all shares at or below the Lowest Low for StopBars
(ExitFactor * ATR
20
)
142
7 Range Trading
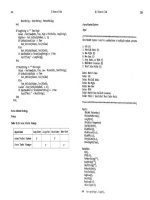
7.3.2 Short Signal
Calculations
1. Calculate the ATR for the past 20 bars (ATR
20
).
2. Multiply the Range Percentage (RP) of the current bar by ATR
20
.
3. Calculate the ADX for the filter length (ADX
14
).
4. Calculate the 50-bar moving average (MA
50
).
5. Calculate the historic volatility for the filter length (HV
14
).
Entry Rules
Exit Rules: Profit Target
1. Cover half of the position at or below the Low -
(ProfitFactor * ATR
20
)
2. Cover half of the position at or below the Low of ProfitBars ago
(2 * ProfitFactor * ATR
20
)
Exit Rules: Stop Loss
7.3 Range Trading System (Acme N)
143
144
7 Range Trading
After performing some price calculations at the beginning of the code, the N
system calls all of the Acme functions for determining narrow range conditions.
The AcmeNarrowRange function is designed to locate any narrow range bar us-
ing the Index. For example, it can determine whether the current bar is an NR
bar for the last ten bars, or whether the bar seven days ago was an NR bar.
With the catalog of Acme trading patterns defined, the trader can see how
much computing power is required for each bar. The TradeStation indicators
(lines and letters) are provided so the trader can recognize all possible patterns
that are encoded within a single bar. Multiply this horsepower by the number of
stocks, and one recalls the chained captives in Ben-Hur
3
straining their oars at
ramming speed.
7.4 Examples
145
7.4 Examples
The following charts are examples of trades generated by the Acme N System.
Each example uses Equity of $100,000 and the Percent Volatility Model with a
risk of 2%. For stocks, trade filtering is turned on. For indices, trade filtering is
turned off because of their lower ADX readings.
7.4.1 Nasdaq Composite Index
This chart shows the Nasdaq Composite Index with the Range Ratio falling be-
low 0.7 four times (circled in Figure 7.7). The chart shows two long entries and
two short entries in a relatively choppy market. The DMI would have elimi-
nated most of these trades. The problem is that the DMI is typically based on a
14-bar study period. By the time it catches up to the trend, the trend has already
changed. A volatile stock or market index is characterized by several sudden
trend changes within much shorter periods.
Figure 7.7. Nasdaq Composite Index
The Acme N System simply enters trades on consolidation days or retracement
days. Many traders wait for pullbacks, but the chart in Figure 7.7 illustrates how
A trade can be entered even in the midst of a swing.
Table 7.2 shows the unfiltered Acme N system performance report for the
Nasdaq
Composite
Index
from mid 1994 to early 2002.
When
the
filters
are