Professional Stock Trading System Design and Automation phần 8 ppsx
Bạn đang xem bản rút gọn của tài liệu. Xem và tải ngay bản đầy đủ của tài liệu tại đây (1.06 MB, 16 trang )
210
10 Day Trading
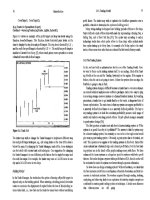
Figure 10.12. Panera Bread Gap Continuation
News
When a company reports earnings after the bell, the perception of its earnings is
altered by the tone of the market during the day. If a company reports good
earnings but the market was down on the day, then people will tend to find a
troubling element in the earnings report that sends the stock down after the bell.
The odds are in favor of the stock trading even lower the following morning, but
its opening price is subject to the opinion of analysts who will issue upgrades or
downgrades. Analysts being only human, their comments echo the sentiment of
the market, and everyone piles on
2
.
Table 10.3. News Continuation Strategy
Market Tone
Bullish
Bearish
Neutral
Earnings
Positive
Positive
Positive
Morning Gap
Strong Up
Up
Up
Earnings
Negative
Negative
Negative
Morning Gap
Down
Strong Down
Down
10.3 Day Trading Techniques
211
Table 10.3 shows the impact of market tone upon a company's earnings report.
The issue is how the trader uses this information to establish a position. When a
company reports its earnings, unless the stock is halted for news pending, the
price develops in two stages. First, the stock reacts to the earnings number. The
company beats, meets, or misses its number
3
, and within minutes the stock finds
its new price level. Then, the waiting game begins for the company conference
call, a game of corporate spin. Unless the company mentions forward guidance
in its earnings report, people will be eagerly awaiting that guidance during the
call. When the guidance is released, the stock finds its second price level (refer
to Section 10.4.5 on trading after the bell).
Because the actions of analysts can be unpredictable, the news continuation
strategy should be traded only when the market tone and earnings tone match.
If the market tone is bullish and earnings guidance is positive, then the stock
should be bought after-hours. In contrast, if the market tone is bearish and
earnings guidance is negative, then the stock should be shorted after-hours.
Bear in mind that the stock price has absorbed most of the news already, so the
difference in price between the after-hours close and next morning's open will
not be nearly as large as the gap between the regular market close and the open.
The trader is simply trying to wring out an extra point or two because the
emotional market participants will be eager to bail out or bolster their position
early on the following morning, and there will be added pressure on the stock in
the direction of the after-hours move. Even in instances where the market tone
is neutral, a bullish earnings report will generally get a slight bump up from the
after-hours close the next day.
The same principle applies to other news released after hours, such as a new
contract announcement or an SEC investigation. On November 28
th
, 2001, at
4:15 pm, the United States government announced a $428 million contract for
a smallpox vaccine to Acambis (ACAM:Nasdaq). The stock closed near 38 and
traded up to the low 40's after-hours. Watching the stock rise over three points
within minutes, we decided not to take the trade.
The following day, Acambis opened above 48—it had traded as high as 50
before the open. At the time, if we had known the float of the stock were less
than 8 million shares, then the trade would have been more appealing. Clearly,
the magnitude of the gap is directly related to the significance of the news and
the capitalization of the stock. The enterprising trader should be able to develop
general trading guidelines by studying the interaction between news and stock
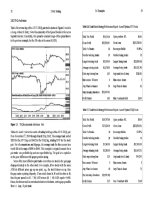
float. Figure 10.13 shows the intraday chart of Acambis preceding the contract
announcement. Notice the subtle signs of accumulation beginning on the after-
noon of November 27 and the expanding session width of the 5-minute chart.
212
10 Day Trading
Figure 10.13. Acambis News Continuation
The breakout continuation is a two-day pattern. On Day One, the stock must
consolidate the entire day until later in the afternoon. Then, one or two hours
before the closing bell, the stock trends strongly in either direction. This is an
example of a pent-up move that will probably continue on Day Two, unlike a
stock that trends all day on Day One and continues into Day Two. The strategy
is a simple application of the alternation principle that a trending day follows a
non-trending day, but the key is to recognize the beginning of the trend phase
late in the afternoon of a predominantly flat day.
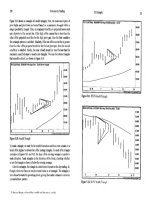
The breakout continuation is a pattern for real-time scanning programs
such as FirstAlert. The breakout follows the pattern principle of a rectangle,
where the rectangle height of the breakout period is compared to a smaller
range height for a longer time frame preceding the rectangle. In this case, we
divide the trading day into half-hour intervals, so the trading day has a total of
thirteen intervals. Since we scan for a breakout during the last two hours of the
trading day, we want to calculate the ratio of the range height of the last four
thirty-minute intervals divided by the range height of the previous nine thirty-
minute intervals, e.g., a ratio of 2:1 or 3:1. Further, the height of the reference
range
must
be
narrow,
as
little
as
10%-20%
of the
stock's
ATR.
Figure
10.14
shows a breakout continuation for Rambus (RMBS:Nasdaq).
10.3 Day Trading Techniques
213
Figure 10.14. Rambus Breakout Continuation
10.3.3 Block Trading
Previously, we presented some examples of how block trade analysis can detect
unusual activity in a stock. Before we explore the mechanics of this technique
further, let's compare the average block trade with the average trade size for the
Nasdaq stock market. As shown in Table 10.4, the average block size is over
twenty thousand shares, but remember that a trade qualifies as a block only in
the context of a stock's average daily volume (ADV).
For example, if the ADV of one stock is 100,000 shares, then a trade of 5000
shares could be considered a block trade. For a stock with an ADV of one mil-
lion shares, then trades of 25K and 50K would be considered block trades. For
stocks such as Cisco Systems with an ADV of millions of shares, blocks become
more difficult to interpret.
214
10 Day Trading
One accepted truism of day trading is that large blocks signal a trend reversal.
This concept has appeal because a large block to be sold will temporarily force
down the price. A trader who is alerted to a large block on the tape may be able
to ride the momentum back up; however, this type of trade has two problems.
First, by the time the "print" occurs in Time & Sales, the stock may have already
reversed because Nasdaq members have up to ninety seconds after execution to
report transactions; thus, the print can be delayed. Second, the trader has no
idea whether or not another large block is coming down the pipe.
Without any insight as to order flow, fading a block trade may not be worth
the risk. Only the participant with access to order flow can buy or sell ahead. A
trader of NYSE stocks subscribing to the OpenBook service (released January
24
th
, 2002) can view the specialist's limit order book from 7:30 am to 4:30 pm.
Here, the trader can develop a sense of the technical levels that maybe breached
and anticipate any movement towards those areas.
The key to block trading is to measure the frequency of certain block sizes
across the spectrum of market capitalization. If a large block needs to be bought
or sold for a small-cap stock, then the probability is greater that the block is a
one-off, and the trader may be able to participate in a reversal. We recommend
that the trader set up a group of separate tickers, segregated by ADV to display
only those trades that meet the minimum block size. Table 10.5 shows sample
block sizes sorted by ADV.
Table 10.5. Volume-Based Block Size
ADV Range
50,000 - 200,000
200,000 - 500,000
500,000 - 1,000,000
1,000,000 - 2,000,000
2,000,000 - 10,000,000
Block Size
2,000
5,000
7,000
10,000
25,000
We caution the trader not to place too much emphasis on a single block trade.
People seem to get excited about seeing a large print above the offer if they are
long or a large print below the bid if they are short. The isolated print serves
only as a psychological boost to the nervous trader, who should probably not be
in that position if he or she is dwelling on every tick and consulting the oracle of
the Yahoo board. More importantly, examine a string of block trades to see how
many were executed on downticks and how many on up ticks. The trailer is
simply trying to assess trend and possibly impending news. When a low cap
stock suddenly shows up on the ticker, then that is a sign to get involved.
10.3 Day Trading Techniques
215
10.3.4 Spread Trading
When spreads were wider in the fractional days, spread trading was an activity
best reserved for the market maker. Still, a trader could "play market maker" in a
liquid stock by simultaneously placing a buy order at the best bid price and a sell
order at the best offer price using an ECN such as the Island. For example, if a
stock were trading at 40 ¼ x 41, then a trader could bid the stock at 40 5/16 and
offer
it at 40
15/16-there
may
have been
a
seller
and
buyer
who
were willing
to
take advantage of the better prices given by the spread trader.
Unfortunately, for stocks with wide spreads, the trader with no knowledge
of order flow is a sitting duck. If a trader's bid is hit, then it probably happened
for one reason-the stock is going down, and the trader still has an offer to sell
his or her shares. Now, other market participants see that the bid was hit, and
start going low offer. In an attempt to sell the shares, the trader goes low offer as
well, cutting the spread and sowing the seeds of the stock's demise. The trader
will be lucky to get out of the trade without a loss.
Currently, the spreads are as narrow as possible, so unless the practice can be
automated, spread trading is intense and is not the best use of the trader's time.
A large-cap stock such as Cisco trades with a penny spread. To make money on
the spread, the commission costs must be factored into both sides of the spread
trade. For example, if the commission is $10, then the total cost of the trade is
$20, one trade for the bid and one trade for the offer. At least 2100 shares must
be spread (2100 X $0.01 = $21 - $20 = $1) to make any profit at all. Even with
a stock such as Cisco, a price jump could move the stock twenty or thirty cents,
and all of a sudden, the trader has risked several hundred dollars to make a buck,
converting a spread trade into a position trade.
Spread trading has been subsumed almost entirely within the domain of the
computer. For the large-cap stocks, many of the ECNs are lined up on either
side of the Level II window with thousands of shares displayed on the screen.
Traders that used to watch the volatility on the Level II screen are now forced to
watch as automated programs swap hundreds of thousands of shares before any
appreciable price movement. The free-flowing volatility of the past has evolved
into a pattern of tight consolidations alternating with sudden price shocks.
So far, we have covered the following day trading techniques:
- Gap Trading
- Continuation Trading
- Block Trading
- Spread Trading
216
10 Day Trading
10.4 The Trading Day
The stock market is expanding on either end of the day, a natural extension into
round-the-clock trading. Assuming a 24-hour trading day, we divide the day
into five natural segments as shown in Table 10.6.
Table 10.6. Trading Day Segments
Segment
Before the Bell
The Open
Lunch Hour
4
The Close
After the Bell
Time Period
08:00 pm-09:30 am EST
09:30 am - 11:00 am
11:00 am - 02:00 pm
02:00 pm - 04:00 pm
04:00 pm - 08:00 pm
The time period in the first row is not a typographical error. The new trading
day starts just after the close of after-hours trading at 08:00 pm, putting us on
the 24-hour cycle. One may question our designation of the Open and Close
segments with their expanded time frames, but they serve to delineate the time
periods when trades are entered. New trading positions between 11:00 am and
02:00 pm are rare.
10.4.1 Before the Bell
The period before the bell is divided into two phases:
a Research phase (08:00 pm - 08:00 am)
a Trading phase (08:00 am - 09:30 am)
The research phase-the process of downloading price data, scanning charts,
and selecting stocks is discussed in Chapter 9. The trader should have all of this
work done before trading begins at 08:00 am, although some traders prefer not
to trade either before or after the bell, in which case the trader can hit the snooze
button. Use the time before the opening bell to set up charts, enter alerts, and
scan for gaps. The trader may also have other research services and publications
to review beforehand. Finally, any remaining time can be spent laughing at the
guys on Squawk Box
5
.
10.4 The Trading Day
217
Fair Value
It is a daily morning ritual for some traders-the business section, coffee, and the
futures check. One of the first things to do is flip on the television and get the
latest S&P futures quote displayed in the lower-right hand corner of the screen.
This quote, also known as the S&P bug, shows the positive or negative change
from yesterday's S&P 500 futures contract close.
The purpose of watching the S&P futures in the morning is to assess the
general direction of stocks because futures are a leading indicator of stock prices.
Unless the futures are very strong (e.g., greater than +5.00 or less than -5.00),
then the market open will be difficult to predict. As a trader eventually learns, a
positive futures change does not imply a strong opening, and a negative futures
change does not imply a weak opening. This price discrepancy is explained by
the trading concept known as fair value.
Fair value
6
is an estimate of what an S&P 500 futures contract is worth; it is
a formula that factors in borrowing costs and dividends. Fair value is computed
at the end of each trading day to compare with the actual futures price. Before
the market opens, the S&P futures serve as a market proxy, digesting any news
to trade above or below fair value. For example, a bullish economic release at
8:30 am will send the futures soaring beyond their fair value. The key point is to
know where futures are trading relative to fair value. Some business channels
such as CNBC display this value before the opening bell.
Market commentators always give their perception of a strong open or weak
open for the market. For now, hit the mute button to make your own determi-
nation. First, calculate the net change for the S&P futures from yesterday's
close. This value is displayed with a "+" or "-" point value on the television
screen. For example, if the S&P futures are +2.50, then the futures are trading
two and a half points higher in the morning trading session. Then, get the fair
value displayed on the screen; this value is also displayed as a "+" or "-" point
value. For example, if fair value is "-6.00", then futures closed six points above
fair value yesterday. If the fair value is "+6.00", then the futures closed six points
below fair value yesterday.
Now, compare the current S&P futures quote against fair value to determine
how the market is going to open this morning. Simply subtract the fair value
number (F) from the S&P futures quote (S). A positive number indicates a bias
to the upside; a negative number indicates a downside bias; and zero means that
the market will open flat. Some sample combinations of fair value and futures
are shown in Table 10.7.
218
10 Day Trading
Table 10.7. Fair Value
S&P Futures (S)
+5.00
+2.00
-2.00
-6.00
-2.50
+4.50
Fair Value (F)
+1.00
+6.00
-4.00
+7.00
-2.50
-3.50
(S)-(F)
+4.00
-4.00
+2.00
-13.00
0.00
+8.00
Market Opening
Up
Down
Up
Down
Neutral
Up
Most of the time, the fair value is a small number, and the S&P futures quote by
itself is an indication of how the market will open. Do not make this assump-
tion, however-always check the fair value delta (S) - (F). Still, the S&P futures
close at 09:15 am, and stocks continue to trade during the fifteen minutes before
the market opens, so even this figure can be misleading.
Once we have made an assessment of the general market, we turn to the
subject of individual stock picking. If the market bias is up, then we focus on our
long selections. If the market bias is down, then we focus on the shorts. With
our stock selections in place from last night's analysis, we want to review each of
these stocks for any news before the opening bell.
Case Study: Ciena
Companies are revising their earnings guidance on an increasingly regular basis,
with an attendant rise in the number of conference calls being held before and
after market hours. Depending on the severity of the news, the stock may or
may not be halted. Companies with bad news are more likely to be halted than
companies with good news, so companies with good news create more opportu-
nity for traders.
The problem with trading halts is that news does not go through the normal
dissemination process, so when a stock reopens for trading, it will gap and find
its equilibrium almost immediately, similar to a specialist delaying the opening
of a stock until the imbalance can be resolved (unless the stock is halted, there
may be some liquidity on the ECNs for an NYSE stock).
One company, Ciena (CIEN:Nasdaq), has held several morning conference
calls, creating opportunity for the early bird trader. On November 12, 2001,
Ciena held a conference call before the bell to update its guidance. The positive
news
sent
Ciena
in from a
price
of 1
7.18
to
well
over
18 at the
open,
as
shown
in
10.4 The Trading Day
219
Figure 10.15. Trading was never halted in the stock, so a trader listening to the
conference call could have gotten in immediately.
Figure 10.15. Ciena: November 12, 2001
Ciena's conference call that was held on February 5
th
, 2002, was a warning. The
stock was halted for almost one hour. Note the opening counter-move from the
gap down in Figure 10.16.
220
10 Day Trading
Another source of critical data before the bell are the government's economic
reports released at 08:30 am, such as the following:
a Non-Farm Payrolls
a Gross Domestic Product (GDP)
a Factory Orders
a Consumer Price Index (CPI)
a Producer Price Index (PPI)
On the dates of these key government reports, either avoid trading before 08:30
am or wait until after the report is released. Further, do not trade off these data
except for a fade-the reaction to these numbers is usually unpredictable and
characterized by zigzags. The whole point of professional trading is to eliminate
as much uncertainty as possible, not to place one's capital on black or red.
10.4.2 The Open
The worst time for an investor to buy stock is at the open (once the investing
public catches on, this will change because conventional wisdom translates into
lighter wallets). Conversely, the open is usually the best time for the trader to
sell a long position and initiate a short position
7
. In his Stock Traders Almanac,
Hirsch plots the performance of the market by percentage each half-hour of the
day [16]. For the period between January 1987 and December 2000, the market
rose 52.8% of the time on the open.
The market rarely sprints from the open because even in the case of excep-
tionally good or bad news, the market needs time to digest the offsetting orders
just after the opening bell. Thus, the market will spend from fifteen minutes to
one hour settling into a range before committing to a certain direction
8
. At this
point, either the long signals or short signals for the swing trades are going to
start firing, giving an indication as to the direction of the market. As the open
develops, the trader builds up his or her portfolio of positions and lets price do
the rest. When the market is split, both long and short signals will trigger. This
is the optimal scenario.
The cutoff for new signals is 11:00 am. Even 11:00 am is a little late to take
signals because the major trend decision of the market will almost always be
made within the first hour of the trading day.
10.4 The Trading Day
221
10.4.3 Lunch Hour
For obvious reasons, the trader should focus on the open and close, while avoid-
ing lunch hour. Market makers like to eat day traders for lunch. Still, companies
have been known to slip in news announcements with traders on siesta, creating
a scramble (refer to the Tyco example in Chapter 9).
By definition, the lunch hour is a time for consolidation, so many rectangles
and triangles set up during this period. Scan for stocks and sectors that trended
strongly in the morning and that are poised to continue in the afternoon (e.g.,
percentage gainers or losers). Use the rectangle
9
to predict market direction for
the afternoon.
During lunch, the worst action a trader can take is to buy a stock that is up
on the day in anticipation that it will resume its upward move in the afternoon
(see the Rambus example in Chapter 5). Wait for a confirmation before taking
any long trades because the 01:30 and 02:00 pm half-hour periods are the worst
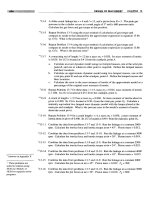
performing market intervals [16].
10.4.4 The Close
In general, the intraday trend is persistent, i.e., the morning trend will usually
resume in the afternoon. Intraday V patterns are rare except for certain days of
the week (Chapter 6). Beginning at 02:00 pm, the trader should be looking for
reversal patterns to assess whether or not the morning trend will resume. If a
rectangle forms, then the breakout of the rectangle will dictate whether or not
the position should be covered or maintained.
To exit long positions or initiate new short positions, look for "M" tops. To
exit short positions and enter long positions, look for "W" bottoms. Combine
these patterns with Bollinger Bands to maximize trading profits near highs and
lows of the day [1]. The circled areas in Figures 10.17 and 10.18 show examples
of M top and W bottom patterns, respectively.
The reversal pattern is a great tool because it serves two functions. First, it
protects the trader from giving back the bulk of any profits attained during the
day. Second, it frees the trader's capital for other strategies that trigger towards
the end of the day. Furthermore, the reversal pattern is the only other decision
point for determining whether or not to stay in a position until the rest of the
day (in addition to the profit target and stop loss).
Do not be anxious to cover short positions for rallies that occur early in the
close period.
Rallies
around
02:00
pm
tend
to
fizzle,
while
rallies
starting
closer
222
10 Day Trading
to 03:00 pm are more successful (47.9% versus 53.7%). Exaggerated moves oc-
cur in the last fifteen minutes of the trading day.
10.4 The Trading Day
223
10.4.5 After the BelI
Welcome to the money pit. Trading stocks after the bell is the Tombstone of
trading
10
. It is a game of firepower, so traders with small accounts are advised to
holster their mouse. As with any trading rule, however, there are exceptions.
Here, we discuss two strategies where the odds are tilted in the trader's favor.
Both are news-driven strategies and should be used in exceptional cases.
Earnings
Previously, we discussed the impact of market tone upon a company's earnings
report and explained the News Continuation strategy. Most earnings reports are
released shortly after 4:00 pm, with a conference call beginning around 5:00 pm.
The most important advice we can give about earnings is to keep your finger on
the trigger and an ear to the conference call. Do not trade the stock blindly with
a Level II window unless you know exactly what is happening during the con-
ference call, unless trading is your substitute for craps.
A trader with direct access usually can jump on a stock as soon as forward
guidance is announced. By the time others have touched the keypad on their
mobile phones, one can quickly establish a small position in a stock, albeit with
some degree of slippage; however, as with any other trading position, there are
no guarantees. This strategy is designed for the trader with direct access, quick
fingers, and hot keys.
News
Every major newspaper has an online evening edition that includes stories to be
released in the print edition the following day. Typically, these stories appear in
the online edition after 6 pm, so a trader aware of an important story about a
public company may be able to capitalize on this news after the bell.
The effect is especially dramatic when a small-cap company is profiled in a
technology or science section of newspapers such as the Wall Street Journal, the
New York Times, and Investor's Business Daily. On October 8
th
, 2001, the eve-
ning edition of the New York Times profiled a small biotechnology company
named Cepheid (CPHD:Nasdaq) in the midst of the anthrax crisis. The stock
had closed at 4.40, but quickly climbed above five in the evening as news of the
Times story spread. The following morning, the stock gapped up to 6.70, over
50% from the close (Figure 10.19).
224
10 Day Trading
11 Source Code
The bitter and the sweet
Come from the outside,
The hard from within,
from
one's
own
efforts.
Albert Einstein, Out of My Later Years
The history of trading is a pyramid of knowledge that has been constructed over
the past century. From Livermore to Gann to Edwards and Magee, only time
will tell which of the modern-day technicians will be mentioned in the same
breath. The important point to remember is that trading is a collective effort in
the sense that one draws inspiration from many sources. This book is a synthesis
of many who have contributed to the body of work in technical analysis.
The evolution of trading software has been a catalyst for developing new
prototypes of technical analysis in a short period of time, especially with the de-
velopment of programming languages designed specifically for trading.
All of the source code here is written in EasyLanguage, a language for tech-
nical analysis and trade management. The code was originally written for the
TradeStation 2000i platform, but can be imported into TradeStation 6. Note
the difference in signal names in Table 11.1 between the TradeStation 2000i
platform and the TradeStation 6 platform:
Table 11.1. TradeStation Signal Names
Signal
Long Entry
Short Entry
Long Exit
Short
Exit
TradeStation 2000i
Buy
Sell
ExitLong
ExitShort
TradeStation 6
Buy
Sell Short
Sell
Buy To Cover
226
11 Source Code
11.1 Inventory
All of the EasyLanguage code is grouped by function and roughly by chapter.
Start with the Money Management code because it is the foundation for the
rest of the code. Then, choose the system(s) to build. After the files have been
created, verify the entire Acme code base, selecting the appropriate signal names
in Table 11.1 based on the platform.
If using the TradeStation 2000i and TradeStation 6 platforms, create the
source code using the PowerEditor, verify the source, and then export all of the
code with the Acme prefix to an ELS archive file. Finally, import the archive
into TradeStation 6 for automatic conversion.
I
11.1 Inventory
227
The EasyLanguage code in this chapter is based on TradeStation 2000i. If
using TradeStation 6, the signal names Sell, ExitLong, and ExitShort must
be replaced with the signals SellShort, Sell, and BuyToCover, respectively.
11.1.1 Web Site
A professional CD-ROM product containing the source code in this book can
be purchased in EasyLanguage archive file format from the Acme Trader Web
site at . The product can simply be installed into
TradeStation, and the trader can then open pre-defined workspaces provided
on the CD-ROM.
11.1.2 Money Management
Table 11.2. Money Management Modules
Name
Acme HV
Acme Trade Manager
AcmeEntryTargets
AcmeExitTargets
AcmeGetShares
AcmeLogTrades
AcnieVolatility
Type
Indicator
Signal
Function
Function
Function
Function
Function
Description
Display the historic volatility of an instrument
Set stops and profit targets
Plot the entry points for stop and limit orders
Plot the stop loss points and profit targets
Calculate the shares based on the risk model
Log trades to a file for spreadsheet import
Calculate the historic volatility
11.1.3 Geometric Trading
Table 11.3. Geometric Trading Modules
Name
Acme Double Bottom
Acme Double Top
Acme R Strategy
Acme R System
Acme Rectangle
Acme Triangle
Acme Triple Bottom
Acme Triple Top
AcmeDoubleBottom
AcmeDoubleTop
AcmeRectangular
AcmeTripleBottom
AcmeTripleTop
Type
Indicator
Indicator
Strategy
Signal
Indicator
Indicator
Indicator
Indicator
Function
Function
Function
Function
Function
Description
Draw a line forming a double bottom
Draw a line forming a double top
R Signal with the Acme Trade Manager
Look for rectangle breakouts
Draw a rectangle
Draw a triangle
Draw a line forming a triple bottom
Draw a line forming a triple top
Find a double bottom formation
Find a double top formation
Is the current region a rectangle?
Find a triple bottom formation
Find a triple top formation
11.1.4 Market Models
Table 11.4. Market Model Modules
Name
Acme All Strategies
Acme Market Model
Acme Market Strategy
Acme Market System
AcmeHighLowIndex
Type
Strategy
Indicator
Strategy
Signal
Function
Description
Combination of F, M, N, R, and V strategies
Label market sentiment patterns
Market Signal with the Acme Trade Manager
Look for multiple market sentiment patterns
Check for an index confirmation
228
11 Source Code
11.1.5 Pair Trading
Table 11.5. Pair Trading Modules
Name
Acme P Strategy
Acme P System
Acme Spread
Type
Strategy
Signal
Indicator
Description
P Signal (does not use Acme Trade Manager)
Pair trading system
Display the spread between two instruments
11.1.6 Range Trading
Table 11.6. Range Trading Modules
Name
Acme ID2
Acme IDNR
Acme N Strategy
Acme N System
Acme NR
Acme NR%
Acme NR2
Acme Range Ratio
AcmeInsideDay2
AcmeInsideDayNR
AcmeNarrowRange
AcmeRangePercent
AcmeRangeRatio
Type
PaintBar
PaintBar
Strategy
Signal
PaintBar
PaintBar
PaintBar
Indicator
Function
Function
Function
Function
Function
Description
Mark an inside day within an inside day
Mark inside day/narrow range combinations
N Signal with the Acme Trade Manager
Range ratio and narrow range pattern system
Mark the narrowest range in n bars
Mark a narrow range bar based on % of ATR
Mark two consecutive narrow range bars
Display the ratio of two bar ranges
Search for two consecutive inside days
Find an inside day/narrow range bar
Is the specified bar a narrow range bar?
Calculate the range percentage over n bars
Calculate the range ratio
11.1 Inventory
229
11.1.7 Pattern Trading
Table 11.7. Pattern Trading Modules
Name
Type Description
Acme M Strategy
Acme M System
Acme Market Patterns
AcmeCobra
AcmeHarami
AcmeHook
AcmeOnAverage
AcmePullback
AcmeRetraceDown
AcmeRetraceUp
AcmeTail
AcmeTest
Strategy M Signal with the Acme Trade Manager
Signal Look for multiple pattern combinations
Indicator Label bar patterns
Function Find a Cobra pattern
Function Search for the extended Harami pattern
Function Search for a Hook pattern
Function Is the current bar sitting on the moving average?
Function Search for a Gann pullback pattern
Function Identify an n-bar pullback
Function Identify an n-bar upward retracement
Function Identify a Tail pattern
Function Identify a Test pattern
11.1.8 Volatility Trading
Table 11.8. Volatility Trading Modules
Name
Acme V High Zone
Acme V Low Zone
Acme V Strategy
Acme V System
AcmeVHigh
AcmeVLow
Type
PaintBar
PaintBar
Strategy
Signal
Function
Function
Description
Mark when the V High Zone is hit
Mark when the V Low Zone is hit
V Signal with the Acme Trade Manager
Find V bottoms bused on linear regression
Find an inverted V high
Find a V low
230
11 Source Code
11.1.9 Float Trading
Table 11.9. Float Trading Modules
Name
Type
Description
Acme F Strategy
Acme F System
Acme Float Box
Acme Float Channel
Acme Float Percent
AcmeFloatChannelHigh
AcmeFloatChannelLow
AcmeGetFloat
AcmeGetFloatBars
Strategy F Signal with the Acme Trade Manager
Signal Float Breakouts and Fullbacks
Indicator Plot parallel lines indicating float turnover
Indicator Plot the high and low float channels
Indicator Plot the float turnovers on base breakouts
Function Return the value of the upper float channel
Function Return the value of the lower float channel
Function Return the float of a given stock
Function Calculate the bar number for a float turnover
11.2 Compilation
11.2.1 Creating an Archive
Once the code has been created and verified in TradeStation, the user should
create an EasyLanguage archive file to store all of the Acme code. Further, if the
trader uses the combination of TradeStation 2000i and TradeStation 6, then
the archive should be created in 2000i and then imported into TradeStation 6
because the old signal names will be automatically converted.
TradeStation 2000i
To create an archive in TradeStation 2000i application, follow these steps:
1. In the EasyLanguage PowerEditor, select:
File->Import and Export
2. Click on:
Export EasyLanguage Storage File (ELS)
3. Click:
Next >
4.
Under
the
Analysis
Type:
dropdown
menu,
select:
All Techniques
11.2 Compilation
231
5. Scroll down until you see the Acme prefix. Highlight:
Acme
All
Strategies
6. Click the > button repeatedly until all of the Acme techniques have
been transferred to the Techniques to Export: pane on the right.
7. Click:
Next >
8. Enter the location and name where the archive file will be created, e.g.,
c:\temp\Acme.els
9. Click:
Finish
10. A Reminder dialog box will appear saying:
Functions used by functions you selected will be automatically
transferred as well.
11. Click:
OK
12. The
transfer
process will begin. Possibly,
a
Confirm
file
replace dialog
box will appear asking if you would like to replace an existing analysis
technique. Click:
No to all
13. A Reminder dialog box will appear saying:
Signals and Functions used by the selected Strategies and Signals
will be automatically transferred as well.
14. Click:
OK
15. A Reminder dialog box will appear saying:
Functions used by Studies you selected will be automatically trans-
ferred as well.
16. Click:
OK
17. An Export Success dialog box will appear saying:
You have successfully exported your analysis techniques
18. Click:
OK
19. The archive file named Acme.els has been created in the directory:
c:\temp\
The archive file can now be distributed and imported into both TradeStation
2000i and TradeStation 6.
232
11 Source Code
TradeStation 6
To create an archive in TradeStation 6, take the following steps:
1. In the TradeStation 6 application, select:
File->Import/Export EasyLanguage
2. Click on:
Export EasyLanguage Documents File (ELD)
3. Click:
Next >
4. Under the Analysis Type: dropdown menu, select:
All Techniques
5. Scroll down until you see the Acme prefix. Highlight:
Acme
All
Strategies
6. Click the > button repeatedly until all of the Acme techniques have
been transferred to the Techniques to Export: pane on the right.
7. Click:
Next >
8. Enter the location and name where the archive file will be created, e.g.,
c:\temp\Acme.eld
9. Click:
Finish
10. A Reminder dialog box will appear saying:
Strategies and Functions used by the selected Strategies will be
automatically transferred as well.
11. Click:
OK
12. The transfer process will begin. An Export Success dialog box will ap-
pear saying:
You have successfully exported your analysis techniques
13. Click:
OK
14. The archive file named Acme.eld has been created in the directory:
c:\temp\
The archive file can now be distributed and imported into TradeStation 6.
11.2 Compilation
233
11.2.2 Importing the Code into TradeStation 6
Once the archive has been created, it can be imported into TradeStation 6 with
the following steps:
1. In the TradeStation 6 application, select:
File->Import/Export EasyLanguage
2. Click on:
Import
EasyLanguage
file
(ELD, ELS,
or
ELA)
3. Click:
Next >
4. Type the location and name where the archive file is located, e.g.,
c:\temp\Acme.els
5. Click:
Next >
6. The analysis types will be displayed and checked. If not checked, click:
Select All
7. Click:
Next >
8. The available analysis techniques will be displayed and checked. If not
checked, click-
Select All
9. Click:
Finish
10. A Reminder dialog box will appear saying:
Strategies and Functions used by the selected Strategies will be
automatically transferred as well.
11. Click:
OK
12. The
transfer
process will begin. Possibly,
a
Confirm
file
replace
dialog
box will appear asking if you would like to replace an existing analysis
technique. Depending on whether or not the file to import is newer
than the existing one, select Yes if newer, No if not.
13. TradeStation will begin verifying all of the code.
14. An Import Success dialog box will appear saying:
You have successfully imported your analysis techniques
15. Click:
OK
234
11 Source Code
11.3 Using the Software
The Acme systems and indicators are applied using the standard Trade Station
Windows menus:
a Insert—Indicator
a Insert->PaintBar
a Insert->Strategy
11.3.1 Acme All Strategies
A Strategy named Acme All Strategies has been created that combines the Acme
Systems F, M, N, R, and V. This strategy can be inserted into a TradeStation
chart like any other strategy (the Acme P system has been excluded because it is
a special intraday strategy).
11.3.2 Acme Spread Indicator
The Acme Spread Indicator requires four Data charts for the two stock symbols
in its Chart window. The first two charts are intraday (Datal and Data2), and
the second two charts are daily (Data3 and Data4) as follows:
1. Stock A : Intraday
2. Stock B : Intraday
3. Stock A : Daily (hidden optional)
4. Stock B : Daily (hidden optional)
The spread indicator uses the daily data for calculating historical volatility and
correlation values. The daily data is required in the chart window but does not
need to be displayed. We recommend 3- or 5-minute charts for pair trading.
11.3.3 AcmeGetFloat Function
The Acme F System requires the use of a function AcmeGetFloat. Since the float
is fundamental information and cannot be obtained through the TradeStation
interface, the AcmeGetFloat function contains the float values for over 1500
commonly traded stocks. If a symbol is not listed in this function, then the float
analysis techniques simply do nothing because the float value is zero. To add a
stock to the list in the AcmeGetFloat function, perform the following steps:
1.
Open
the
EasyLanguage
function
AcmeGetFloat.
11.4 Source Code
235
2. Scroll down the document to insert the new symbol alphabetically.
The function uses a binary sort to locate a symbol quickly, so it must
be in alphabetical order; otherwise, it will not be found.
3. Copy and paste one of the surrounding lines in the function. Update
the line with the new symbol and float value (refer to Chapter 4 for
getting the float value).
4. After the symbol has been added, Verify the function (F3).
5. The float analysis techniques should now appear in the symbol's chart
window.
11.4 Source Code
All of the Acme code is listed in alphabetical order. Every signal, indicator, and
function has been written in EasyLanguage. To build each of the strategies, use
the TradeStation StrategyBuilder™ to create a new strategy using the following
steps:
a Create the new strategy with the proper name.
a Add each signal to the strategy.
a Each strategy should contain the signals shown in each table.
For TradeStation 6, insert each system from the table into the chart window
to form the overall strategy.
Acme All Strategies
Strategy
Table 11.10. Acme All Strategies
Signal Name
Acme F System
Acme M System
Acme N System
Acme R System
Acme V System
Acme Trade Manager
Long Entry
V
V
V
V
V
Long Exit
V
Short Entry
V
V
V
V
Short Exit
V
238
11 Source Code
Acme F System
11.4 Source Code
239
240
11 Source Code
Acme Float Box
Indicator
11.4 Source Code
241
242
11 Source Code
Acme Float Channel
Indicator
11.4 Source Code
243