SUPPLY CHAIN GAMES: OPERATIONS MANAGEMENT AND RISK VALUATION phần 4 doc
Bạn đang xem bản rút gọn của tài liệu. Xem và tải ngay bản đầy đủ của tài liệu tại đây (644.49 KB, 52 trang )
the replenishment period: the greater the replenishment period T, the
larger the base-stock level,
0
)(
>
∂
∂
T
Ts
R
nT
.
Proof: First note that neither J
d
nor its derivative, which is the left-hand
side of equation (3.54), denoted by B, explicitly depends on s
nT
. Further-
more, according to Proposition 3.3, no matter what base-stock level s
nT
we
choose, the quantity that retailer n orders has the same distribution, which
depends only on demand. Thus, given replenishment period T, f
Q
(.) does
not depend on the base-stock policy s
nT
employed. This is to say that J
d
and
B are independent on s
nT
. However, if B does not depend on s
nT,
then the
distributor's best response T=T
R
(s
nT
) does not depend on s
nT
, i.e,
0=
∂
∂
nT
R
s
T
.
The retailer's best response is determined with the standardized base-
stock level,
*)(
nnn
R
nTnT
sTTTss
σµ
+== (see Proposition 3.4), and thus,
*
2
1
)(
nnn
R
nT
s
T
T
Ts
σµ
+=
∂
∂
>0,
as stated in the proposition.
There are two important conclusions related to Proposition 3.5. The first
conclusion is concerned with the supply chain's performance and thereby
the corresponding centralized supply chain. If the supply chain is vertically
integrated with one decision-maker responsible for setting both a replenish-
ment period and base-stock level for each retailer, then the centralized
objective function is a summation of all costs involved:
∑
+=
n
n
rd
JJTJ )(
.
The distributor's cost J
d
is independent of the base-stock level, as shown
in Proposition 3.5. Therefore, applying the first-order optimality condition
to J(T) with respect to either
n
t
q
or
nT
s
, we obtain equation (3.48). This
implies that the condition for the Nash base-stock level is identical to the
system-wide optimality condition. Next, to find the system-wide optimality
condition for the replenishment period, we differentiate J(T) with respect
to T, which, when taking into account (3.54) and (3.55), results in
T
TJ
∂
∂ )(
=
ξξ
ξξ
df
T
TC
TT
TC
Q
)()
),(),(
(
2
−
∂
∂
∫
∞
∞−
-
∫∫
∞
−
∞−
+
Φ−−Φ−−
*
*
])()()()([
2
**
3
n
n
s
nnn
s
n
n
dzzzshdzzzsh
T
σ
=0. (3.56)
148 3 MODELING IN A MULTI-PERIOD FRAMEWORK
3.2 REPLENISHMENT GAME: CASE STUDIES 149
Comparing equations (3.56) and (3.54) we find the following property.
Proposition 3.6. Let
T
B
∂
∂
>0 and f
nT
(.) be the normal density function with
mean Tµ
n
and standard deviation
T
n
. The system-wide optimal replenish-
ment period and base-stock level are greater than the Nash replenishment
period and base-stock level respectively.
Proof: Let us substitute T in equation (3.56) with the Nash period T
n
= .
Then the first term in (3.56) vanishes as it is identical to B from (3.54),
while the second term is negative, i.e.,
T
J
∂
∂ )(
β
<0. Since both
T
B
∂
∂
>0 and
0
2
2
>
∂
∂
−
T
J
n
r
(see Proposition 3.4), then
T
TJ
∂
∂ )(
increases if T increases and
thus (3.56) holds only if the system-wide optimal period T*> .
Finally, it is shown in Proposition 3.5, that
0>
∂
∂
T
s
nT
, i.e., if T> , then
s
nT
>s
n
.
Proposition 3.6 sustains the fact that vertical competition causes the
supply chain performance to deteriorate as discussed in Chapter 2. Similar to
the double marginalization effect, this happens because the retailers ignore
the distributor’s transportation cost by keeping lower, base-stock inventory
levels. The distributor, on the other hand, ignores the retailers’ inventory
costs when choosing the replenishment period. Figure 3.4 illustrates the
effect of vertical competition on the supply chain.
The second property, which is readily derived from Proposition 3.5, is
related to the uniqueness of the Nash solution.
Proposition 3.7. Let f
nT
(.) be the normal density function with mean Tµ
n
and standard deviation
T
n
. The Nash equilibrium (T
n
, s
nT
n
) determined
by Theorem 3.2 is unique.
Proof: The proof immediately follows from Proposition 3.5 and Theorem
3.2. Indeed the two best response curves T =T
R
(s
nT
) and
)(Tss
R
nTnT
=
can
intersect only once if
0=
∂
∂
nT
R
s
T
and
0
)(
>
∂
∂
T
Ts
R
nT
, i.e, a solution determined
by Theorem 3.2 is unique.
The transportation costs were obtained from a sample of 16 pharmacies
which are being exclusively supplied every 14 days on a regular basis by
Clalit's primary distribution center. The base-stock policy was determined
according to service level definition and demand forecasts. Pharmacists
place their orders using software that computes replenishment quantities
for every item with respect to the base-stock level. The pharmacist electro-
nically sends the completed order to the distribution center for packing and
dispatching. If there is a shortage or expected shortage before the next
planned delivery, the pharmacist can send an urgent order to be delivered
not later than two working days from the time of the order.
An external subcontractor (according to outsourcing agreement) delivers
the orders to the pharmacies. The contractor schedules the appropriate
vehicle (trucks in case of regular orders and mini-trucks for urgent orders)
according to the supply plans for the following day. Delivery costs depend
on the type of the vehicle used (track or mini-track) and the number of
pharmacies to be supplied with the specific transport.
To estimate the influence of a periodic review cycle on the transportation
costs (planned and urgent deliveries) the replenishment period for the 16
pharmacies was changed from the original two weeks to three and four
weeks. This resulted in a total of 18 replenishment cycles representing 34
working weeks. Monthly sales of the selected pharmacies varied from
$50,000 to $136,000. Each order that was sent from a pharmacy was
reported, and each transport, with every delivery on it, including invoices
that were paid to the vehicle contractor, was reported. The data, processed
with SPSS non-linear regression analysis, indicate that the resultant
parameters of the transportation cost function are a=4463, b=0.0000163
while the average estimation error is less than 5%.
Numerical Analysis
The goal of our numerical analysis is to check whether this supply chain is
predictable using equilibria and how it is affected by the distributor’s leader-
ship. In other words, we compare the objective functions (3.43) and (3.45),
as well as the effect on the overall supply chain (the sum of (3.43) and
(3.45)). Specifically, with distributor leadership, its expected cost equation
(3.52), is
=
1d
J
ξξξα
α
dfC
Q
)(),(
1
∫
∞
∞−
, while without leadership it
3.2.3 EMPIRICAL RESULTS AND NUMERICAL ANALYSIS
150 3 MODELING IN A MULTI-PERIOD FRAMEWORK
Empirical Results
3.2 REPLENISHMENT GAME: CASE STUDIES 151
is
=
2d
J
ξξξβ
β
dfC
Q
)(),(
1
∫
∞
∞−
. Since is found by minimizing the entire
objective function J
d1
, while assumes the normal probability function
independent on the period T, the distributor obviously is better off if he is
the leader and therefore decides first rather than when the decision is made
simultaneously (no leaders).
Similarly, retailer n expected cost under the distributor leadership is
=
n
r
J
1
∫∫
∞
−
∞−
+
−−−
α
α
αααα
α
n
n
s
nnnn
s
nn
dDDfDshdDDfDsh ])()()()([
1
,
while under no leadership it is
=
n
r
J
2
∫∫
∞
−
∞−
+
−−−
β
β
ββββ
β
n
n
s
nnnnn
s
n
dDDfDshdDDfDsh ])()()()([
1
.
The numerical results of our empirical studies show that the current
equilibrium of Clalit’s supply chain, which is an outcome of many adjust-
ments it has undergone during many years of operations, is close to and
positioned in between both the Stackelberg and Nash equilibria. This is in
contrast to the skepticism of many practitioners who believe that a theoretical
equilibrium is hardly attainable in real life. Specifically, the equilibrium
replenishment period under equal competition is about 16 days; the current
replenishment period is 14 days; and the equilibrium under the distributor’s
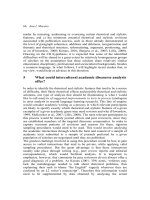
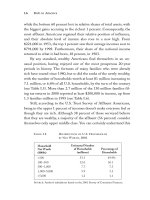
leadership is 11 days. Figure 3.3 presents the equilibria over the distributor’s
transportation cost function.
Figure 3.3. The transportation cost as a function of T along with the Stackelberg,
The Stackelberg equilibrium demonstrates the power the distributor can
harness as a leader. The economic implication of harnessing the distributor’s
C
T
current
T
17 11
500
1000
Nash and current equilibrium replenishment periods
power is about 20 NIS per day ($ 4 per day) for the sampled supply
volumes. The annual significance, in terms of the overall supply chain, is
1.4 million NIS, or 14% of the total delivery costs. Interestingly enough,
the current equilibrium is closer to the Nash replenishment period rather
than to the Stackelberg which sustains Clalit’s managerial intuition that its
distribution centers do not succeed in taking full advantage of their power
over the pharmacies.
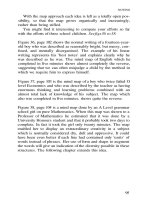
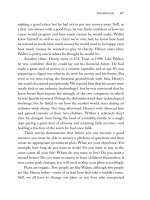
Figure 3.4. Overall supply chain cost, total retailers cost, and distributor’s cost
Figure 3.4 presents the results of the calculation for the supply chain as
a whole, i.e., including the retailers’ inventory management costs and the
distributor’s transportation costs. In Figure 3.4, the total costs for the Stackel-
berg, current and Nash strategies as well as the system-wide optimal (global)
solution appear as dots on the total cost curve. From this diagram it is easy
to observe the effect of the total inventory-related cost on the entire system
performance. Specifically, we can see that if the supply chain is vertically
integrated or fully centralized and thus has a single decision-maker who is
in charge of all managerial aspects, the system-wide optimal replenishment
period is 18 days versus the current equilibrium of 14 days. The significance
of this gap (which agrees with Proposition 3.6) is that more than 3 million
NIS could be saved if the system were vertically integrated. If the distri-
butor attempts to locally optimize (the Stackelberg strategy) this would
lead to annual savings in transportation costs of only 1.4 million NIS.
However, the significance of such an optimization for the supply chain
as a whole is a loss of 8 million NIS. This is the price to be paid if the
System-wide T
Distributor’s Cost
Retailers Cost
C
T
Current
T
17 11
500
1000
Total Cost
152 3 MODELING IN A MULTI-PERIOD FRAMEWORK
REFERENCES 153
supply chain is either decentralized or operates as a decentralized system.
Coordination
This case study was motivated by increasingly high transportation costs
incurred by a large health service provider which is part of a supply chain
consisting of multiple retailers (pharmacies) and a distribution center. The
costs are attributed to unlimited urgent orders that the retailers could place
in the system. Management’s approach to handling this problem was to
reduce the replenishment period or even transform the policy from periodic
to continuous-time review. The latter option in the current conditions would
simply imply daily (regular) product deliveries. As shown in Proposition 3.6,
such an approach would only lead to further deterioration in supply chain
performance due to the double marginalization effect inherent in vertical
supply chains. This is also sustained by a numerical analysis of the equili-
brium solutions for the case of a normal demand distribution. The analysis
shows that if a distributor imposes his leadership on the supply chain, i.e.,
acts as the Stackelberg leader, then the replenishment equilibrium period is
reduced. This makes it possible to cut high transportation costs. However,
if instead of an imposed leadership on the supply chain, it is vertically
integrated or the parties cooperate, then the potential savings in overall
costs are much greater. In such a case, the system-wide optimal replenishment
period must increase rather than decrease or transform into a continuous-
review policy. Thus, in the short run, imposing leadership by reducing the
replenishment period may cut high transportation costs. However, in the
long-run, greater savings are possible if, for example, the vendor-managed
inventory (VMI) approach is adopted by the retailers or imposed on the
retailers by the health provider. In such a case, a distribution center will
decide when and how to replenish inventories and the system will become
vertically integrated with respect to transportation and inventory considera-
tions. This illustrates the economic potential in cooperation and a total
view of the whole supply chain.
REFERENCES
Anupinidi R, Bassok Y (1998) Approximations for multiproduct contracts
with stochastic demands and business volume discounts: Single-supplier
case. IIE Transactions 30: 723-734.
Ballou RH (1992) Business Logistics Management, Englewood Cliffs, NJ,
Prentice Hall.
Bylka S (2005) Turnpike policies for periodic review inventory model
with emergency orders. International Journal of Production Economics,
Cachon GP (2001a) Managing a retailer’s shelf space, inventory, and
transportation. Manufacturing and Service Operations Management 3:
211-229.
Cachon GP (2001b) Stock wars: inventory competition in a two-echelon
supply chain with multiple retailers. Operations Research 49: 658-674.
Cachon G, Netessine S (2004) Game theory in Supply Chain Analysis in
Handbook of Quantitative Supply Chain Analysis: Modeling in the
eBusiness Era. edited by Simchi-Levi D, Wu SD, Shen Z-J, Kluwer.
Chiang C (2003) Optimal replenishment for a periodic review inventory
system with two supply modes. European journal of Operational
Research 149: 229-244.
Chiang C, Gutierrez GJ (1996) A periodic review inventory system with
two supply modes. European journal of Operational Research 94: 389-
403.
Debreu D (1952) A social equilibrium existence theorem, Proceedings of
the National Academy of Science 38: 886-893.
Flynn J, Garstka S (1997) The optimal review period in a dynamic
inventory model. Operations Research 45: 736-750.
Hause RG, Jamie KD (1981) Measuring the impact of alternative market
classification systems in distribution planning, Journal of Business Logis-
tics 2: 1-31.
Kogan K, Hovav S, Perlman Y (2007) Equilibrium Replenishment in a
Supply Chain with a Single Distributor and Multiple Retailers. Working
paper, Bar-Ilan University.
Leng M, Parlar M (2005) Game theoretic applications in supply chain
management: a review. INFOR 43: 187-220.
Simchi-Levi SD, Wu, Shen Z (2004) Handbook of quantitative Supply
chain analysis: Modeling in the E-Business era, pp. 13-66.
Sethi, SP, Yan H, Zhang H (2005) Inventory and Supply Chain Manage-
ment with Forecast Updates. International Series in Operations Research
& Management Science, Vol. 81, Springer
Rao US (2003) Properties of the Periodic Review (R, T) Inventory Control
Policy for Stationary, Stochastic Demand. MSOMS 5: 37-53.
Teunter R, Vlachos D (2001) An inventory system with periodic regular
review and flexible emergency review. IIE Transactions 33: 625-635.
Veinott Jr.AF (1966) The status of mathematical inventory theory. Mana-
154 3 MODELING IN A MULTI-PERIOD FRAMEWORK
93: 357-373.
gement Science 12: 745-777.
REFERENCES 155
Wang H, Guo M, Efstathiou J (2004) A game theoretical cooperative mecha-
nism design for two-echelon decentralized supply chain. European journal
of operational research 157: 372-388.
Whittmore AS, Saunders S (1977) Optimal inventory under stochastic
demand with two supply options. SIAM Journal of Applied Mathematics,
32: 293–305.
PART II
INTERTEMPORAL SUPPLY
CHAIN MANAGEMENT
So far we have considered discrete-time, single- and multi-period models
of competition and coordination in supply chains. In this chapter, we consider
continuous-time, intertemporal supply chain models operating in a dynamic
environment arising from rapidly changing market conditions including
such factors as so-called “word of mouth” and “customer fatigue”; econo-
mies of scale; seasonal, fashion and holiday demand patterns; and uncer-
tainty. Since dynamic changes may occur at any point in time, control
actions can be exercised continuously. As a result, intertemporal competition
between non-cooperative supply chain agents leads to differential games.
In some cases, intertemporal relations can be handled by straightforwardly
adjusting decision variables as though there is no long-term effect on the
supply chain, i.e., by static (myopic) optimization, at each time point inde-
pendently. However, in most cases, there is a long-term dynamic effect
and thus the results obtained for the corresponding static models are no
longer valid.
Our goal in this chapter is to illustrate the effect of dynamic conditions
on supply chain performance when decisions can be taken at any time point
rather than at the beginning (or end) of a certain review period as was the
case with the models studied in Chapters 2 and 3. Both periodic and con-
tinuous operational review modes are discussed. When inventories and
demands are not observable within a review period, continuous in-time
decisions are derived based on expected values and thereby known proba-
bility distributions.
4.1 DIFFERENTIAL GAMES IN SUPPLY CHAINS
A retailer’s ability to collect detailed information about customer purchasing
behavior and the ease of changing prices due to new technologies (including
Internet and IT) has engendered extensive research into dynamic pricing in
general and continuous-time pricing strategies in particular. Increasing
attention has been paid to dynamic pricing in the presence of inventory
IN AN INTERTEMPORAL FRAMEWORK
4 SUPPLY CHAIN GAMES: MODELING
considerations (see, for example, the survey by Elmaghraby and Keskinocak
2003) and to coordinated pricing and production/procurement decisions
(see surveys by Chan et. al. 2003; Yano and Gilbert 2002; Cachon 2003).
However, despite this range of research interests, relatively few studies are
devoted to the continuous interaction between dynamic retail prices,
inventory-related costs and wholesale prices in supply chains, i.e., to a
dynamic, continuous-time game between supply chain members.
Due to mathematical difficulties inherent in differential games, i.e.,
games involving decisions that have to be made continuously, the supply
chain management literature has been primarily concerned only with the
application of deterministic differential models (Cachon and Netessine
2004). Two types of solution approaches have been addressed with respect
to the supply chain decision u(t) and state X(t) variables. One is an open-
loop solution u*=u*(t), which is determined as a function of time. The
other, an optimal solution found as a function of state history, u*=u*(t,
x()
t≤≤
τ
0 ), is referred to as a closed-loop solution. In a special, memory-
less case of u*=u*(x(t), t), the solution is referred to as a feedback control
(for further details, see the appendix to the book). Jorgenson (1986) derives
an open-loop Nash equilibrium under static deterministic demand, d(t)=
a(t)-b(t)p(t), with demand potential a(t) and customer sensitivity b(t) being
constant and thereby not affecting the supply chain dynamics. Eliashberg
and Steinberg (1987) use the open-loop Stackelberg solution concept in a
game with a manufacturer and a distributor (both with unlimited capacity)
involving quadratic seasonal demand potential a(t) and constant sensitivity
b(t). Assuming that the wholesale price the manufacturer charges the dis-
tributor is constant and that no backlogs are allowed, they investigate the
impact of the quadratic seasonal pattern upon the various policies of the
distribution channel. They acknowledge that demand uncertainty, together
with stock-out costs, may change the results and suggest supplementing the
proposed procedure with a sensitivity analysis. Desai (1992) allows demand
potential to change with an additional decision variable. To address seasonal
demands, he later suggests a numerical analysis for a general case of the
open-loop Stackelberg equilibrium under sine form of a(t), constant cus-
tomer sensitivity b(t) and unlimited manufacturer and retailer capacities
(Desai 1996). For more applications of differential games in management
science and operations research, we refer the interested reader to a review
by Feichtinger and Jorgenson (1983).
In this chapter, we extend the static games considered in Chapter 2 to
study various dynamic effects on the supply chain by
160 4 MODELING IN AN INTERTEMPORAL FRAMEWORK
4.1 DIFFERENTIAL GAMES IN SUPPLY CHAINS 161
• comparing system-wide and equilibrium solutions of dynamic pro-
blems with the corresponding solutions of their static prototypes,
which we now refer to as myopic solutions that ignore dynamics;
• investigating the effect of system dynamics on vertical and hori-
zontal competition in supply chains under simple demand patterns,
demand uncertainty and economy of scale;
• examining the effect of standard (static) as well as dynamic coordi-
nating tools on the performance of dynamic supply chains.
In particular, we find that even though the myopic attitude of a firm is
troublesome in many cases, sometimes it remains optimal, as if the problem
is static, and sometimes it may even coordinate supply chains. Similarly,
standard static coordinating tools in some dynamic conditions result in a
perfectly coordinated supply chain. In other cases they are not efficient
enough.
We start by considering the effect of learning, with production experience,
on vertical pricing and horizontal production competition (Section 4.2).
Both static pricing and production games of Chapter 2 are extended with
dynamic equations which model production cost reduction as a result of
accumulated production experience in economy of scale. In addition to
endogenous change in demand, accounted for in the corresponding static
games, we assume that the demand for products may evolve gradually with
time in an exogenous way as a result of “word of mouth”, “customer
fatigue”, or changes in fashion or the season.
Section 4.3 focuses on inventory competition. In this part of the chapter
we discuss two differential games. One game is a straightforward extension
of the static pricing game involving the retailer’s inventory dynamics. A
single supplier and retailer make up a supply chain operating over a pro-
duction horizon. The supplier sets a wholesale price which is not necessarily
constant along the production horizon. In response, the retailer chooses
dynamic pricing, production and inventory policies. The need for a dynamic
response is due to interaction between a limited processing capacity that
features the retailer and exogenous demand peaks which may exceed the
capacity. In contrast to the production/pricing games of the first part of this
chapter, the exogenous change in demand is instantaneous rather than gra-
dual and is due to special business or high demand periods such as, for
example, national holidays and weekends. Such periods are typically affect-
ted by the so-called “customer price anticipation” which induces increased
price sensitivity. We show that increased price sensitivity, limited proces-
sing capacity and available inventory storage lead the retailer to develop
sophisticated inventory policies which involve both back-ordering and
forward buying. Compared to the static pricing game, these dynamic policies
impact the vertical price competition.
As an alternative to the pricing competition with one-side (the retailer’s)
inventory considerations, the other game discussed in Section 4.3 focuses
solely on inventory competition. In this differential inventory game, since
the demand is exogenous, pricing has no impact on production. The system
consists of one supplier and one retailer. We assume that both the retailer
and the supplier have limited capacity. This restriction, along with seasonal
demand peaks, induces the supplier and retailer to accumulate inventories
and balance production between backlog and surplus inventory costs. Thus,
inventory considerations by both sides are involved and the dynamic produc-
tion policies that the firms employ cause inventory competition which
affects the supply chain performance.
Section 4.4 is devoted to two differential games which are extensions of
static stocking and outsourcing games. We assume that the demand is
random and discuss different forms of subcontracting. One game addresses
the question of balancing limited production capacity with an unlimited
advance order of end-products. We assume the demand has no peaks; the
selling season is short (as in the classical newsvendor problem); and the
supply lead-time is long. Therefore, once the season starts, it is too late to
outsource the production while in-house capacity can only respond to limited
demand fluctuations.
The supply chain involves a single manufacturer and a single supplier
(subcontractor) contracting before the selling season starts. The subcontract-
tor sets a wholesale price. In response, the manufacturer selects an order
quantity (referred to as advance order) to be delivered by the beginning of
the selling season and chooses his production/inventory policy during the
season. This description implies that the intertemporal production balancing
game is just one of the possible extensions of both the static stocking game
and the static outsourcing game (with zero setup cost) considered in
Chapter 2. A further extension to these static games as well as to the
differential balancing game would be to relax the requirement of only a
single advance order contracted out. Such an extension is treated as the
differential outsourcing game. In this final intertemporal game of the chapter,
production outsourcing is possible at any time point of a production horizon.
There are multiple suppliers of limited capacity which determine wholesale
prices and a random peak of demand is expected by the end of the pro-
duction horizon. The manufacturer’s goal is to increase capacity to cope
with the peak by selecting in-house production, suppliers for outscoring
and inventory policies.
The last section of this chapter is devoted to horizontal investment
competition in supply chains. The main focus of this section is on feedback
162 4 MODELING IN AN INTERTEMPORAL FRAMEWORK
4.2 INTERTEMPORAL PRODUCTION/PRICING COMPETITION 163
equilibrium and cooperation strategies of multiple firms, which co-invest
in a supply chain infrastructure.
4.2 INTERTEMPORAL PRODUCTION/PRICING
COMPETITION
In this section we consider non-cooperative intertemporal pricing and produc-
tion games which underlie vertical and horizontal competition in supply
chains involved with production experience dynamics.
Consider a two-echelon supply chain consisting of a single supplier (manu-
facturer) selling a product type to a single retailer over a period of time, T.
The supplier has ample capacity and can deliver any quantity q at any time
t. In contrast to the static model, we assume that the period during which
the parties interact is long enough so that the customer demand, which is
endogenous in the product price, evolves also over time exogenously. This
is to say, we adopt Bertrand’s model of pricing competition with the
quantity sold per time unit, q, depending not only on product price, p,
0<
∂
∂
p
q
and
0
2
2
≤
∂
∂
p
q
, but also on time t elapsed, q=q(p,t). Therefore,
t
tpq
∂
∂ ),(
is not necessarily equal to zero. The exogenous change in demand
is due to the interaction of various factors including seasonal fluctuations,
fashion trends, holidays, customer fatigue and word of mouth. When the
cumulative sales,
∫
t
dssspq
0
)),((
, i.e., the experience, have little effect on
these factors, the dynamic changes can be straightforwardly dealt with by
the corresponding price adjustment as in traditional static supply chain
models. On the other hand, if production (sales) of large quantities
(economy of scale) results in the so-called learning effect, which makes it
possible to reduce the unit production cost, c(t), then there is a long-term
impact of experience that cannot be studied in the framework of static
models.
Let the retailer’s price per product unit be p(t)=w(t)+m(t), where m(t) is
the retailer’s margin at time t and w(t) is the supplier’s wholesale price.
Then, if both parties, the supplier and the retailer, do not cooperate to
4.2.1 THE DIFFERENTIAL PRICING GAME
maximize the overall profit of the supply chain along period T, their deci-
sions, w(t) and m(t), affect each other’s revenues at every point of time,
resulting in a differential game. In such a game, the supplier chooses a
wholesale price, w(t), at each time point t and the retailer selects a margin,
m(t), and thus determines the quantity q(p,t) he will order at price w(t) in
order to sell it to his customers at price p(t)= w(t)+m(t). Consequently, the
retailer orders q(p,t) products at each time t and the supplier accumulates
experience by producing these quantities over time,
∫
t
dssspq
0
)),((
. As a
result, the production cost, c(t), is reduced. We thus have the following
problems.
The supplier’s problem
w
max J
s
(w,m)=
w
max
()
∫
+−
T
dtttmtwqtctw
0
),()())()((
(4.1)
s.t.
(
)
ttmtwqtc ),()()(
+
−
=
γ
&
, c(0)=C (4.2)
w(t)
≥ c(t), (4.3)
where is the learning factor, i.e., the decrease in unit production cost per
one more product produced.
The retailer’s problem
m
max J
r
(w,m)=
m
max
()
∫
+
T
dtttmtwqtm
0
),()()(
(4.4)
s.t.
m(t)
≥ 0, (4.5)
q(w(t)+m(t),t)
≥ 0. (4.6)
Formulations (4.1)-(4.6) assume non-cooperative behavior of the supply
chain members which affects the overall supply chain performance. On the
other hand, if the supply chain is vertically integrated or centralized, so
that a single decision-maker is in charge of all managerial aspects of the
supply chain, then we have the following single problem as a benchmark
of the best supply chain performance.
The centralized problem
wm,
max J(w,m)=
wm,
max [ J
r
(w,m)+J
s
(w,m)]=
164 4 MODELING IN AN INTERTEMPORAL FRAMEWORK
4.2 INTERTEMPORAL PRODUCTION/PRICING COMPETITION 165
wm,
max
∫
+−+
T
dtttmtwqtctmtw
0
)),()(())()()((
(4.7)
s.t.
(4.2)-(4.3) and (4.5)-(4.6).
We henceforth omit independent variable t wherever the dependence on
time is obvious.
System-wide optimal solution
To evaluate the best possible performance of the supply chain, we first study
the centralized problem by employing the maximum principle. Specifically,
the Hamiltonian for the problem (4.2)-(4.3), (4.5)-(4.6) and (4.7) is
)),()(()()),()(())()()(()( ttmtwqtttmtwqtctmtwtH
+
−
+
−+=
γ
ψ
, (4.8)
where the co-state variable
)(t
ψ
is determined by the co-state differential
equation
)),()((
)(
)(
)( ttmtwq
tc
tH
t +=
∂
∂
−=
ψ
&
,
0)(
=
T
ψ
. (4.9)
Note that since function (4.7) is strictly concave, while all constraints are
linear, the maximum principle presents not only necessary but also sufficient
optimality conditions and the optimal solution which satisfies these condi-
tions is unique.
The Hamiltonian (4.8) can be interpreted as the instantaneous profit rate,
which includes the value
c
&
ψ
of the negative increment in unit production
cost created by the economy of scale. The co-state variable
ψ
is the shadow
price, i.e., the net benefit from reducing production cost by one more
monetary unit at time t. The differential equation (4.9) states that the mar-
ginal profit from reducing the production cost at time t is equal to the
demand rate at this point.
From (4.9) we have
dsssmswqt
T
t
)),()(()( +−=
∫
ψ
(4.10)
According to the maximum principle, the Hamiltonian is maximized by
admissible controls at each point of time. That is, by differentiating (4.8)
with respect to m(t) and w(t) and taking into account that p(t)=w(t)+m(t),
we have two identical optimality conditions defined by the following equation
0
)(
)),()((
))()()()(()),()(( =
∂
+∂
−−+++
tp
ttmtwq
ttctmtwttmtwq
γψ
,
where the shadow price (co-state variable)
)(t
ψ
is determined by (4.10) and
the production cost (state variable) c(t) is found from (4.2)
dsspqCtc
t
),()(
0
∫
−=
γ
(4.11)
Therefore, as with the static pricing model, only optimal price matters in
the centralized problem, p*
≥ c, while the wholesale price, w ≥ c, and the
retailer’s margin, m
≥
0, can be chosen arbitrarily so that p*=w+m. This is
due to the fact that w and m represent internal transfers of the supply chain.
Thus, the proper notation for the payoff function is J(p) rather than J(m,w)
and the only optimality condition is,
0
)*,(
)*()*,( =
∂
∂
−−+
p
tpq
cptpq
ψγ
. (4.12)
More exactly, p* is the unique optimal price if it satisfies equation
(4.12) and p*(t)
≥
c(t), where c and
ψ
are determined by (4.11) and (4.10)
respectively. Otherwise p*(t)=c(t) and the supply chain is not profitable at
time t.
Let us introduce the maximum price, P(t), at time t, q(P(t))=0. Naturally
assume that P>c, then, since,
0
≤
ψ
(see equation (4.10)), P>c+
ψγ
. Next it
is easy to verify that if
0≥
−
−
ψγ
cp
, then
2
2
2
2
),(
)(
),(
2
p
tpq
cp
p
tpq
p
H
∂
∂
−−+
∂
∂
=
∂
∂
ψγ
<0, (4.13)
and equation (4.12) has an interior solution such that P>p*
≥
c+
ψγ
. This
implies that p*(t)>c(t) does not necessarily hold at each point of time. In
such time points the boundary solution p*(t)=c(t) will be optimal. Comparing
the system-wide dynamic optimality condition (4.12) with the optimality
condition (2.7) for the corresponding static formulation, we observe that
the only difference is due to the product of the shadow price
ψ
and learning
factor present in the dynamic formulation. Referring to the static optimal
solution at time point t as myopic, since it ignores the future learning effect
(the long-run effect
γ
set at zero) and taking into account that
)(t
ψ
≤
0 for
Note, that henceforth in the book we distinguish between cases when all
chain) and those when the J
≥
0 and thereby the supply chain is sustainable
but not necessarily profitable. Similarly, one can characterize separately
each party as either profitable or sustainable or as neither of the two.
0 ≤ t ≤ T, we find that the myopic attitude leads to overpricing.
166 4 MODELING IN AN INTERTEMPORAL FRAMEWORK
supply chain parties have profits at any point of time, J >0 (profitable supply
4.2 INTERTEMPORAL PRODUCTION/PRICING COMPETITION 167
Proposition 4.1. In intertemporal centralized pricing (4.2)-(4.3), (4.5)-
(4.6) and (4.7), if the supply chain is profitable, i.e., P>p>c, the myopic
retail price will be greater and the myopic retailer’s order less than the
system-wide optimal (centralized) price and order quantity respectively for
Tt <≤0 .
Proof: Comparing (2.7) and (4.12) and employing superscript M for
myopic solution we observe that
=
∂
∂
−−+
p
tpq
cptpq
)*,(
)*()*,(
ψγ
p
tpq
cptpq
M
MM
∂
∂
−+
),(
)(),(
=0, (4.14)
while taking into account that p>c,
ψ
<0 for Tt
<
≤
0 , and 0<
∂
∂
p
q
,
p
tpq
cptpq
M
MM
∂
∂
−−+
),(
)(),(
ψγ
<
p
tpq
cptpq
M
MM
∂
∂
−+
),(
)(),(
=0. (4.15)
Next, by denoting
p
tpq
cptpqpf
∂
∂
−−+=
),(
)(),()(
ψγ
, one can verify
that
0
)(
<
∂
∂
p
pf
.
Thus, from conditions (4.14) and (4.15) we have f(p
M
)<f(p*), which
with respect to the last inequality requires that p
M
>p* and, hence,
q(p
M
)<q(p*), as stated in Proposition 4.1.
According to Proposition 4.1, myopic pricing derived from static
optimization is not optimal. This, however, does not mean that dynamic
optimization necessarily leads to time-dependent prices. In other words, an
important question is whether the long-term effect of the economy of scale
causes the optimal price to evolve with time. It turns out that if the demand
does not explicitly depend on time, q(p,t)=q(p), the optimal centralized
pricing strategy is independent of time. Otherwise, for example, an exogen-
ous increase in demand monopolistically results in a price increase. This
property is stated in the following proposition under the assumption that if
0
),(
<
∂
∂
t
tpq
, then
0
),(
2
≤
∂∂
∂
tp
tpq
and if
0
),(
>
∂
∂
t
tpq
, then
0
),(
2
≥
∂∂
∂
tp
tpq
.
Proposition 4.2. In intertemporal centralized pricing (4.2)-(4.3),(4.5)-(4.6)
and (4.7), if the supply chain is profitable, i.e., P>p>c, and there is a
demand time pattern q(p,t) such that
t
tpq
∂
∂ ),(
exists, then the system-wide
optimal price monotonically increases as long as
0
),(
>
∂
∂
t
tpq
, and vice
versa as long as 0
),(
<
∂
∂
t
tpq
. Otherwise, if
t
tpq
∂
∂ ),(
=0 at an interval of
time, then the system-wide optimal price and order quantity are constant
at the interval.
Proof: Differentiating (4.12), we have
p
tpq
p
tp
tpq
p
p
tpq
cpp
p
tpq
t
tpq
∂
∂
+
∂∂
∂
+
∂
∂
−−+
∂
∂
+
∂
∂ )*,(
*]
)*,(
*
)*,(
)[*(*
)*,()*,(
2
2
2
&&&
ψγ
and thus
t
tpq
p
tpq
cp
p
tpq
p
∂
∂
−=
∂
∂
−−+
∂
∂ )*,(
]
)*,(
)*(
)*,(
2[*
2
2
ψγ
&
tp
tpq
cp
∂∂
∂
−−−
)*,(
)*(
2
ψγ
.
Recalling the assumption and (4.13) we readily observe that 0* >p
&
if
0
)*,(
>
∂
∂
t
tpq
, otherwise, 0*
≤
p
&
.
Game Analysis
We consider now a decentralized supply chain characterized by non-
cooperative or competing firms and assume that both players make their
decisions simultaneously. The supplier chooses a wholesale price w and
the retailer selects a price, p, or equivalently a margin, m, and hence orders
q(p,t) products at each t, Tt
≤
≤
0 . Since this differential pricing game is
deterministic, the retailer sells all the products that he has ordered.
Using the maximum principle for the retailer’s problem, we have
)),()(()()),()(()()( ttmtwqtttmtwqtmtH
r
+
−
+
=
γ
ψ
,
where the co-state variable
)(t
r
ψ
is determined by
0
)(
)(
)( =
∂
∂
−=
tc
tH
t
r
ψ
&
, 0)(
=
T
r
ψ
.
Thus,
)(t
r
ψ
=0 for Tt
≤
≤0 and the supplier’s production experience
does not affect the retailer. This is to say, the myopic pricing is optimal for
the non-cooperative retailer and the retailer can simply use the first- order
optimality condition to derive pricing strategy for each time point:
0
),(
),(
),(
=
∂
∂
++=
∂
∂
p
tpq
mtmwq
m
wmJ
r
. (4.16)
It is easy to verify that since the retailer’s objective function is strictly
concave in m, (4.16) has a unique solution. Or, by the same token, the
retailer’s best response function is unique. Comparing (4.12) and (4.16),
168 4 MODELING IN AN INTERTEMPORAL FRAMEWORK
4.2 INTERTEMPORAL PRODUCTION/PRICING COMPETITION 169
we conclude that the long-term dynamic effect of production experience
causes the supply chain performance to deteriorate even more than in the
corresponding static case with no learning.
Proposition 4.3. In vertical competition of the differential pricing game,
myopic pricing is optimal for the retailer. If the retailer and supplier profit
at each t, the retail price will be greater and the retailer’s order less than
the system-wide optimal (centralized) price and order quantity respectively.
Moreover, these gaps are even greater than those induced by the corres-
ponding static pricing game.
Proof: The first statement is due to the fact that
0
=
r
ψ
. Employing the
fact that
0)( <t
ψ
for Tt
<
≤0 , the proof of the second statement is similar
to that of Proposition 2.1. The last statement of Proposition 4.3 readily
results from Proposition 4.1.
Note, that our conclusion that vertical intertemporal pricing competition
increases retail prices and decreases order quantities compared to the system-
wide optimal solution does not depend on the type of game played. Speci-
fically, it does not depend on whether both players make a simultaneous
decision or the supplier first sets the wholesale price and thus plays the role
of the Stackelberg leader. As a result, similar to the static pricing game dis-
cussed in Chapter 2, the overall efficiency of the supply chain deteriorates
under intertemporal vertical competition. Moreover, in addition to the
traditional double marginalization effect, we observe the consequence of
the learning effect. That is, comparing (4.12) and (4.16), we find that the
deterioration of supply chain performance is due to the fact that the retailer
myopically ignores not only the supplier’s margin, w-c, from sales at each
time point but also the supplier’s profit margin from production cost
reduction,
ψγ
. It is because of the latter that the deterioration under
dynamic experience in intertemporal supply chain competition is even
greater than that which occurs in the static pricing game, as stated in
Proposition 4.3. The difference, however, shrinks with time as the shadow
price tends to zero by the end of the product production period T.
Equilibrium
To determine the Nash equilibrium which corresponds to the simultaneous
moves of the supplier and retailer, we next apply the maximum principle to
the supplier’s problem. Specifically, we construct the Hamiltonian
)),()(()()),()(())()(()( ttmtwqtttmtwqtctwtH
s
+
−
+
−=
γ
ψ
, (4.17)
where the co-state variable
)(t
s
ψ
is determined by the co-state differential
equation
)),()(()( ttmtwqt
s
+
=
ψ
&
,
0)(
=
T
s
ψ
. (4.18)
Differentiating the Hamiltonian with respect to wholesale price w we
have
0
),(
)(),( =
∂
∂
−−+
p
tpq
cwtpq
s
γψ
, (4.19)
which implies that an interior optimal solution determined by (4.19) is such
that
0>−−
γ
ψ
s
cw . Next, verifying the second derivative of the Hamiltonian,
we find that if
0>−−
γ
ψ
s
cw , then
0
),(
)(
),(
2
2
2
<
∂
∂
−−+
∂
∂
p
tpq
cw
p
tpq
s
γψ
From equation (4.19) and the last inequality, we observe that (i) although
the supplier naturally accounts for his margin from cost reduction with
experience, the severe problem of double marginalization persists since the
supplier ignores the retailer’s margin m; (ii) the intertemporal wholesale
price is lower than the myopic wholesale price which is obtained by setting
the learning effect at zero. The latter implies that the performance of the
supply chain further degrades if the supplier adopts a myopic attitude.
It is easy to verify that the supplier’s objective function is strictly con-
cave in w and, thus, the supplier’s best response (4.19) is unique as well.
Thus, the Nash equilibrium (w
n
,m
n
) is found by solving simultaneously
(4.19) and (4.16), which results in
w-c-m-
γ
ψ
s
=0 and
0
),2(
),2( =
∂
+
+
∂
+++
p
tmcq
mtmcq
s
s
γ
ψ
γψ
. (4.20)
Note that if the second equation of (4.20) has a solution in m, then this
solution is such that
p=
>
+
+
γ
ψ
s
mc 2
0,
0>
−
−
γ
ψ
s
cw
, (4.21)
which however does not ensure that w=c+m+
γ
ψ
s
≥ c. We conclude with
the following result.
s
ψ
pair (,) be a solution of system (4.20) in w
and m
respectively. If min{P-
c,}
≥
-
γ
ψ
s
, then the pair (w
n
=,m
n
=) constitutes a unique open-loop
Nash equilibrium of the differential pricing game with 0
≤
-
γ
ψ
s
<m
n
<(P-c-
γ
ψ
s
)/2=P-.
Proof: To see that a solution of (4.20) always exists and that it is unique,
assume m
n
=0 at a point t. Then, since P(t)>c(t)+
γ
ψ
)(t
s
and q(P)=0,
Proposition 4.4. Let be determined by (4.18), c by (4,11) and dynamic
170 4 MODELING IN AN INTERTEMPORAL FRAMEWORK
4.2 INTERTEMPORAL PRODUCTION/PRICING COMPETITION 171
0),2( >++ tmcq
s
n
γψ
, while the second term in the second equation of
(4.20) is zero.
Using notation of f(m
n
) for the left-hand side of the second equation of
(4.20), we find that
0
),(
),()( >
∂
++∂
+++=
p
tmcq
mtmcqmf
s
n
n
s
nn
γψ
γψ
,
when m
n
=0. On the other hand, by letting c+2m
n
+
γ
ψ
s
=P and accounting
for the fact that q(P,t)=0, m
n
=(P-c-
γ
ψ
s
)/2>0 and that as a result, the second
term of the second equation of (4.20) is strictly negative, we observe that
0)( <
n
mf
. Consequently, taking into account that
0
)(
<
∂
∂
n
n
m
mf
, we
conclude that the solution of f(m
n
)=0 is unique and meets the following
condition
0<m
n
<(P-c-
γ
ψ
s
)/2.
Finally, requiring m
n
≥ -
γ
ψ
s
and (P-c-
γ
ψ
s
)/2>-
γ
ψ
s
, i.e., min{P-c,} ≥
-
γ
ψ
s
, we readily verify that the first equation of (4.20), w=c+m+
γ
ψ
s
,
always has a unique feasible solution as well.
Although, the condition min{P-c,}
≥
-
γ
ψ
s
for the Nash equilibrium is
stated in terms of the co-state variable, a sufficient condition can be obtained
by assuming the maximum value for the demand q(c, t), i.e.,
min{P(t)-c(t),(t)}
≥
∫
T
t
dsscq ),(
γ
.
Note that if c is not replaced with its expression (4.11), then the solution
of system (4.20) at time t becomes a function of state variable c, and
accordingly can be viewed as closed loop Nash equilibrium.
We next show that similar to the centralized supply chain, a pricing
trajectory with respect to the wholesale price and retailer’s margin under
intertemporal competition is monotonous if the demand time pattern is
monotonous. In contrast to the centralized system, where the price p*
barely matters and the only requirement for w and m is w+m= p*, the
competition induces not only higher pricing, but also the same rate of
change of the margins,
mw
&&
=
. This is shown in the following proposition
assuming that conditions of Propositions 4.2 and 4.4. hold.
Proposition 4.5. In the differential pricing game, if the supply chain is pro-
fitable, and there is a demand time pattern q(p,t) such that
t
tpq
∂
∂ ),(
exists,
then the supplier’s wholesale price and the retailer’s margin
monotonically increase at the same rate as long as 0
),(
>
∂
∂
t
tpq
, and they
decrease as long as
0
),(
<
∂
∂
t
tpq
. If
t
tpq
∂
∂ ),(
=0 at an interval of time, then
the Nash equilibrium does not depend on time at the interval.
Proof: Differentiating both equations of (4.20), we have
mw
&&
=
,
p
tpq
m
tp
tpq
m
p
tpq
mm
p
tpq
t
tpq
∂
∂
+
∂∂
∂
+
∂
∂
+
∂
∂
+
∂
∂ ),(
]
),(
2
),(
[2
),(),(
2
2
2
&&&
=0
and thus
t
tpq
p
tpq
m
p
tpq
m
∂
∂
−=
∂
∂
+
∂
∂ ),(
]
),(
2
),(
3[
2
2
&
tp
tpq
m
∂∂
∂
−
),(
2
. (4.22)
Taking into account
0<
∂
∂
p
q
,
0
2
2
≤
∂
∂
p
q
and
mw
&&
=
, we observe mono-
tonous evolution similar to that obtained for centralized pricing, but with
respect to the wholesale price and the retailer’s margin.
We next illustrate the results with linear in price demand, q(p,t)=a(t)-bp,
and the demand potential a(t) first being an arbitrary function of time.
Then we plot the solutions for specific supply chain parameters.
Example 4.1.
Let the demand be linear in price with time-dependent customer demand
potential a(t), q(p,t)=a(t)-bp, a>bC. Since the demand requirements,
b
p
q
−=
∂
∂
<0 and
0
2
2
=
∂
∂
p
q
are met for the selected function, we employ
Proposition 4.4 to solve system (4.20), which, for the linear demand, takes
the following form:
nn
bmmcba −++− )2(
ψγ
=0 , (4.23)
w
n
=c+m
n
+
ψγ
. (4.24)
Using equation (4.22) or, equivalently, by differentiating (4.23) and (4.24)
we have
b
a
mw
nn
3
&
&&
==
and
b
ta
b
Ta
Tmtm
nn
3
)(
3
)(
)()( +−=
,
b
ta
b
Ta
Twtw
nn
3
)(
3
)(
)()( +−=
.
172 4 MODELING IN AN INTERTEMPORAL FRAMEWORK