an introduction to credit risk modeling phần 7 pot
Bạn đang xem bản rút gọn của tài liệu. Xem và tải ngay bản đầy đủ của tài liệu tại đây (5.17 MB, 28 trang )
5.2.2CapitalAllocationw.r.t.Value-at-Risk
CalculatingriskcontributionsassociatedwiththeVaRriskmeasure
isanaturalbutdifficultattempt,sinceingeneralthequantilefunc-
tionwillnotbedifferentiablewithrespecttotheassetweights.Under
certaincontinuityassumptionsonthejointdensityfunctionoftheran-
domvariablesX
i
,differentiationofVaR
α
(X),whereX=
i
w
i
X
i
,is
guaranteed.Onehas(see[122])
∂VaR
α
∂w
i
(X)=E[X
i
|X=VaR
α
(X)].(5.1)
Unfortunately,thedistributionoftheportfoliolossL=
w
i
ˆ
L
i
,as
specifiedatthebeginningofthischapter,ispurelydiscontinuous.
ThereforethederivativesofVaR
α
intheabovesensewilleithernot
existorvanishtozero.Inthiscasewecouldstilldefineriskcontribu-
tionsviatheright-hand-sideofEquation(5.1)bywriting
γ
i
=E[
ˆ
L
i
|L=VaR
α
(L)]−E[
ˆ
L
i
].(5.2)
Foraclearerunderstanding,notethat
∂E[L]
∂w
i
=E[
ˆ
L
i
]and
m
i=1
w
i
γ
i
=EC
VaR
α
.
Additionallyobserve,thatforalargeportfolioandonanappropriate
scale,thedistributionofLwillappeartobe“closetocontinuous”.
Unfortunately,eveninsuch“approximatelygood”cases,thelossdis-
tributionoftenisnotgiveninananalyticalforminordertoallowfor
differentiations.
RemarkFortheCreditRisk
+
model,ananalyticalformoftheloss
distributioncanbefound;seeSection2.4.2andChapter4foradis-
cussionofCreditRisk
+
.Tasche[121]showedthatintheCreditRisk
+
framework the VaR contributions can be determined by calculating
thecorrespondinglossdistributionsseveraltimeswithdifferentpa-
rameters.Martinetal.[82]suggestedanapproximationtothepartial
derivatives of VaR via the so-called saddle point method.
Capital allocation based on VaR is not really satisfying, because in
general, although (RC
i
)
i=1, ,m
might be a reasonable partition of the
portfolio’s standard deviation, it does not really say much about the
©2003 CRC Press LLC
tailriskscapturedbythequantileonwhichVaR-ECisrelying.Evenif
ingeneraloneviewscapitalallocationbymeansofpartialderivatives
asuseful,theproblemremainsthatthevar/covarapproachcompletely
neglectsthedependenceofthequantileoncorrelations.Forexample,
var/covarimplicitelyassumes
∂VaR
α
(X)
∂UL
PF
=const=CM
α
,
forthespecifiedconfidencelevelα.Thisistruefor(multivariate)nor-
maldistributions,butgenerallynotthecaseforlossdistributionsof
creditportfolios.Asaconsequenceitcanhappenthattransactions
requireacontributoryECexceedingtheoriginalexposureofthecon-
sideredtransaction.Thiseffectisveryunpleasant.Thereforewenow
turntoexpectedshortfall-basedECinsteadofVaR-basedEC.
5.2.3CapitalAllocationsw.r.t.ExpectedShortfall
Atthebeginningwemustadmitthatshortfall-basedriskcontri-
butionsbearthesame“technical”difficultyasVaR-basedmeasures,
namelythequantilefunctionisnotdifferentiableingeneral.But,we
findinTasche[122]thatiftheunderlyinglossdistributionis“sufficiently
smooth”, then TC E
α
is partially differentiable with respect to the ex-
posure weights. One finds that
∂TCE
α
∂w
i
(X) = E[X
i
| X ≥ VaR
α
(X)].
In case the partial derivatives do not exist, one again can rely on the
right-hand side of the above equation by defining shortfall contributions
for, e.g., discontinuous p ortfolio loss variables L =
w
i
ˆ
L
i
by
ζ
i
= E[
ˆ
L
i
| L ≥ VaR
α
(L)] −E[
ˆ
L
i
] , (5. 3)
which is consistent with expected shortfall as an “almost coherent” risk
measure. Analogous to what we saw in case of VaR-EC, we can write
m
i=1
w
i
ζ
i
= EC
TCE
α
,
such that shortfall-based EC can be obtained as a weighted sum of the
corresponding contributions.
©2003 CRC Press LLC
RemarksWithexpectedshortfallwehaveidentifiedacoherent(or
closetocoherent)riskmeasure,whichovercomesthemajordrawbacks
ofclassicalVaRapproaches.Furthermore,shortfall-basedmeasures
allowforaconsistentdefinitionofriskcontributions.Wecontinue
withsomefurtherremarks:
•Theresultsonshortfallcontributionstogetherwiththefindings
ondifferentiabilityin[105]indicatethattheproposedcapitalallo-
cation ζ
i
canbeusedasaperformancemeasure,aspointedoutin
Theorem4.4in[122],forexample.Inparticular,itshowsthatifone
increases the exposure to a counterparty having a RAROC ab ove
portfolio RAROC, the portfolio RAROC will be improved. Here
RAROC is defined as the return over (contributory) economic
capital.
• We obtain ζ
i
<
ˆ
L
i
, i.e., by construction the capital is always less
than the exposure, a feature that is not shared by risk contribu-
tions defined in terms of covariances.
• Shortfall contributions provide a simple “first-order” statistics of
the distribution of L
i
conditional on L > c. Other statistics
like conditional variance could be useful. (We do not know if
conditional variance is coherent under all circumstances.)
• The definition of shortfall contributions reflects a causality rela-
tion. If counterparty i contributes higher to the overall loss than
counterparty j in extreme loss scenarios, then, as a consequence,
business with i should be more costly (assuming stand-alone risk
characteristics are the same).
• Since L, L
i
≥ 0, capital allocation rules according to shortfall
contributions can easily be extended to the space of all coherent
risk measures as defined in this chapter
5.2.4 A Simulation Study
In the simulation study we want to compare the two different alloca-
tion techniques, namely allocation based on VaR and allocation based
on expected shortfall. We first tested it on a transaction base. In a
subsequent test case we considered the allocation of capital to business
units. There are at least two reasons justifying the efforts for the sec-
ond test. First it might not be reasonable to allocate economic capital
©2003 CRC Press LLC
thatisbasedonextremelosssituationstoasingletransaction,since
theriskinasingletransactionmightbedrivenbyshort-termvolatility
andnotbythelong-termviewofextremerisks.Thesecondreason
ismoredrivenbythecomputationalfeasibilityofexpectedshortfall.
Inthe“binaryworld”ofdefaultsimulations,toomanysimulations
arenecessaryinordertoobtainapositivecontributionconditionalon
extremedefaulteventsforallcounterparties.
Thebasicresultofthesimulationstudyisthatanalyticcontributions
produceasteepergradientbetweenriskyandlessriskyloansthantail
riskcontributions.Inparticular,loanswithahighdefaultprobabil-
itybutmoderateexposureconcentrationrequiremorecapitalinthe
analyticcontributionmethod,whereasloanswithhighconcentration
requirerelativelymorecapitalintheshortfallcontributionmethod.
TransactionViewThefirstsimulationstudyisbasedonacredit
portfolioconsideredindetailin[105].Theparticularportfolioconsists
of40counterparties.
Ascapitaldefinition,the99%quantileofthelossdistributionisused.
WithintheMonte-Carlosimulationitisstraightforwardtoevaluaterisk
contributionsbasedonexpectedshortfall.Theresultingriskcontribu-
tionsanditscomparisontotheanalyticallycalculatedriskcontribu-
tionsbasedonthevolatilitydecompositionareshowsinFigure5.2.
In the present portfolio example the difference between the contrib-
utory capital of two different types, namely analytic risk contributions
and contributions to shortfall, should be noticed, since even the order
of the ass ets according to their risk contributions changed. The asset
with the largest shortfall contribution is the one with the second largest
var/covar risk c ontribution, and the largest var/vovar risk contribution
goes with the second largest shortfall contribution. A review of the
portfolio shows that the shortfall contributions are more driven by the
relative asset size. However, it is always important to bear in mind
that these results are still tied to the given portfolio.
It should also be noticed that the gradient of the EC is steep er for the
analytic approach. Bad loans might be able to breech the hurdle rate in
a RAROC-Pricing tool if one uses the expected shortfall approach, but
might fail to earn ab ove the hurdle rate if EC is based on var/covar.
Business Unit View The calculation of expected shortfall contri-
butions requires a lot more computational power, which makes it less
©2003 CRC Press LLC
FIGURE 5.2
The bar chart depicts the different risk contributions for ev-
ery counterparty in the portfolio. The dark bars belong
to the counterparty contribution measured by the short-
fall; the white ones correspond to the analytic Var/Covar-
contribution.
0
5
10
15
20
25
30
35
40
0
10
20
30
40
50
60
counterparty
contributory capital
©2003 CRC Press LLC
feasibleforlargeportfolios.However,thecapitalallocationonthebusi-
nesslevelcanaccuratelybemeasuredbymeansofexpectedshortfall
contributions.Figure5.3showsanexampleofabankwith6busi-
ness units. Again we see that expected shortfall allocation differs from
var/covar allocation.
Under var/covar, it sometime s can even happen that the capital al-
located to a business unit is larger if considered consolidated with the
bank than capitalized standalone. This again shows the non-coherency
of VaR measures. Such effects are very unpleasant and can lead to
significant misallocations of capital. Here, expected shortfall provides
the superior way of capital allocation. We conclude this chapter by a
simple remark how one can calculated EC on VaR-basis but allocate
capital shorfall-based.
If a bank calculates its total EC by means of VaR, it still can allocate
capital in a coherent way. For this purpose, one just has to determine
some threshold c < VaR
α
such that
EC
TCE
(c) ≈ EC
VaR
α
.
This VaR-matched expected shortfall is a coherent risk measure pre-
serving the VaR-based overall economic capital. It can be viewed as
an approximation to VaR-EC by considering the whole tail of the loss
distribution, starting at som e threshold below the quantile, such that
the resulting mean value matches the quantile. Proceeding in this way,
allocation of the total VaR-based EC to business units will reflect the
coherency of shortfall-based risk measures.
©2003 CRC Press LLC
FIGURE 5.3
The bar charts depict the different risk contributions (top:
99% quantile, bottom: 99.9% quantile) of the business areas of
a bank. The black bars are based on a Var/Covar approach;
the white ones correspond to shortfall risk.
0 1 2 3 4 5 6 7
0
0.5
1
1.5
2
2.5
3
3.5
4
4.5
business area
contributory EC in % of exposure
Q
99%
0 1 2 3 4 5 6 7
0
1
2
3
4
5
6
7
8
9
10
business area
contributory EC in % of exposure
Q
99.9%
©2003 CRC Press LLC
Chapter6
TermStructureofDefault
Probability
Sofar,defaulthasmostlybeenmodeledasabinaryevent(except
theintensitymodel),suitedforsingle-periodconsiderationswithinthe
regulatoryframeworkofafixedplanninghorizon.However,thechoice
ofaspecificperiodlikeoneyearismoreorlessarbitrary.Evenmore,
defaultisaninherentlytime-dependentevent.Thischapterservesto
introducetheideaofatermstructureofdefaultprobability.This
creditcurverepresentsanecessaryprerequisiteforatime-dependent
modelingasinChapters7and8.Inprinciple,therearethreedifferent
methodstoobtainacreditcurve:fromhistoricaldefaultinformation,
asimpliedprobabilitiesfrommarketspreadsofdefaultablebonds,and
throughMerton’soptiontheoreticapproach.Thelatterhasalready
beentreatedinapreviouschapter,butbeforeintroducingtheother
twoinmoredetailwefirstlayoutsometerminologyusedinsurvival
analysis(see[15,16]foramoreelaboratedpresentation).
6.1 Survival Function and Hazard Rate
For any model of default timing, le t S(t) denote the probability of
surviving until t. With help of the “time-until-default” τ (or briefly
“default time”), a continuous random variable, the survival function
S(t) can be written as
S(t) = P[τ > t], t ≥ 0 .
That is, starting at time t = 0 and presuming no information is avail-
able about the future prospects for survival of a firm, S(t) measures the
likelihood that it will survive until time t. The probability of default
between time s and t ≥ s is simply S(s) −S(t). In particular, if s = 0,
©2003 CRC Press LLC
and because S(0) = 1, then the probability of default F(t) is
F (t) = 1 −S(t) = P[τ ≤ t], t ≥ 0. (6. 1)
F (t) is the distribution function of the random default time τ . The
corresponding probability density function is defined by
f(t) = F
(t) = −S
(t) = lim
∆→0
+
P[t ≤ τ < t + ∆]
∆
,
if the limit exists. Furthermore, we intro duce the conditional or forward
default probability
p(t|s) = P[τ ≤ t|τ > s], t ≥ s ≥ 0 ,
i.e., the probability of default of a certain obligor between t and s
conditional on its survival up to time s, and
q(t|s) = 1 − p(t|s) = P[τ > t|τ > s] = S(t)/S(s), t ≥ s ≥ 0,
the forward survival probability. An alternative way of characterizing
the distribution of the default time τ is the hazard function, which
gives the instantaneous probability of default at time t conditional on
the survival up to t. The hazard function is defined via
P[t < τ ≤ t + ∆t|τ > t] =
F (t + δt) −F(t)
1 −F(t)
≈
f(t)∆t
1 −F(t)
as
h(t) =
f(t)
1 −F(t)
.
Equation(6. 1) yields
h(t) =
f(t)
1 −F(t)
= −
S
(t)
S(t)
,
and solving this differential equation in S(t) results in
S(t) = e
−
t
0
h(s)ds
. (6. 2)
This allows us to express q(t|s) and p(t|s) as
q(t|s) = e
−
t
s
h(u)du
, (6. 3)
p(t|s) = 1 − e
−
t
s
h(u)du
. (6. 4)
©2003 CRC Press LLC
Additionally,weobtain
F(t)=1−S(t)=1−e
−
t
0
h(s)ds
,
and
f(t)=S(t)h(t).
Onecouldassumethehazardratetobepiecewiseconstant,i.e.,h(t)=
h
i
fort
i
≤t<t
i+1
.Inthiscase,itfollowsthatthedensityfunctionof
τis
f(t)=h
i
e
−h
i
t
1
[t
i
,t
i+1
[
(t),
showingthatthesurvivaltimeisexponentiallydistributedwithpa-
rameterh
i
.Furthermore,thisassumptionentailsoverthetimeinterval
[t
i
,t
i+1
[for0<t
i
≤t<t
i+1
q(t|t
i
)=e
−
t
t
i
h(u)du
=e
−h
i
(t−t
i
)
.
RemarkThe“forwarddefaultrate”h(t)asabasisofadefaultrisk
termstructureisincloseanalogytoaforwardinterestrate,withzero-
couponbondpricescorrespondingtosurvivalprobabilities.Thehazard
ratefunctionusedtocharacterizethedistributionofsurvivaltimecan
alsobecalleda“creditcurve”duetoitssimilaritytoayieldcurve.Ifh
iscontinuousthenh(t)∆tisapproximatelyequaltotheprobabilityof
defaultbetweentandt+∆t,conditionalonsurvivaltot.Understand-
ingthefirstarrivaltimeτasassociatedwithaPoissonarrivalprocess,
theconstantmeanarrivalratehisthencalledintensityandoftende-
notedbyλ
1
.Changingfromadeterministicallyvaryingintensityto
randomvariation,andthusclosingthelinktothestochasticintensity
models[32],turnsEquation(6.3)into
q(t|s) = E
s
e
−
t
s
h(u)du
,
where E
s
denotes expectation given all information available at time s.
1
Note that some authors explicitly distinguish between the intensity λ(t) as the arrival rate
of default at t conditional on all information available at t, and the forward default rate
h(t) as arrival rate of default at t, conditional only on survival until t.
©2003 CRC Press LLC
6.2 Risk-neutral vs. Actual Default Probabilities
When estimating the risk and the value of credit-related se curities we
are faced with the question of the appropriate probability measure, risk-
neutral or objective probabilities. But in fact the answer depends on the
objective we have. If one is interested in estimating the economic capi-
tal and risk charges, one adopts an actuarial-like approach by choosing
historical probabilities as underlying probability measure. In this case
we assume that actual default rates from historical information allow
us to estimate a capital quota protecting us against losses in worst case
default scenarios. The objective is different when it comes to pricing
and hedging of credit-related securities. Here we have to model under
the risk-neutral probability measure. In a risk-neutral world all indi-
viduals are indifferent to risk. They require no compensation for risk,
and the expected return on all securities is the risk-free interest rate.
This general principle in option pricing theory is known as risk-neutral
valuation and states that it is valid to assume the world is risk-neutral
when pricing options. The resulting option prices are correct not only
in the risk-neutral world, but in the real world as well. In the credit risk
context, risk-neutrality is achieved by calibrating the default probabil-
ities of individual credits with the market-implied probabilities drawn
from bond or credit default swap spreads. The difference between ac-
tual and risk-neutral probabilities reflects risk-premiums required by
market participants to take risks. To illustrate this difference suppose
we are pricing a one-year par bond that promises its face value 100
and a 7% coupon at maturity. The one- year risk-free interest rate is
5%. The actual survival probability for one year is 1 −DP = 0.99; so,
if the issuer survives, the investor rece ives 107. On the other hand,
if the issuer defaults, with actual probability DP = 0.01, the investor
recovers 50% of the par value. Simply discounting the expected payoff
computed with the actual default probability leads to
(107 ×0.99 + 50% ×100 × 0.01)
1 + 5%
= 101.36 ,
which clearly overstates the price of this security. In the above example
we have implicitly adopted an actuarial approach by assuming that the
price the investor is to pay should exactly off set the expected loss due
to a possible default. Instead, it is natural to assume that investors
©2003 CRC Press LLC
areconcernedaboutdefaultriskandhaveanaversiontobearingmore
risk.Hence,theydemandanadditionalriskpremiumandthepricing
shouldsomehowaccountforthisriskaversion.Wethereforeturnthe
abovepricingformulaaroundandaskwhichprobabilityresultsinthe
quotedprice,giventhecoupons,therisk-freerate,andtherecovery
value.Accordingtotherisk-neutralvaluationparadigm,thefactthat
thesecurityispricedatparimpliesthat
100=
(107×(1−DP
∗
)+50%×100×DP
∗
)
1+5%
.
Solvingforthemarket-impliedrisk-neutraldefaultprobabilityyields
DP
∗
=0.0351.NotethattheactualdefaultprobabilityDP=0.01
islessthanDP
∗
.Equivalently,wecansaythatthebondispricedas
thoughitwereabreak-eventradefora“stand-in”investorwhoisnot
riskadversebutassumesadefaultprobabilityof0.0351.Thedifference
betweenDPandDP
∗
reflectstheriskpremiumfordefaulttimingrisk.
Mostcreditmarketparticipantsthinkintermsofspreadsratherthanin
termsofdefaultprobabilities,andanalyzetheshapeandmovements
ofthespreadcurveratherthanthechangeindefaultprobabilities.
And,indeed,thelinkbetweencreditspreadandprobabilityofdefault
isafundamentalone,andisanalogoustothelinkbetweeninterest
ratesanddiscountfactorsinfixedincomemarkets.Ifsrepresentsa
multiplicativespreadovertherisk-freerateonegets
DP
∗
=
1−
1
1+s
1−REC
≈
s
1−REC
,
wheretheapproximationisalsovalidforadditivespreads.
“Actuarialcreditspreads”arethoseimpliedbyassumingthatin-
vestorsareneutraltorisk,andusehistoricaldatatoestimatedefault
probabilitiesandexpectedrecoveries.DatafromFons[43]suggestthat
corporate yield spreads are much larger than the spreads suggested by
actuarial default losses alone. For example, actuarially implied credit
spreads on a A-rated 5-year US corporate debt were estimated by Fons
to be six basis points. The corresponding market spreads have been in
the order of 100 basis points. Clearly, there is more than default risk
behind the difference between “actuarial credit spreads” and actual
yield spreads, like liquidity risk, tax-related issues, etc. But even after
measuring spreads relative to AAA yields (thereby stripping out trea-
sury effects), actuarial credit spreads are smaller than actual market
spreads, especially for high-quality bonds.
©2003 CRC Press LLC
6.3 Term Structure Based on Historical Default Infor-
mation
Multi-year default probabilities can be extracted from historical data
on corporate defaults similarly to the one-year default probabilities.
But before going into details we first show a “quick and dirty” way to
produce a whole term structure if only one-year default probabilities
are at hand.
6.3.1 Exponential Term Structure
The derivation of exponential default probability term s tructure is
based on the idea that credit dynamics can be viewed as a two-state
time-homogeneous Markov-chain, the two states being survival and de-
fault, and the unit time between two time steps being ∆. Suppose a
default probability DP
T
for a time interval T (e.g., one year) has been
calibrated from data; then the survival probability for the time unit ∆
(e.g., one day) is given by
P[τ > t + ∆|τ ≥ t] = (1 −DP
T
)
∆/T
, (6. 5)
and the default probability for the time t, in units of ∆, is then
DP
t
= 1 − (1 −DP
T
)
t/T
. (6. 6)
In the language of survival analysis we can write for the probability of
survival until T
1 −DP
T
= q(T |0) = e
−
T
0
h(u)du
= e
−
¯
hT
,
where the last equation defines the average default rate
¯
h,
¯
h = −log (1 − DP
T
) /T.
Assuming a constant default rate over the whole life time of the debt,
Equation (6. 6) reads
F (t) = q(t|0) = 1 − p(t|0) = 1 − e
−
¯
ht
.
©2003 CRC Press LLC
6.3.2DirectCalibrationofMulti-YearDefaultProbabilities
Ratingagenciesalsoprovidedataonmulti-yeardefaultratesintheir
reports.Forexample,Moody’s[95]trailingT+1-monthdefaultrates
for month t and rating universe k are defined as
D
k,t
=
t
i=t−T
Y
k,i
I
k,t−11
. (6. 7)
k, for example, could be all corporate issuers, US speculative grade
issuers, or Ba-rated issuers in the telecom sector. The numerator is the
sum of defaulters, Y , in month t that were in the rating universe k as
of t − T . The denominator, I
k,t
, is the number of issuers left in the
rating universe k in month t − T , adjusted to reflect the withdrawal
from the market of some of those issuers for noncredit-related reasons
(e.g., maturity of debt). The adjustment for withdrawal is important
because the denominator is intended to represent the number of issuers
who could potentially have defaulted in the subsequent T + 1-month
period. Underlying Equation (6. 7) is the assumption that defaults
in a given rating universe are independent and identically distributed
Bernoulli random variables, i.e., the number of defaults w.r.t. a certain
pool, rating, and year follow a binomial distribution. Note that this
assumption is certainly not correct in a strict sense; in fact, correlated
defaults are the core issue of credit p ortfolio models.
Moody’s employs a dynamic cohort approach to calculating multi-
year default rates. A cohort consists of all issuers holding a given
estimated senior rating at the start of a given year. These issuers are
then followed through time, keeping track of when they default or leave
the universe for noncredit-related reasons. For each cumulation period,
default rates based on dynamic cohorts express the ratio of issuers who
did default to issuers who were in the position to default over that time
period. In terms of Equation (6. 7) above, this constitutes lengthening
the time horizon T (T = 11 in the case of one-year default rates). Since
more and more companies become rated over the years, Moody’s and
S&P use an issuer weighted average to averaged cumulative default
rates. To estimate the average risk of default over time horizons longer
than one year, Moody’s calculates the risk of default in each year since
a cohort was formed. The issuer-weighted average of each c ohort’s one-
year default rate forms the average cumulative one-year default rate.
The issuer-weighted average of the sec ond-year (marginal) default rates
(default in exactly the second year) cumulated with that of the first year
©2003 CRC Press LLC
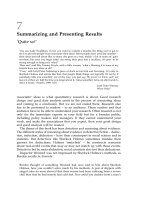
FIGURE6.1
CumulativedefaultrateforA-ratedissuer.Weightedaverage
defaultratessmootheconomiccycleseffectsonindividualco-
horts,from[95].
yieldsthetwo-yearaveragecumulativedefaultrate,andsoon.Figure
6.1showshowdifferentcohortsproduceadifferentcredithistoryin
responsetodifferenteconomicandmarketconditions.
Table6.1givestheaveragecumulativedefaultratesasreportedby
Moody’s[95].Acloserlookrevealssomeunpleasantfeaturesinthis
table.Forexample,onewouldexpectcolumnmonotonyforeachyear,
i.e.,highcreditqualityshouldnevershowahigherdefaultratethanlow
creditquality,whichisviolatedatvariousentries.Furthermore,some
marginaldefaultratesarezero,evenfornon-tripleAratedcorporates,
whichisunrealistic.Clearly,theseproblemsstemfromalackofsuffi-
cientdataforareliablestatisticalanalysis,and,obviously,poolingon
amoreaggregatedlevelproducesmoresatisfactoryresultsw.r.t.these
plausibilityconditions;seeTable6.2.Inthenextsectionweshowa
way to avoid these deficiencies by use of migration analysis.
One can argue that the issuer-weighted arithmetic mean is perhaps
not the right thing to do. Since more and more corporates are rated
during the last years, issuer-weighted averaging means that recent years
©2003 CRC Press LLC
TABLE 6.1: Averagecumulativedefaultfrom1to10years–1983-2000,from[95].
©2003 CRC Press LLC
TABLE 6.2: Averagecumulativedefaultbyletterratingfrom1to10years–
1970-2000, from [95].
©2003 CRC Press LLC
havemuchmoreimpactthanyearsfurtherbackinhistoryandthere-
sultdoesnotreflectatypicalyearasaveragedovereconomiccycles.
Havingnowextractedcumulativedefaultprobabilitiesatdiscrete
pointsintime,DP
i
,wemightbeinterestedinacontinuousversion
ofthistermstructure.Thesimplestanswerisanadroitlinearinter-
polationofthemulti-yeardefaultprobabilitytable(theinterpolation
betweenratingclassesoughttobedoneonalogarithmicscale).
Aslightlymoresophisticatedmethodcanbeformulatedwiththe
helpoftheforwarddefaultrateh.Theforwarddefaultprobability
betweent
i
andt
i+1
isgivenby
p(t
i+1
|t
i
)=
DP
i+1
−DP
i
1−DP
i
=1−exp
−
t
i+1
t
i
h(u)du
.
NotethatDP
i
=F(t
i
).Defineforthetimeinterval[t
i
,t
i+1
]anaverage
forwarddefaultrateby
¯
h
i
=
1
t
i+1
−t
i
t
i+1
t
i
h(u)du,fori=0, ,n.
Intermsofthemulti-yeardefaultprobabilitiestheforwarddefaultrate
forperiodiis
¯
h
i
=−
1
t
i+1
−t
i
log
1−DP
i+1
1−DP
i
.
Twohazardratefunctionsobtainedfromthemulti-yeardefaultprob-
abilitiesinTable6.2aredepictedinFigure6.2andshowatypical
feature: investment grade securities tend to have an upward sloping
hazard rate term structure, whereas speculative grades tend to have a
downward sloping term structure.
The cumulative default probability until time t, t
i
≤ t < t
i+1
boils
down to
DP
t
= F (t) = 1 − q(t
i
|0)q(t|t
i
)
= 1 − (1 −DP
i
)
1 −DP
i+1
1 −DP
i
(t−t
i
)/(t
i+1
−t
i
)
.
For 0 < t < 1 we obtain again the exponential term structure. For
t > t
n
the term structure can be extrapolated by assuming a constant
forward default rate
¯
h
n−1
beyond t
n−1
,
DP
t
= 1 − (1 −DP
n−1
)
1 −DP
n
1 −DP
n−1
(t−t
n
)/(t
i+1
−t
i
)
.
©2003 CRC Press LLC
FIGURE6.2
HazardratefunctionsforratingsAandB,calculatedfrom
Moody’scumulativedefaultrates.
6.3.3MigrationTechniqueandQ-Matrices
ThereliabilityofthedefaultfrequenciesreportedinTable6.1strongly
depends on the quality of the underlying data. In the previous section
we pointed out that the amount of data used for the calibration de-
creases with increasing time horizon. As a consequence, the quality
of the calibration suffers from a lack of sufficient data for a reliable
statistical analysis, especially at larger time horizons. For this reason,
we now discuss a different approach to multi-year default probabilities,
whose key idea is the use of migration analysis.
According to migration frequency tables reported by Moody’s, S&P,
and other rating agencies it is quite likely that corporates experience
changes in credit quality over the years. This phenomenon is called
credit migration, and the likelihoods of transitions from a given rating
category to another are collected in migration matrices.
The migration technique can best be treated within the mathemat-
ical framework of Markov chains, i.e., we assume the existence of a
credit migration process controlled solely by the transition probabili-
ties given in the one-year migration matrix. More precisely, we define
the finite state space of the chain covering possible bond ratings, e.g.,
©2003 CRC Press LLC
Ω={AAA,AA,A,BBB,BB,B,CCC,Default}andassigntoevery
pair(i,j)ofstatesatransitionormigrationprobability
m
ij
=P[i→j](i=1, ,7;j=1, ,8),
whereP[i→j]denotestheprobabilityofchangefromratingclassiat
thebeginningofayeartoratingclassjatyear’send.Inthepresent
contexttheMarkovpropertyrepresentstheassumptionthattheevo-
lutionofcreditmigrationisindependentofthepastcreditmigration
history.Throughthehomogeneityweassumethemigrationratestobe
independentoftime,i.e.,theprobabilityofaone-yearmigrationi→j
doesnotdependontheconsideredyear.
RemarkClearly,boththeassumptionsoftime-homogeneityandof
theMarkovpropertyareverylikelynotpreciselytrueforrealcredit
ratingsandinfactopentovividdebate.Wedonotconsidersuchissues
here,butratherrelyonthesimplifiedassumptions.
Nowwecollectthemigrationprobabilitiesintoaone-yearmigration
(ortransition)matrixM=(m
ij
)
i,j=1, ,8
wherethe8-throwisgiven
bythevector(0,0,0,0,0,0,0,1).ThefollowingpropertiesofMfollow
immediately:
(i)Mhasonlynonnegativeentries:m
ij
≥0fori,j=1, ,8.
(ii)AllrowsumsofMareequalto1:
8
j=1
m
ij
=1fori=1, ,8.
(iii)Thelastcolumncontainsthe1-yeardefaultprobabilities:m
i,8
=
PD(1,i)fori=1, ,7.
(iv)Thedefaultstateisabsorbing:m
8,j
=0forj=1, ,7,and
m
8,8
=1.
Thismeansthatthereisnoescapefromthedefaultstate.
Ratingagenciespublishtransitionmatricesforone,two,ormoreyears,
usuallywithanadditionalcolumnrepresentingtheno-longerrated
debts.Sincethisprimarilyoccurswhenacompany’soutstandingdebt
issueexpires,thisportionistypicallydistributedalongtherowspro-
portionallytotheprobabilityweightsintheratedstates.Moody’s
averageone-yearmigrationmatrix[95],forexample,is
©2003 CRC Press LLC
Aaa Aa A Baa Ba B C Default W R
Aaa 0.8617 0.0945 0.0102 0.0000 0.0003 0.0000 0.0000 0.0000 0.0333
Aa
0.0110 0.8605 0.0893 0.0031 0.0011 0.0001 0.0000 0.0003 00346
A
0.0006 0.0285 0.8675 0.0558 0.0066 0.0017 0.0001 0.0001 0.0391
Baa
0.0006 0.0034 0.0664 0.8100 0.0552 0.0097 0.0008 0.0016 0.0523
Ba
0.0003 0.0006 0.0054 0.0546 0.7550 00818 0.0053 0.0132 0.0838
B
0.0001 0.0004 0.0020 0.0056 0.0592 0.7593 0.0303 0.0641 0.0790
C
0.0000 0.0000 0.0000 0.0087 0.0261 0.0562 0.5701 0.2531 0.0858
and reads after adjustment for rating withdrawal
M
Moody
s
=
Aaa Aa A Baa Ba B C D
Aaa 0.8914 0.0978 0.0106 0.0000 0.0003 0.0000 0.0000 0.0000
Aa
0.0114 0.8913 0.0925 0.0032 0.0011 0.0001 0.0000 0.0003
A
0.0006 0.0297 0.9028 0.0581 0.0069 0.0018 0.0001 0.0001
Baa
0.0006 0.0036 0.0701 0.8547 0.0582 0.0102 0.0008 0.0017
Ba
0.0003 0.0007 0.0059 0.0596 0.8241 0.0893 0.0058 0.0144
B
0.0001 0.0004 0.0022 0.0061 0.0643 0.8244 0.0329 0.0696
C
0.0000 0.0000 0.0000 0.0095 0.0285 0.0615 0.6236 0.2769
D
0 0 0 0 0 0 0 1
.
A useful consequence of the Markovian property and the time-homo-
geneity is the fact that the n-year transition matrix is simply given by
the nth power of the one-year transition matrix,
M
n
= M
n
1
,
where again the cumulative nth year default probabilities for a rating
class is given by the last column of M
n
.
Properties (i), (ii) make M a stochastic matrix. Furthermore, one might
want to impose the following plausibility constraints to reflect our in-
tuition.
(v) Low-risk states should never show a higher default probability
than high-risk states, i.e., M
i8
≤ M
i+1 8
, i = 1, . . . , 7.
(vi) It should be more likely to migrate to closer states than to more
distant states (row monotony towards the diagonal),
M
ii+1
≥ M
ii+2
≥ M
ii+3
. . .
M
ii−1
≥ M
ii−2
≥ M
ii−3
. . .
©2003 CRC Press LLC
(vii)Thechanceofmigrationintoacertainratingclassshouldbe
greaterformorecloselyadjacentratingcategories(columnmonotony
towardsthediagonal).
M
i+1i
≥M
i+2i
≥M
i+3i
M
i−1i
≥M
i−2i
≥M
i−3i
Insofarasalowerratingpresentsahighercreditrisk,Jarrowetal.
[64]formulatedthecondition:
(viii)
j≥k
m
ij
isanondecreasingfunctionofiforeveryfixedk,
whichisequivalenttorequiringthattheunderlyingMarkovchainbe
stochasticallymonotonic.Notethatrowandcolumnmonotonytowards
thediagonal(properties(vi)and(vii))impliesstochasticmonotonybut
notviceversa.
Theproblemwiththiswishlististhatonecannotexpecttheseprop-
erties to be satisfied by transition matrices sampled from historical
data; so, the question remains how to best match a transition ma-
trixtosampleddatabutstillfulfilltherequiredproperties.Ong[104]
proposes to solve this optimization problem, with the plausibility con-
straints stated as “soft conditions”, through a “simulated annealing”
approach, where perturbed matrices are produced through additional
random terms and tested to find an optimal solution. At this point we
do not want to dive into the vast world of multidimensional optimiza-
tion algorithms, but rather turn to another approach for obtaining a
suitable migration matrix, namely via generators.
Generator Matrix The shortest time interval from which a transi-
tion matrix is estimated is typically one year. Data quality of rating
transition observations within a shorter period is too poor to allow for
a reliable estimate of a migration matrix. Nevertheless, for valuation
purposes or loans that allow for the possibility of under-year interven-
tion we are interested in transition matrices for shorter time periods.
One might be tempted to approach this problem by fractional pow-
ers of M, but unfortunately the roots of transition matrices are not
stochastic in general nor is it clear which root to choose when more of
them exist. The idea is now to try to embed the time-discrete Markov
©2003 CRC Press LLC
chaininatime-continuousMarkovprocess,thelatterbeingtotallycon-
trolledbyitsgenerator.Collectingtheratesofmigrationinamatrix
Q,atime-dependenttransitionmatrixM(t),t≥0thensatisfiesthe
matrix-valued(backward)differentialequation
dM(t)=QM(t)dt.
UndertheboundaryconditionM(0)=I,whereIistheidentityma-
trix,theformalsolutionofthedifferentialequationisthematrixex-
ponential
M(t)=e
tQ
=
∞
k=0
(tQ)
k
k!
.(6.8)
Furthermore,thefollowingtheoremholds[102]:
6.3.1TheoremM(t)definedby(6.8)isastochasticmatrixforall
t≥0ifandonlyifQ=(q
ij
)satisfiesthefollowingproperties:
(i)0≤−q
ii
<∞foralli=1, ,8;
(ii)q
ij
≥0foralli=j;
(iii)
8
j=1
q
ij
=0foralli=1, ,8.
InMarkovchaintheorysuchmatricesarecalledQ-matricesorgenera-
tors.Unfortunately,thistheoremisnotthatmuchofahelp.Sincewe
only have a single-period transition matrix available the existence of the
true generator is not necessarily guaranteed. The problem of finding
generators for empirical transition matrices has been comprehensively
treatedbyIsraeletal.[62].Theyrediscoveredsomepreviouslyfound
results and derived some new findings. In the following we freely cite
the most useful ones for our purp ose s and refer for proofs to the liter-
ature.
Equation (6. 8), nevertheless, can give us some guidance on how to
find a valid, or at least construct an approximate, generator, i.e., the
matrix logarithm.
6.3.2Theorem([62])LetM=(m
ij
) be an n × n strictly diagonally
dominant Markov transition matrix, i.e., m
ii
> 1/2 for all i. Then the
series
˜
Q =
l
k=1
(−1)
k+1
(M − I)
k
k
©2003 CRC Press LLC
convergesgeometricallyquicklyforl→∞,andgivesrisetoann×n
matrix
˜
Qhavingrow-sumszero,suchthatexp(
˜
Q)=Mexactly.
Notethattheconditionofstrictlydiagonaldominanceisonlyasuf-
ficientone.Itisusuallysatisfiedbycreditmigrationmatrices.For
theoremsonthe(non-)existenceoftruegeneratorssee[62]andtheref-
erencestherein.Themainproblemofthelog-expansionisthatthe
matrix
˜
Qisnotguaranteedtohavenonnegativeoff-diagonalentries,
whichweneedbythefirsttheorem.However,anynegativeoff-diagonal
entriesof
˜
Qwillusuallybequitesmall.Therefore,wetrytocorrectthe
matrixsimplybyreplacingthesenegativeentriesbyzero,andredis-
tributethevaluesbysomeappropriateadhocrulestotheotherentries
topreservethepropertyofhavingvanishingrowsum,inthehopethat
thethusobtainedQ-matrixyieldsan,insomesenseclose,embedding.
OneversionistodefineaQ-matrixQfrom
˜
Qas(seealsoStromquist
[119])
q
ij
=max(˜q
ij
,0),i=j;q
ii
=˜q
ii
+
i=j
min(˜q
ij
, 0), (6. 9)
i.e., the sum of the negative off-diagonal entries is allotted in full to the
diagonal element of the respective row.
A different Q-matrix is obtained by adding the negative values back
to all entries of the same row that have the correct sign, proportional
totheirabsolutevalues(seealsoAraten[3]foracloselyrelatedalgo-
rithm), i.e., let
g
i
= |˜q
ii
| +
i=j
max(˜q
ij
, 0); b
i
=
i=j
max(−˜q
ij
, 0)
and set
ˆq
ij
=
0, i = j and ˜q
ij
< 0
˜q
ij
− b
i
|˜q
ij
|/g
i
, otherwise if g
i
> 0
˜q
ij
, otherwise if g
i
= 0.
(6. 10)
In both cases the new matrix will still have by construction row sum
zero, but now with nonnegative off-diagonals. Clearly, it will no longer
satisfy exp(Q) = M. Other, more refined “redistribution” choices are
conceivable; however, they would rarely induce substantial difference
to the distance of exp(Q) and M. Note that it is possible that a valid
generator exists even if the
˜
Q computed by the series expansion is not
a valid one. Furthermore, it may be possible that there exist more than
one valid generator for a given transition matrix M.
©2003 CRC Press LLC
AssumingthatthereisatmostonemigrationperyearJarrowetal.
[64]derivedthefollowingformulaforasuitablegenerator:
ˇq
ii
= log(m
ii
), ˇq
ij
= m
ij
log(m
ii
)/(m
ii
− 1) for i = j. (6. 11)
Let us now consider some numerical examples. From the Moo dy’s one-
year transition matrix M
Moody
s
we arrive with Equation (6. 11) at the
Q-matrix
ˇ
Q
Moody
s
=
−0.1150 0.1035 0.0112 0.0000 0.0003 0.0000 0.0000 0.0000
0.0121 −0.1150 0.0979 0.0034 0.0012 0.0001 0.0000 0.0003
0.0007 0.0312 −0.1023 0.0611 0.0072 0.0019 0.0001 0.0001
0.0007 0.0039 0.0757 −0.1570 0.0629 0.0111 0.0009 0.0018
0.0004 0.0007 0.0065 0.0655 −0.1935 0.0982 0.0064 0.0158
0.0001 0.0005 0.0024 0.0067 0.0707 −0.1930 0.0362 0.0765
0.0000 0.0000 0.0000 0.0119 0.0358 0.0771 −0.4722 0.3473
0 0 0 0 0 0 0 0
with the matrix exponential
exp(
ˇ
Q
Moody
s
) =
0.8919 0.0925 0.0146 0.0006 0.0004 0.0000 0.0000 0.0000
0.0108 0.8933 0.0882 0.0057 0.0015 0.0003 0.0000 0.0003
0.0008 0.0282 0.9063 0.0540 0.0080 0.0023 0.0002 0.0003
0.0007 0.0045 0.0670 0.8585 0.0535 0.0120 0.0010 0.0028
0.0003 0.0009 0.0079 0.0556 0.8288 0.0816 0.0060 0.0189
0.0001 0.0005 0.0026 0.0078 0.0591 0.8284 0.0262 0.0753
0.0000 0.0001 0.0006 0.0099 0.0282 0.0570 0.6247 0.2797
0.0000 0.0000 0.0000 0.0000 0.0000 0.0000 0.0000 1.0000
.
Using instead Equation (6. 10) we obtain
ˆ
Q
Moody
s
=
−0.1159 0.1095 0.0061 0.0000 0.0003 0.0000 0.0000 0.0000
0.0128 −0.1175 0.1032 0.0002 0.0009 0.0000 0.0000 0.0003
0.0005 0.0330 −0.1066 0.0660 0.0056 0.0014 0.0001 0.0000
0.0007 0.0027 0.0797 −0.1621 0.0690 0.0084 0.0007 0.0009
0.0003 0.0005 0.0039 0.0708 −0.2003 0.1082 0.0054 0.0111
0.0001 0.0004 0.0021 0.0042 0.0773 −0.1990 0.0456 0.0692
0.0000 0.0000 0.0000 0.0114 0.0359 0.0834 −0.4748 0.3440
0.0000 0.0000 0.0000 0.0000 0.0000 0.0000 0.0000 0.0000
©2003 CRC Press LLC