Advances in parasitology global mapping of infectious diseases - part 10 doc
Bạn đang xem bản rút gọn của tài liệu. Xem và tải ngay bản đầy đủ của tài liệu tại đây (480.29 KB, 7 trang )
Section). The fit of the statistical model to the global malaria was
significantly better than the fit of two alternative, biological models to
the same map, although this is not particularly surprising because the
map was used in the construction of the statistical model, but not the
biological one. We repeat, however, that the biological model has not
been tested for its accuracy against any independent datasets. The
model is a ssu med to be co rrect and therefore, it is further assumed, the
map resulting from it must also be a correct picture of where malaria
was distributed before human intervention.
The statistically based model of global malaria distribution under
present-day climate was then re-run with various climate scenarios
for the future (Rogers and Randolph, 2000). Even under a relatively
extreme scenario of climate change (the HadCM2 ‘High’ scenario:
-office.gov.uk/sec5/CR_dic/Brochure97/), there was
remarkably little change in the predicted global distribution of
malaria in the future, compared with the present day (Figures 2b and
c). Unsurprisingly, areas predicted to be the most affected are those
near the current edges of malaria’s global distribution; the southern
United States, Turkey, Turkmenistan and Uzbekistan, Brazil and
China. They also include some highland areas, for example, in East
Africa, where malaria is predicted to appear for the first time, and
some presently marginal areas that become too dry in the future and
from which malaria is predicted to disappear (e.g. the eastern sea-
board of India). In global terms, malaria is predicted to appear for
the first time in areas in which about 360 million people live at the
present time, and to disappear from areas where about 330 million
people live at present (Figure 2c). The net difference (30 million peo-
ple) is almost certainly not significant, given the uncertainties in the
modelling. Zero net differences, however, hide the fact that almost
700 million people will be affected, one way or another, by even the
modest changes predicted by the statistical model.
4.3. Malaria: Further Developments of Biological Models
Using a different biological model for malaria in Africa, Thomas
et al. came to conclusions rather more like those of the statistical
D.J. ROGERS AND S.E. RANDOLPH358
Hungary
Lithuania
Sweden
Lithuania
Hungary
Sweden
Annual no. TBE cases
0
200
400
1960 65 70 75 80 85 90 95 2000 2005
Hungary
0
300
600
1960 65 70 75 80 85 90 95 2000 200
5
Lithuania
0
50
100
150
1960 65 70 75 80 85 90 95 2000 2005
Sweden
9
11
13
15
17
19
21
1960 65 70 75 80 85 90 95 2000
Year
Mean temperature
May-Aug
2
4
6
8
10
12
1960 65 70 75 80 85 90 95 2000
Mean temperature
March-May
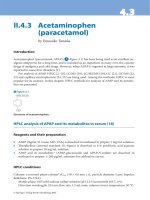
Figure 3 Top: changes in the annual numbers of cases of tick-borne
encephalitis in Sweden, Hungary and Lithuania, 1960–2004. The step in-
creases in Sweden from 1983 to 1986 and again in 2000 are highlighted by
horizontal lines showing mean levels in each period. Bottom: changes in
mean spring (upper) and summer (lower) temperatures (taken from the in-
terpolated climate surfaces prepared by the CRU, University of East Anglia)
for 0.51 grid squares centred on Zala county Hungary, Siauliu in Lithuania
and Stockholm in Sweden. Dotted horizontal lines show the 1960–2000
mean levels for each site.
CLIMATE CHANGE AND VECTOR-BORNE DISEASES 367
Plate 8.4 Each virus of the tick-borne encephalitis complex occupies a distinct
‘eco-climatic’ space, illustrated here in bi-variate space defined by two of the most
significant climatic variables that predict the distribution of each virus. NDVI (nor-
malized difference vegetation index) is an indirect measure of moisture conditions.
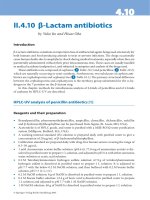
m, vector/host ratio
a, biting rate
µ, vector mortality rate
T, extrinsic incubation period
m
a
T
µ
temperature
temperature
temperature
temperature
??
?
+
-
+
+?-
Plate 10.1 Likely effects of increasing temperature on the variables and param-
eters of the R
0
equation. The net effect is indicated by the positive or negative symbol
within each panel. Notice that a positive effect here might decrease transmission (e.g.
the effect on m) or increase it (e.g. the effect on a).
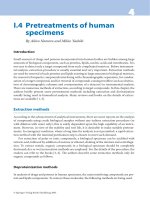
Probability
= 00 - 0.349
= 0.50 - 0.549
= 0.45 - 0.499
= 0.65 - 1.0
= 0.35 - 0.449
= 0.55 - 0.649
= Observed
=
No prediction
A
Plate 10.2 (a) Global map of malaria distribution according to the WHO (1997) (yellow cross-hatching) and predicted distribution
made from 1961–1990 global climate norms. Predictions were made using a discriminant analysis approach (Chapter 1 and (Rogers,
2000)) and are on a probability scale from zero (coloured red) to 1.0 (coloured green) (see inset legend) (model results: 78% correct with
14% false positives and 8% false negatives). (b) Predicted global distribution of malaria in 2050 under the HadCM2 High scenario of
global warming. The model from (A) was run using these climate predictions to produce an estimate of malaria distribution in 2050
(colour scale as in A). The WHO map of malaria is shown for reference (yellow cross-hatching). (c) The difference between Plate 10.2A
and B reveal the predicted changes in global malaria distribution in 2050. Areas coloured red are presently suitable for malaria but will
become unsuitable (generally because of higher temperature or lower rainfall). Areas coloured green are presently unsuitable but are
predicted to become suitable. All areas of no change (i.e. suitable or unsuitable, now and in 2050) are coloured white. Plates 10.2A–C
from Rogers and Randolph (2000), with permission.
Probability
= 00 - 0.349
= 0.50 - 0.549
= 0.45 - 0.499
= 0.65 - 1.0
= 0.35 - 0.449
= 0.55 - 0.649
= Observed
=
No prediction
B
= presently suitable, becoming unsuitable by 2050
= presently unsuitable, becoming suitable by 2050
C
Plate 10.2 (continued)
Index
Accessibility modeling, in global
population distribution
determination, 129–131
ADDS (Africa Data Dissemination
Service), 67
ADEOS (Advanced Earth Observation
Satellite) program, 63–64
Administrative boundary data, 68
A. duodenale, in STH infections,
221–224, 232–239, 243, 246–247
Ae. aegypti, 183, 185–197, 207, 209
global distribution of, 243
in dengue, 207, 307
in yellow fever, 210
Ae africanus, in yellow fever, 184–185
Ae. albopictus, 185
air travel risk routes of, 318, 330
global distribution of, 243
in yellow fever, 210
shipping risk routes of, 317
Ae. japonicus, 307–308
Africa
east African highlands, increased
incidence of malaria in, 370–374
infectious disease contagion in, 377
malaria in, 355, 370–377
Rift Valley Fever (RVF) in, 16, 29
WNV in, 307, 322–323
yellow fever and dengue fever in,
186–187, 194–195, 198, 200–209
AIC (Akaike Information Criterion), 23,
199
in yellow fever and dengue fever,
200–209
AIDS, 300–301
Airport malaria, 326–329
Albendazole, 234, 239, 247, 250
Altitudinal mask, in malaria
transmission, 161–167
A. lumbricoides (roundworm), in STH
infections, 222
An. atroparvus, 328
Ancillary data, in global population
distribution determination, 124,
135–136, 148
An. gambiae, 307, 326–330
Anthrax and bioterrorism, 302–304
Asia, 298, 300
cholera in, 297–298
influenza in, 298–305
WNV in, 307, 322–323
yellow fever and dengue fever in,
186–187, 194–195, 198, 200–209
ASTER (Advanced Spaceborne Thermal
Emission and Reflection)
radiometer, in infectious disease
distribution mapping, 55–56
AVHRR (Advanced Very High
Resolution Radiometer) sensor, 37,
82, 198, see also NOAA
and MODIS, 55–68
archives, 39
B. anthracis, 303
Biological maps, 3
Bioterrorism, 302
Black Death, due to bubonic plague,
295–297
Bootstrap sampling, 15–17, 30, 32
Brazil, yellow fever in, 184, 207–209
ADVANCES IN PARASITOLOGY VOL 62
ISSN: 0065-308X $35.00
DOI: 10.1016/S0065-308X(05)62013-1
Copyright r 2006 Elsevier Ltd.
All rights of reproduction in any form reserved
Contents of Volumes in This Series
Volume 41
Drug Resistance in Malaria Parasites of Animals and Man . . . . . . . . . . . . 1
W. P
ETERS
Molecular Pathobiology and Antigenic Variation of Pneumocystis
carinii 63
Y. N
AKAMURA AND M. WADA
Ascariasis in China. . . . . . . . . . . . . . . . . . . . . . . . . . . . . . . . . . . . . . . . . 109
P. W
EIDONO,Z.XIANMIN AND D.W.T. CROMPTON
The Generation and Expression of Immunity to Trichinella spiralis in
Laboratory Rodents. . . . . . . . . . . . . . . . . . . . . . . . . . . . . . . . . . . . . . 149
R.G. B
ELL
Population Biology of Parasitic Nematodes: Application of
Genetic Markers . . . . . . . . . . . . . . . . . . . . . . . . . . . . . . . . . . . . . . . . 219
T.J.C. A
NDERSON, M.S. BLOUIN AND R.M. BRECH
Schistosomiasis in Cattle . . . . . . . . . . . . . . . . . . . . . . . . . . . . . . . . . . . . . 285
J. D
E BONT AND J. VERCRUYSSE
Volume 42
The Southern Cone Initiative Against Chagas Disease . . . . . . . . . . . . . . . 1
C.J. S
CHOFIELD AND J.C.P. DIAS
Phytomonas and Other Trypanosomatid Parasites of Plants and Fruit. . . . . 31
E.P. C
AMARGO
Paragonimiasis and the Genus Paragonimus 113
D. B
LAIR, Z B. XU AND T. AGATSUMA
Immunology and Biochemistry of Hymenolepis diminuta 223
J. A
NREASSEN, E.M. BENNET-JENKINS AND C. BRYANT
Control Strategies for Human Intestinal Nematode Infections . . . . . . . . . . 277
M. A
LBONICO, D.W.T. CROMPTON AND L. SAVIOLI
DNA Vaccines: Technology and Applications as Anti-parasite and
Anti-microbial Agents . . . . . . . . . . . . . . . . . . . . . . . . . . . . . . . . . . . . 343
J.B. A
LARCON, G.W. WAINE AND D.P. MCMANUS
ADVANCES IN PARASITOLOGY VOL 62
ISSN: 0065-308X $35.00
DOI: 10.1016/S0065-308X(05)62014-3
Copyright r 2006 Elsevier Ltd.
All rights of reproduction in any form reserved