Báo cáo y học: "Daily rhythm of cerebral blood flow velocity" pdf
Bạn đang xem bản rút gọn của tài liệu. Xem và tải ngay bản đầy đủ của tài liệu tại đây (651.25 KB, 11 trang )
BioMed Central
Page 1 of 11
(page number not for citation purposes)
Journal of Circadian Rhythms
Open Access
Research
Daily rhythm of cerebral blood flow velocity
Deirdre A Conroy*
1
, Arthur J Spielman
1,2
and Rebecca Q Scott
3
Address:
1
Department of Psychology, The Graduate School and University Center of the City University of New York, New York, USA,
2
Department
of Neurology and Neuroscience, New York Presbyterian Hospital, New York, USA and
3
Department of Health Psychology, Albert Einstein Medical
College at Yeshiva University, Bronx, USA
Email: Deirdre A Conroy* - ; Arthur J Spielman - ; Rebecca Q Scott -
* Corresponding author
Abstract
Background: CBFV (cerebral blood flow velocity) is lower in the morning than in the afternoon
and evening. Two hypotheses have been proposed to explain the time of day changes in CBFV: 1)
CBFV changes are due to sleep-associated processes or 2) time of day changes in CBFV are due to
an endogenous circadian rhythm independent of sleep. The aim of this study was to examine CBFV
over 30 hours of sustained wakefulness to determine whether CBFV exhibits fluctuations
associated with time of day.
Methods: Eleven subjects underwent a modified constant routine protocol. CBFV from the middle
cerebral artery was monitored by chronic recording of Transcranial Doppler (TCD)
ultrasonography. Other variables included core body temperature (CBT), end-tidal carbon dioxide
(EtCO2), blood pressure, and heart rate. Salivary dim light melatonin onset (DLMO) served as a
measure of endogenous circadian phase position.
Results: A non-linear multiple regression, cosine fit analysis revealed that both the CBT and CBFV
rhythm fit a 24 hour rhythm (R
2
= 0.62 and R
2
= 0.68, respectively). Circadian phase position of
CBT occurred at 6:05 am while CBFV occurred at 12:02 pm, revealing a six hour, or 90 degree
difference between these two rhythms (t = 4.9, df = 10, p < 0.01). Once aligned, the rhythm of
CBFV closely tracked the rhythm of CBT as demonstrated by the substantial correlation between
these two measures (r = 0.77, p < 0.01).
Conclusion: In conclusion, time of day variations in CBFV have an approximately 24 hour rhythm
under constant conditions, suggesting regulation by a circadian oscillator. The 90 degree-phase
angle difference between the CBT and CBFV rhythms may help explain previous findings of lower
CBFV values in the morning. The phase difference occurs at a time period during which cognitive
performance decrements have been observed and when both cardiovascular and cerebrovascular
events occur more frequently. The mechanisms underlying this phase angle difference require
further exploration.
Background
It has been well documented that cerebral blood flow
velocity (CBFV) is lower in sleep [1-7] and in the morning
shortly after awakening [8-10] than in the afternoon or
evening. Generally accepted theories about the time of
day changes in CBFV attribute the fall in CBFV to the
Published: 10 March 2005
Journal of Circadian Rhythms 2005, 3:3 doi:10.1186/1740-3391-3-3
Received: 21 December 2004
Accepted: 10 March 2005
This article is available from: />© 2005 Conroy et al; licensee BioMed Central Ltd.
This is an Open Access article distributed under the terms of the Creative Commons Attribution License ( />),
which permits unrestricted use, distribution, and reproduction in any medium, provided the original work is properly cited.
Journal of Circadian Rhythms 2005, 3:3 />Page 2 of 11
(page number not for citation purposes)
physiological processes of the sleep period and the
increase during the day to waking processes. The low
CBFV in the morning is thought to be a consequence of
the fall in the overall reduced metabolic level [8,10,11]
and reduced cognitive processing [12]. Additionally, the
reduced physical activity [13], reduced body temperature,
and the recumbent sleeping position have also been pro-
posed as contributors [14] to the decline in CBFV and
analogous brain processes.
An alternative to these explanations that attribute changes
in CBFV to sleep and wake dependent processes is that
this pattern of fluctuation reflects an endogenous process
with circadian rhythmicity. The decline of CBFV across the
sleep period and rise after subjects are awakened in the
morning resemble the endogenous circadian changes in
core body temperature (CBT), a reliable index of endog-
enous circadian rhythmicity. Both patterns are low during
sleep, start to rise in the morning, reach their peak in the
late afternoon, and then drop during the sleep period.
The aim of this study was to examine CBFV over ~30
hours of sustained wakefulness to unmask and quantify
contributions of the endogenous circadian system. By not
permitting sleep, the evoked changes dependent on this
change of state will not contribute to the observed CBFV
changes. We hypothesized that time of day changes in
CBFV are due to endogenous circadian regulation. Previ-
ous studies have been limited by several factors. First, the
environmental conditions (light level) and the behavior
of the subject (sleep, meals, and caffeine intake) were not
controlled [15,13,1,16]. Second, CBFV measurements
were obtained at only a few circadian points. For example,
Ameriso et al. [15] and Qureshi et al. [16] assessed CBFV
between 6–8 am, 1–3 pm, and 7–9 pm. Diamant et al [13]
assessed CBFV during the first 15 minutes of every hour
across a 24 hour period. Given these brief time periods,
the findings are only a schematic of the 24 hour profile.
Third, primary output markers of the endogenous circa-
dian pacemaker (such as core body temperature and
melatonin production) were not assessed.
We employed the "constant routine" protocol, which was
designed specifically to unmask underlying circadian
rhythms in constant conditions [17]. CBFV was collected
by Transcranial Doppler (TCD) ultrasonography for the
entire study period. Core body temperature and salivary
dim-light melatonin onset (DLMO) were measured for
determination of circadian phase. Continuous electroen-
cephalography (EEG) was performed to ensure wakeful-
ness across the study. Additionally, measurements of
blood pressure, heart rate, and end tidal carbon dioxide
(Et
CO2
), three of the main regulators of CBFV, were col-
lected every half hour.
Methods
Subject selection
Twelve subjects (10 men and 2 women; ages 19–38, mean
28 years) agreed to participate. One subject discontinued
her participation because of a headache 15 hours into the
study. Subjects were in good health, as assessed by medi-
cal history, semi-structured clinical interview, and physi-
cal exam. Information regarding menstrual cycle was not
obtained from female subjects. Subjects also underwent
an independent standard cerebrovascular assessment and
were determined to be normal. They reported no symp-
toms of sleep problems (such as insomnia, obstructive
sleep apnea, narcolepsy, or restless legs syndrome).
Subjects that were selected to participate kept to a desig-
nated sleep-wake schedule (that was negotiated from the
subject's typical pattern) and filled out a sleep diary for
the two weeks prior to the time in the laboratory. Accord-
ing to sleep diary reports, bedtimes ranged from 10:30 pm
to 1:00 am and waketimes ranged from 6:00 am to 10:00
am. Alcohol and caffeine intake was discontinued for the
entire week before the study. During the data collection,
subjects were not permitted either alcohol or caffeine. All
subjects were non-smokers.
Laboratory constant routine protocol
The study protocol was approved by the Institutional
Review Boards of New York Presbyterian Hospital – Weill
Medical College of Cornell University and The City Col-
lege of New York. Subjects gave written and informed con-
sent before participating. Subjects arrived at the sleep
laboratory between 9:30 am and 10:00 am. They were ori-
ented to the study procedures and to their bedroom. Elec-
trodes were placed on the subject's head and face as they
sat in a chair next to the bed. Data collection began at 11
am. Subjects remained in bed and awake in a semi recum-
bent position for 30 hours in an established "constant
routine" (CR) protocol. Subjects remained in low (<25
lux) light levels which have been shown to have little or
no entraining effect on the circadian pacemaker [18]. They
were not allowed to get out of bed to urinate. Instead they
urinated in private in a urinal or bedpan. Subjects
remained awake from 11:00 a.m. on Day 1 until 5 p.m. on
Day 2. Throughout the study, subjects were provided
small meals (Ensure
®
liquid formula plus one-quarter
nutritional food bar) every 2 hours. Subject's typical total
food and liquid intake for a day and a quarter were
divided into 15 relatively equal portions. Only one sub-
ject participated in the CR per 30-hour period.
This protocol represents a modified CR in two ways. First,
subjects were allowed to watch television and were there-
fore were not in "time isolation." Television content was
monitored so that subjects were not exposed to programs
with highly emotional themes. Second, subjects needing
Journal of Circadian Rhythms 2005, 3:3 />Page 3 of 11
(page number not for citation purposes)
to defecate were allowed to go to the bathroom, which
was located a few steps away from the bedside. We chose
this method as an alternative to using the bedpan to
ensure subject's comfort and study compliance. Three
subjects (subjects 05, 06, and 10) got out of bed once at
3:30, 21:30, and 15:30, respectively, to defecate. One sub-
ject, subject 12, got out of bed twice, at 22:30 and 6:35.
Subject 10 used the bathroom only during the adaptation
period. A paired-samples t-test was conducted to evaluate
the impact of getting out of bed to defecate on subject's
CBT and CBFV values. The CBT and CBFV values in the
two hours before getting up were compared to the two
hours after the subject got up. Subjects 5 showed a slight
decrease in CBT from before (M = 98.12, SD = 0.14) to
after the subject returned to the bed (M = 97.91, SD =
0.08), t(3) = -5.17, p = .014). Subject 6 showed a decline
in CBFV from before (M = 56.14, SD = 2.3) to after the
subject returned to the bed (M = 45.67, SD = 3.7), t(3) =
5.49, p = 0.012). There were no other significant differ-
ences detected between these two time periods for subject
5's CBFV, subject 6's CBT, or for both times subject 12 got
out of the bed. By visual inspection, the overall shape of
the curves in these subjects was not affected and therefore
these subject's data were included in subsequent analyses.
Transcranial Doppler ultrasound recordings
The current study utilized TCD ultrasonography to meas-
ure cerebral blood flow velocity. TCD is a non-invasive
instrument (consisting of one or two 2-Mhz transducers
fitted to a headband, MARC500, Spencer Technologies,
Nicolet Biomedical Inc) that is used predominantly as a
diagnostic tool to assess cerebral hemodynamics in nor-
mal and pathological conditions. TCD ultrasonography is
predicated on a theory that involves the measurement of
moving objects when combined with radar. When the
instrument emits the sound wave, it is reflected by the
blood cells that are moving in the vector of the sound
wave [19].
CBFV was measured using either the right or left middle
cerebral artery (MCA) using TCD sonography (TCD: DWL
Multidop X-2, DWL Elektronische Systeme GmbH, D-
78354 Sipplingen/Germany) through the temporal win-
dow. An observer who was present continuously during
the recordings evaluated the quality of the signal. This
enabled long-term recording of CBFV throughout the
study. Fast Fourier Transformation (FFT) of the signal was
used to analyze the velocity spectra. The mean velocity of
the MCA was obtained from the integral of the maximal
TCD frequency shifts over one beat divided by the corre-
sponding beat interval and expressed in cm/sec. Analysis
was conducted off line.
Measurement of standard markers of the circadian
pacemaker
Body temperature recordings
Core body temperature was recorded at 1-minute intervals
with an indwelling rectal probe (MiniMitter, Co. Bend,
OR). A wire lead connected the sensor out of the rectum
to a data collection system worn on the belt. Temperature
readings were collected and saved into the device and
monitored at hourly intervals by the investigator. After the
study, the recordings were visually inspected and artifacts
resulting from removal or malfunction of the probe were
excluded from further analysis.
Salivary melatonin
Salivary samples of 3 ml were collected every hour from
11:00 a.m. on Day 1 to 4:00 p.m. on Day 2. Ten of these
samples were used only for the determination of the tim-
ing of the salivary dim light melatonin onset (DLMO). For
nine subjects, salivary DLMO was assessed across a ten-
hour time window that included the ten hours before the
CBT minimum. Immediately after collection, each saliva
sample was frozen and stored at -20°C. Saliva samples
were assayed using Bühlmann Melatonin Radio Immu-
noassay (RIA) test kit for direct melatonin in human saliva
(American Laboratory Products Co., Windham, NH).
Analysis was conducted at New York State Institute for
Basic Research. Salivary DLMO time was selected based
on two criteria. The saliva sample needed to have mela-
tonin concentration 3 pg/ml or above and later samples
needed to show higher levels (Bühlmann laboratories).
Second, the 3 pg/ml threshold needed to occur within 6–
10 hours before core body temperature minimum [20].
Polygraphic recordings
Electroencephalography (EEG) was continually assessed
across the 30 hours to ensure that subjects maintained
wakefulness. The following montage was used according
to the international 10–20 system: C3-A2, C4-A1, O1-A2,
O2-A1, ROC-A1, LOC-A2, and submentalis electromyo-
gram (EMG). One channel of electrocardiogram was con-
tinuously recorded by monitoring from two electrodes
(one on each side of the body at the shoulder chest junc-
tion). The EEG software (Rembrant Sleep Collection Soft-
ware Version 7.0) was used for data acquisition and
display of the signals on a personal computer. Through-
out the CR, the investigator (DAC) monitored the quality
of the recordings. The recordings were scored by RQS and
DAC.
Blood pressure, heart rate, and end-tidal CO2
An automated blood pressure cuff was placed on the bicep
of the subject and inflated two times each hour in order to
determine changes in blood pressure and heart rate over
time. Blood pressure and heart rate in one subject (02)
was recorded via a finger blood pressure monitor (Omron
Journal of Circadian Rhythms 2005, 3:3 />Page 4 of 11
(page number not for citation purposes)
Marshall Products, Model F-88). Blood pressure and heart
rate in subjects 03, 04, 05, 06, and 07 were recorded with
Omron Healthcare, Inc, Vernon Hills, Illinois 60061
Model # HEM-705CP Rating: DC 6V 4W Serial No:
2301182L. Blood pressure and heart rate for subjects 08,
09 and 10 was recorded with a similar blood pressure
monitor (CVS Pharmacy Inc, Woonsocket, RI 02895
Model # 1086CVS). Blood pressure and heart rate record-
ings were not measured in subjects 11 and 12. Et
CO2
was
continuously obtained. A nasal cannula for monitoring
expired gases was placed under the nose. Relative changes
in carbon dioxide content were measured by an Ohmeda
4700 Oxicap (BOC healthcare). Mean Et
CO2
levels were
analyzed off-line. Et
CO2
recordings were not measured in
subjects 11 and 12.
Data Analyses
Data reduction and statistical procedures
CBT and CBFV values were first subjected to data rejec-
tion. All CBT values less than 96 degrees were determined
to be artifact and were rejected. All CBFV values less than
20 cm/sec were determined to be artifact according to the
clinical criteria set by the staff neurologist. Data reduction
was accomplished by averaging into one minute, 30
minute or hourly bins. Correlations presented here were
performed on mean values in 30 minute bins. To ensure
that circadian measurements were made under basal con-
ditions, the first five hours of the constant routine were
excluded from all analyses to eliminate effects of study
adaptation. The last hour was excluded to eliminate con-
founding effects such as expectation effects.
The data are presented in this article in three ways. First,
CBT and CBFV values were plotted according to time of
day (Figures 1 and 2). Second, CBFV values were aligned
according to the CBT nadir (Figure 3) and third, the CBFV
nadir was aligned to the CBT nadir (Figure 4). To align
CBFV to the CBT circadian nadir as shown in Figure 3, the
CBT nadir of each individual subject was set to circadian
time 0, or 0°. The CBFV value that corresponded to the
CBT nadir was then also set to 0. Each half hour data point
after the temperature nadir and corresponding CBFV val-
ues were then set to a circadian degree. There were a total
of 48 data points across the 24 hour period. Therefore,
each data point was equal to 7.5 degrees so that each data
point would accumulate to 360°. Lastly, mean values
were obtained for CBT and CBFV at each circadian degree.
To align the CBFV nadir to the CBT nadir, first, the lowest
value of CBT and the lowest value of CBFV were identified
and set to circadian time 0, or 0°. Each half hour data
point after the CBT nadir and CBFV nadir were then set to
a circadian degree. There were a total of 48 data points
across the 24 hour period. Therefore, each data point was
equal to 7.5 degrees so that each data point would accu-
mulate to 360°. Lastly, mean values were obtained for
CBT and CBFV at each circadian degree.
Estimation of circadian phase
A 24-hour non-linear multiple regression -cosine curve fit
analysis was performed on the CBT and CBFV data (SAS
Institute, Cary, NC). This technique constrains the circa-
dian period of CBT and CBFV to be within 24 hours. This
technique used the following equations: model cbt =
&avg_cbt + r * cos((2 * 3.1415) * (hours-&max_cbt)/24;
model cbfv = &avg_cbt + r * cos((2 * 3.1415) * (hours-
&max_cbfv)/24, where & = constants that center the curve
at the actual average for each series (vertical centering)
and the predicted maximum at the actual maximum (hor-
izontal centering); r = the amplitude of the cosine wave.
An additional analysis was performed which also yielded
the estimated clock time for the CBT nadir and CBFV
nadir (Synergy software, Kaleidagraph Version 3.6). Third,
the minimum of the circadian rhythm of CBT and salivary
DLMO were also used as markers of the endogenous cir-
cadian phase. A paired t-test was used to determine the
overall phase difference between CBT and CBFV.
Results
Eleven subjects completed the protocol. The TCD probe
was placed on either the right or left temple, whichever
gave the better signal. Mean isonation depth of the TCD
signal was 56.5 mm for the right MCA and 55.6 mm for
the left MCA (range 53–60 mm). The constant routine
ranged from 28 to 30 hours in duration. Polygraphic
recordings confirmed sustained wakefulness across essen-
tially the entire protocol in all but one subject. Subjects
that had difficulty remaining awake were monitored
closely and aroused when needed by engagement in con-
versation. Results from the polygraphic recordings are not
presented here. We do not present the results of the poly-
graphic recordings because, for the purposes of this study,
these recordings were used solely to monitor whether sub-
jects were awake or asleep. The first five hours and the
final hour of data from the constant routine were
excluded from analysis.
Core body temperature, cerebral blood flow velocity and
the 24-hour day
A 24 hour non-linear multiple regression, cosine fit anal-
ysis revealed that the overall mean CBT rhythm (n = 11)
fit a 24 hour cosine rhythm (R
2
= 0.62, p < 0.01), Figure 1.
The mean CBT across all subjects was 98.6 °F (+/- 0.03
°F). Figure 2 shows that a 24-hour non-linear multiple
regression, cosine analysis fit a 24 hour cosine rhythm (R
2
= 0.67, p < 0.01), Figure 2. The mean CBFV across subjects
was 40.6 cm/sec (+/- 0.54 cm/sec). Salivary DLMO
occurred 7.7 hours prior to the CBT nadir in nine subjects,
which served only as a secondary measure of endogenous
circadian phase position in those subjects. The mean
Journal of Circadian Rhythms 2005, 3:3 />Page 5 of 11
(page number not for citation purposes)
salivary melatonin concentration across the ten hour win-
dow was 15.3 pg/ml (+/-3.05 pg/ml).
CBFV rhythm is 90 degrees out of phase with the CBT
rhythm
The overall mean circadian position of CBT occurred at
6:05 am and the mean position of CBFV occurred at 12:02
pm (Figure 3), yielding a 6 hour or 90 degree statistically
significant difference (t = 4.9, DF = 10, p < 0.01). In indi-
vidual subject data, the differences ranged from 0 to 8.5
hours. In eight subjects, the CBFV phase occurred later
than the respective CBT phase, with mean difference of
5.2 hours. In two subjects, the CBFV nadir occurred earlier
than the respective CBT nadir, with a mean difference of 6
hours. In one subject, there was no difference between the
phase of CBT and CBFV. However, this subject's CBT
rhythm was highly unusual, with the nadir occurring at
11:35 am on Day 2. Nevertheless, we felt the most appro-
priate way to present the data was to include this subject
in the overall analysis. When the phase of CBFV was
shifted so that the lowest value was aligned to the lowest
CBT value, the two parameters were highly correlated (see
Figure 4; r = 0.77, n = 98, p < 0.01). While the difference
in the two rhythms variability was large, Fisher's z-trans-
formed values revealed that the amplitudes of the two
parameters were similar. The amplitude of CBFV yielded a
z score of 4.25 and CBT yielded a z score of 3.06.
Blood pressure recordings and systemic hemodynamic
variables
A Pearson correlation revealed a positive relationship
between CBT and heart rate (r = 0.40, p < 0.01) across the
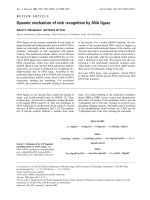
24-hour Cosine Curve fit to Mean Core Body Temperature (°F)Figure 1
24-hour Cosine Curve fit to Mean Core Body Temperature (°F). Time course of CBT according to time of day.
Shown is a double plot of the group (n = 11) mean levels (+/- SEM) of CBT (blue diamonds) fit with a 24-hour cosine curve
(purple squares). Time of day is shown on the abscissa. The ordinate shows CBT values (degrees F). The vertical line indicates
where the data was double plotted. Also displayed in the upper right corner is the non-linear cosine curve fit for mean CBT, R
2
= 0.62. The overall mean circadian phase position of the minimum was 6:05 am.
Journal of Circadian Rhythms 2005, 3:3 />Page 6 of 11
(page number not for citation purposes)
24 hour period. Diastolic blood pressure (DBP) and CBT
showed a negative correlation (r = -0.30, p < 0.05). Et
CO2
showed a trend towards a direct relationship with CBFV (r
= 0.24, p = 0.10). Blood pressure, heart rate, and Et
CO2
served only as regulators of CBFV and were not analyzed
according to circadian phase.
Discussion
This study is the first to use the constant routine (CR) pro-
tocol to determine whether the endogenous circadian
pacemaker contributes to the previously reported diurnal
changes in CBFV. The current work demonstrates that,
with limited periodic external stimuli and a constant pos-
ture, there is 24-hour rhythmicity in CBFV. Subjects
showed a cycle of approximately 24 hours in CBT, which
has been previously demonstrated with the CR [21].
Figure 3 illustrates the intricate relationship between the
rhythms across the study period. At approximately the
CBT acrophase, the relationship between the two rhythms
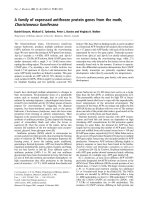
24-hour Cosine Curve fit to Mean Cerebral Blood Flow Velocity (cm/sec)Figure 2
24-hour Cosine Curve fit to Mean Cerebral Blood Flow Velocity (cm/sec). Time course of CBFV according to time
of day. Shown is a double plot of the group (n = 11) mean levels (+/- SEM) of CBFV (blue diamonds) fit with a 24-hour cosine
curve (purple squares). Time of day is shown on the abscissa. The ordinate shows CBFV values (cm/sec). The vertical line indi-
cates where the data was double plotted. Also displayed in the upper right corner is the non-linear cosine curve fit for mean
CBFV, R
2
= 0.67. The overall mean circadian phase position of the minimum was 12:02 pm.
Journal of Circadian Rhythms 2005, 3:3 />Page 7 of 11
(page number not for citation purposes)
undergoes a transition. Between 180 and 240 degrees,
CBFV is still rising and CBT is changing directions (first
rising, reaching its peak and then falling). This period
between 180 and 240 has been described as a "wake
maintenance zone", a time in the circadian cycle during
which humans are less likely to fall asleep [22]. In our
subjects, the CBT is near its zenith or just starting to fall at
this time and CBFV is still steadily rising. Higher values in
CBT and CBFV are associated with activation and there-
fore these two endogenous rhythms may be promoting
wakefulness during this "wake maintenance zone". How-
ever, at the end of this transition period, CBT is falling and
CBFV is still rising, perhaps reflecting continued activa-
tion of the cerebral cortex. Whereas the two-process
model predicts increased tendency to sleep as CBT falls
[23], our finding may provide the mechanism by which
wakefulness is effortlessly maintained before bedtime.
Figure 3 further illustrates that as wakefulness is extended
past the subject's habitual bedtime (approximately 270
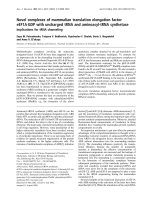
Mean CBT and CBFV Aligned to CBT NadirFigure 3
Mean CBT and CBFV Aligned to CBT Nadir. Time course of mean CBFV and mean CBT aligned to the nadir of CBT and
then averaged. Shown is a double plot of the group (n = 11) mean levels (+/-SEM) of CBT (purple squares) and CBFV (blue cir-
cles) aligned to the phase of the circadian temperature cycle. Circadian time in degrees is shown on the abscissa. The ordinate
on the left shows CBT values (degrees F) and CBFV (cm/sec) on the right. The vertical line indicates the CBT nadir.
Journal of Circadian Rhythms 2005, 3:3 />Page 8 of 11
(page number not for citation purposes)
degrees), the two rhythms decline together. Between 0
and 60 degrees, CBFV steadily declines and CBT is steadily
rising. The lower CBFV values in the morning may play a
role in cognitive performance impairments [24], particu-
larly the 3–4.5 hour phase difference in neurobehavioral
functioning relative to the CBT rhythm that has been pre-
viously demonstrated in constant routine protocols [25].
Earlier studies using simultaneous EEG and TCD to con-
tinuously measure CBFV across the sleep period have con-
cluded that, except for periods of REM sleep, [26,27],
there is a linear decline in CBFV across the night during
periods of non-REM sleep [1,28]. Other groups utilizing
these techniques simultaneously speculated that the
decline in CBFV through the night was a "decoupling" of
Mean CBT and CBFV Aligned to Their Respective NadirFigure 4
Mean CBT and CBFV Aligned to Their Respective Nadir. Time course of mean CBFV and mean CBT aligned to each
of their respective nadirs and then averaged. Shown is a double plot of the group (n = 11) mean levels (+/-SEM) of CBT (purple
squares) and CBFV (blue circles) aligned to the phase of the circadian temperature cycle. Circadian time in degrees is shown on
the abscissa. The ordinate on the left shows CBT values (degrees F) and CBFV (cm/sec) on the right. The vertical line indicates
both the CBT nadir and the CBFV nadir. The correlation coefficient between the aligned rhythms is 0.77 (p < 0.01).
Journal of Circadian Rhythms 2005, 3:3 />Page 9 of 11
(page number not for citation purposes)
cerebral electrical activity and cerebral perfusion during
non-REM sleep [8-10]. In all studies [1,8-10,28], CBFV
values were lower in the morning during wakefulness
than during wakefulness prior to sleep at night. The cur-
rent findings show that the decline in CBFV is present dur-
ing wakefulness in the night time hours and therefore may
not be attributed solely to sleep and associated changes
that normally influence CBFV (including factors such as
the shift to recumbency, and reduced activity, metabolic
rate and respiratory rate).
Moreover, our interaction with the subjects and the mon-
itoring of EEG for signs of sleep resulted in no sleep in all
but one subject. The one exception was in a subject who
lapsed into brief periods of sleep. Therefore, the fall in
CBFV in 10 out of 11 subjects cannot be explained by the
occurrence of non-REM sleep. It is possible, however, that
the decline of CBFV across the night and early morning
may be secondary to the sleep deprivation that is part of
the constant routine. Brain imaging studies across sus-
tained periods of wakefulness have shown significant
decreases in absolute regional cerebral glucose metabolic
rate in several areas of the brain [29-34].
The drop in CBT which preceded the parallel fall in CBFV
needs to be considered as a possible explanation for the
CBFV changes. The fall in CBT during sleeping hours is
attributed in part to sleep-associated changes and in part
to strong regular circadian forces independent of the sleep
period. CBT is, in fact, one of the key and most extensively
studied indices of the circadian phase. It is also known
that CBT is highly correlated with brain temperature and
brain metabolic rate [35]. Imaging studies have docu-
mented the intimate relation between brain activity and
increased metabolic rate and oxygen delivery through per-
fusion. Therefore, it is plausible that CBT is a direct influ-
ence on CBFV or an index of decreased metabolic need for
blood flow. The prevailing hypothesis that there is tight
coupling of normal neuronal activity and blood flow was
formulated over 100 years ago [36]. The drop in CBFV
may be a consequence of the lowered cerebral activity sec-
ondary to lowered brain temperature. In contrast, two
studies of exercise-induced hyperthermia showing
decreased global and middle cerebral artery CBFV [37,38]
do not support this hypothesized direct relationship
between the two variables. However, one of the main pur-
ported mechanisms for the fall in CBFV in these exercise
studies, the hyperventilation induced lowering of Pa
CO2
,
is unlikely present during waking while lying in bed at
night. Therefore, CBT declines remain a plausible explana-
tion for the portion of the 24 hours when CBFV declined.
Mechanisms of CBFV regulation
This protocol allowed the unique opportunity to evaluate
blood pressure, heart rate, and Et
CO2
in the absence of
sleep, in subjects with constant posture, and highly
restricted movements. While blood pressure clearly falls
during sleep in normal individuals, the absence of sleep in
the current study obviates the explanation that CBFV
declines are secondary to lowered blood pressure. Further-
more, we sampled blood pressure throughout the day and
night and found a weak inverse relationship between DBP
and CBT. This finding is in contrast to a careful study of
circadian influence on blood pressure in the absence of
sleep which showed no change in blood pressure during
the descending portion of the body temperature curve
[39]. Nevertheless, our finding was weak and likely does
not provide the explanation for the CBFV changes. The
small-inverse relationship between Et
CO2
and CBT is sim-
ilar to that found by Spengler et al. [40], who showed a
consistent but small amplitude circadian rhythm in mean
end-tidal Et
CO2
on a CR protocol. Et
CO2
showed a trend
towards a direct relationship with CBFV, which is consist-
ent with previous studies showing that changes in Et
CO2
are associated with changes in CBFV [41,42]. Heart rate
was correlated with CBT, consistent with the findings of
Van Dongen et al [39].
Clinical correlation
The approximate 6 hour (90 degree) phase angle differ-
ence between the CBFV and CBT suggests that CBFV con-
tinues to decline into the early to mid-morning hours.
This finding is consistent with a time window in the
morning during which several physiological changes have
been observed. For example, cerebral vasomotor reactivity
to hypocapnia, hypercapnia, and normoventilation has
been found to be most reduced in the morning [15,16]. It
is tempting to suggest that the the low CBFV values in the
morning may also help explain the well established diur-
nal variation of the onset of cerebrovascular accidents
(CVAs) [43]. A meta-analyses of 11,816 publications
between 1966 to 1997 found that there was a 49%
increased risk of strokes between 6 am and 12 pm [44].
This time period is in agreement with studies on myocar-
dial infarction (MI) and sudden death [45]. The increased
incidence of these events has been attributed, in part, to
the surge of blood pressure [13,46,47] and platelet aggre-
gability [48,49] in the morning when patients are getting
out of bed. Our results demonstrate that even in the
absence of surges in blood pressure, the phase of CBFV
reaches its lowest values during the hours before 12 pm.
This further suggests that the endogenous rhythm of CBFV
may be associated with the risk of CVAs in the late morn-
ing hours even without changes in posture or activity.
Conclusion
Overall, the results demonstrate that CBFV, in the absence
of sleep, exhibits properties of a circadian rhythm, as it
rises and falls across a 24 hour period. The 6 hour (90
degree) phase angle difference in the CBFV rhythm with
Journal of Circadian Rhythms 2005, 3:3 />Page 10 of 11
(page number not for citation purposes)
respect to the CBT rhythm may help explain previous
findings of lower CBFV values in the morning. The phase
difference occurs at a time period during which cognitive
performance decrements have been observed and when
both cardiovascular and cerebrovascular events occur
more frequently. The mechanisms underlying this phase
angle difference require further exploration.
List of abbreviations
CBFV Cerebral Blood Flow Velocity
CBT Core Body Temperature
TCD Transcranial Doppler
EtCO2 End tidal Carbon Dioxide
DLMO Dim Light Melatonin Onset
EEG Electroencephalogram
MCA Middle Cerebral Artery
FFT Fast Fourier Transformation
CR Constant routine
EMG Electromyogram
SBP Systolic Blood Pressure
DBP Diastolic Blood Pressure
CVA Cerebrovascular accident
MI Myocardial infarction
Competing interests
The author(s) declare that they have no competing
interests.
Authors' contributions
DAC coordinated, carried out, analyzed, and interpreted
the study. AJS participated in the analysis and interpreta-
tion of the findings. DAC drafted the manuscript and AJS
provided final approval of this version. RQS participated
in data collection and data analysis. DAC and AJS co-
designed the study. All authors read and approved the
final manuscript.
Acknowledgements
The authors are grateful to the volunteer participants who completed this
extremely difficult protocol, to the research assistants: Jason Birnbaum,
Will Carias, RN, Laura Diaz, Boris Dubrovsky, Mathew Ebben, Ph.D., Car-
rie Hildebrand, Lars Ross, Greg Sahlem, Mathew Tucker, Ayesha Udin, to
those who helped with the data analysis: Scott Campbell, Ph.D. of New
York Presbyterian Hospital, White Plains, Abdeslem ElIdrissi, Ph.D. of The
Institute for Basic Research, Staten Island, NY, Larry Krasnoff, Ph.D. of
Digitas, New York, and Andrew Scott, MBA, to those who provided their
expert advice: William Fishbein, Ph.D. of The City College of New York,
Paul Glovinsky, Ph.D. of The Sleep Disorders Center, Albany, NY, Margaret
Moline, Ph.D. of Eisai, Inc, Charles Pollak, MD of The Center for Sleep Med-
icine, New York Presbyterian Hospital-Cornell, and Alan Segal, MD of The
Department of Neurology, New York Presbyterian Hospital, and to others
who helped make this study possible: Stacy Goldstein, Neil B. Kavey, MD,
Igor Ougorets, MD, and Jerry Titus.
References
1. Droste DW, Berger W, Schuler E, Krauss K: Middle cerebral
artery blood flow velocity in healthy persons during wakeful-
ness and sleep: A Transcranial Doppler Study. Sleep 1993,
16(7):603-609.
2. Madsen PL, Holm S, Vorstrup S, Friberg L, Lassen NA, Wildschiodtz
G: Human regional cerebral blood flow during rapid eye
movement sleep. J Cereb Blood Flow Metab 1991, 11:502-507.
3. Meyer JS, Ishikawa Y, Hata T, Karacan I: Cerebral blood flow in
normal and abnormal sleep and dreaming. Brain Cogn 1987,
6(3):266-294.
4. Risberg J, Ingvar DH: Increase of cerebral blood volume during
REM-sleep in man. In Sleep: Physiology, Biochemistry, Psychology, Phar-
macology, Clinical Implications Edited by: Koella WP, Levin P. Basel:
Karger; 1972:384-388.
5. Sakai F, Meyer JS, Karacan I, Yamaguchi F, Yamamoto M: Nar-
colepsy: regional cerebral blood flow during sleep and
wakefulness. Neurology 1979, 29:61-67.
6. Sawaya R, Ingvar DH: Cerebral blood flow and metabolism in
sleep. Acta Neurol Scand 1989, 80:481-491.
7. Townsend RE, Prinz PN, Obrist WO: Human cerebral blood flow
during sleep and waking. J Appl Physiol 1973, 35(5):620-625.
8. Hajak G, Klingelhofer J, Schulz-Varszegi M, Matzander G, Sander D,
Conrad B, Ruther E: Relationship between cerebral blood
velocities and cerebral electrical activity in sleep. Sleep 1994,
17(1):11-19.
9. Hajak G, Klingelhofer J, Schulz-Varszegi M, Sander D, Ruther E: Sleep
apnea syndrome and cerebral hemodynamics. Chest 1996,
110(3):670-679.
10. Klingelhofer J, Hajak G, Sander D, Schulz-Varszegi M, Ruther E, Con-
rad B: Assessment of intracranial hemodynamics in sleep
apnea syndrome. Stroke 1992, 23:1427-1433.
11. Meyer JS, Sakai F, Karacan I, Derman S, Yamamoto M: Sleep apnea,
narcolepsy and dreaming: regional cerebral hemodynamics.
Ann Neurol 1980, 7:479-485.
12. Buchsbaum MS, Gillin JC, Wu J, Hazlett E, Sicotte N, DuPont RM:
Regional cerebral glucose metabolic rate in human sleep
assessed by Positron Emission Tomography. Life Sci 1989,
45:1349-1356.
13. Diamant M, Harms MP, Immink RV, Van Lieshout JJ, Van Montfrans
GA: Twenty-four-hour non-invasive monitoring of systemic
hemodynamics and cerebral blood flow velocity in healthy
humans. Acta Physiol Scand 2002, 175(1):1-9.
14. Yan H, Shan Y, Huang W, Bai Y, Zhang Q: Effect of body position
changes and circadian rhythm on cerebral blood flow
velocity. Space Med Eng (Beijing) 1997, 10(6):421-4.
15. Ameriso SF, Mohler JG, Suarez M, Fisher M: Morning reduction of
cerebral vasomotor reactivity. Neurology 1994, 44:1907-1909.
16. Qureshi AI, Winter C, Bliwise DL: Sleep fragmenation and
morning cerebrovasomotor reactivity to hypercapnia. Am J
Resp Crit Care Med 1999, 160(4):1244-1247.
17. Mills JN, Minors DS, Waterhouse JM: Adaptation to abrupt time
shifts of the oscillator controlling human circadian rhythms.
J Physiol Lond 1978, 285:455-470.
18. Boivin D, Duffy J, Kronauer R, Czeisler C: Dose-response relation-
ships for resetting of human circadian clock by light. Nature
1996, 379:540-542.
19. Aaslid R: Developments and Principles of Transcranial Dop-
pler. In Transcranial Doppler Edited by: Newell DW, Aaslid R. Raven
Press, Ltd., New York; 1992:1-8.
20. Brown EN, Choe Y, Shanahan TL, Czeisler CA: A mathematical
model of diurnal variations in human plasma melatonin
levels. Am J Physiol 1997, 272:E506-E516.
Publish with BioMed Central and every
scientist can read your work free of charge
"BioMed Central will be the most significant development for
disseminating the results of biomedical research in our lifetime."
Sir Paul Nurse, Cancer Research UK
Your research papers will be:
available free of charge to the entire biomedical community
peer reviewed and published immediately upon acceptance
cited in PubMed and archived on PubMed Central
yours — you keep the copyright
Submit your manuscript here:
/>BioMedcentral
Journal of Circadian Rhythms 2005, 3:3 />Page 11 of 11
(page number not for citation purposes)
21. Czeisler CA, Allan JS, Strogatz SH, Rhonda JR., Sanchez R, Rios CD,
Freitag WO, Richardson GS, Kronauer RE: Bright light resets the
human circadian pacemaker independent of the timing of
the sleep wake cycle. Science 1986, 233:667-671.
22. Strogatz SH, Kronauer RF, Czeisler CA: Circadian pacemaker
interferes with sleep onset at specific times each day: role of
insomnia. Am J Physiol 1987, 253:R172-R178.
23. Borbély AA: A two process model of sleep regulation. Human
Neurobiol 1982, 1(3):195-204.
24. Jewett ME, Wyatt JK, Ritz-De Cecco A, Khalsa SB, Dijk DJ, Czeisler
CA: Time course of sleep inertia dissipation in human per-
formance and alertness. J Sleep Res 1999, 8:1-8.
25. Van Dongen HPA, Dinges D: Circadian rhythms in fatigue, alert-
ness, and performance. In Principles and Practice of Sleep Medicine
3rd edition. Edited by: Kryger MH, Roth R, Dement WC. Saunders,
Philadelphia; 2000:391-399.
26. Madsen PL, Holm S, Vorstrup S, Friberg L, Lassen NA, Wildschiodtz
G: Human regional cerebral blood flow during Rapid Eye
Movement Sleep. J Cereb Blood Flow Metab 1991, 11:502-507.
27. Madsen PL, Vorstrup S: Cerebral blood flow and metabolism
during sleep. Cerebrovascul Brain Metab Rev 1991, 3:281-296.
28. Kuboyama T, Hori A, Sato T, Mikami T, Yamaki T, Ueda S: Changes
in cerebral blood flow velocity in healthy young men during
overnight sleep and while awake. Electroencephalogr Clin
Neurophysiol 1997, 102:125-131.
29. Wu J, Gillin J, Bucshsbaum M, Hershey T, Hazlett E, Sicotte N, Bunney
W: The effect of sleep deprivation on cerebral glucose met-
abolic rate in normal humans assessed with Positron Emis-
sion Tomography. Sleep 1991, 14:155-162.
30. Drummond SP, Brown GG, Stricker JL, Buxton RB, Wong EC, Gillin
JC: Sleep deprivation-induced reduction in cortical functional
response to serial subtraction. NeuroReport 1999,
10(18):3745-3748.
31. Thomas M, Sing H, Belensky G, Holcomb H, Mayberg H, Dannals R,
Wagner H, Thorne D, Popp K, Rowland L, Welsh A, Balwinski S, Red-
mond D: Neural basis of alertness and cognitive performance
impairments during sleepiness. I. effects of 24 h of sleep dep-
rivation on waking human regional brain activity. J Sleep Res
2000, 9:335-352.
32. Volk S, Kaendler SH, Weber R, Georgi K, Maul F, Hertel A, Pflug B,
Hor G: Evaluation of the effects of total sleep deprivation on
cerebral blood flow using single photon emission computer-
ized tomography. Acta Psychiatr Scand 1992, 86(6):478-483.
33. Wu JC, Gillin JC, Buchsbaum MS, Hershey T, Johnson JC, Bunney WE:
Effect of sleep deprivation on brain metabolism of depressed
patients. Am J Psychiatry 1992, 149(4):538-543.
34. Volk SA, Kaendler SH, Hertel A, Maul FD, Manoocheri R, Weber R,
Georgi K, Pflug B, Hor G: Can response to partial sleep depriva-
tion in depressed patients be predicted by regional changes
of cerebral blood flow? Psychiatry Res 1997, 75(2):67-74.
35. Glotzbach SF, Heller HC: Temperature regulation. In Principles
and Practice of Sleep Medicine 3rd edition. Edited by: Kryger MH, Roth
R, Dement WC. Saunders, Philadelphia; 2000:289-304.
36. Roy CW, Sherrington CS: On the regulation of the blood supply
of the brain. J Physiol Lond 1890, 11:85-108.
37. Nybo L, Nielsen B: Middle cerebral artery blood flow velocity
is reduced with hyperthermia during prolonged exercise in
humans. J Physiol Lond 2001, 534:279-286.
38. Nybo L, Moller K, Volianitis S, Nielsen B, Secher NH: Effects of
hyperthermia on cerebral blood flow and metabolism during
prolonged exercise in humans. J Appl Physiol 2002, 93(1):58-64.
39. Van Dongen HP, Maislin G, Kerkhof GA: Repeated assessment of
the endogenous 24 hour profile of blood pressure under con-
stant routine. Chronobiol Int 2001, 18(1):85-98.
40. Spengler C, Czeisler C, Shea S: An endogenous circadian rhythm
of respiratory control in humans. J Physiol Lond 2000,
526(3):683-694.
41. Aaslid R, Linegaard KF, Sortegerg W, Nornes H: Cerebral autoreg-
ulation dynamics in humans. Stroke 1989, 20:45-52.
42. Markwalder TM, Grolimund P, Seiler RW, Roth F, Aaslid R: Depend-
ency of blood flow velocity in the middle cerebral artery on
end-tidal carbon dioxide partial pressure – A transcranial
ultrasound Doppler study. J Cereb Blood Flow Metab 1984,
4(3):368-72.
43. Wroe SJ, Sandercock P, Bamford J, Dennis M, Slattery J, Warlow C:
Diurnal variation in incidence of stroke: Oxfordshire Com-
munity St. Project. Br Med J 1992, 304:155-157.
44. Elliot W: Circadian variation in the timing of stroke onset:
Meta analysis. Stroke 1998, 29:992-996.
45. Muller JE, Stone P, Turi ZG, Rutherford JD, Czeisler CA, Parker C,
Poole K, Passamani E, Roberts R, Robertson T, Sobel B, Wilerson JT,
Braunwald E, the MILIS Study Group: Circadian variation in the
frequency of onset of acute myocardial infarction. N Engl J Med
1985, 313(21):1315-1322.
46. Stergiou G, Vemmos K, Pliarchopoulou K, Synetos A, Roussias L,
Mountokalakis T: Parallel morning and evening surge in stroke
onset, blood pressure, and physical activity. Stroke 2002,
33:1480-1486.
47. Tsementzis SA, Gill JS, Hitchcock ER, Gil SK, Beevers DG: Diurnal
variation of activity during the onset of stroke. Neurosurgery
1985, 17:901-904.
48. Feng DL, Murillo J, Jadhav P, McKenna C, Gebara OC, Lipinska I,
Muller JE, Tofler GH: Upright posture and maximal exercise
increase platelet aggregability and prostacyclin production
in healthy male subjects. Br J Sports Med 1999, 33(6):401-404.
49. Toffler GH, Brezinski D, Shafer AI, Czeisler CA, Rutherford JD,
Willich SN, Gleason RE, Williams GH, Muller JE: Concurrent
morning increase in platelet aggregability and the risk of
myocardial infarction and sudden cardiac death. N Engl J Med
1987, 316:1514-1518.