Báo cáo y học: "Statistical methods for detecting and comparing periodic data and their application to the nycthemeral rhythm of bodily harm: A population based study" ppsx
Bạn đang xem bản rút gọn của tài liệu. Xem và tải ngay bản đầy đủ của tài liệu tại đây (392.71 KB, 10 trang )
RESEA R C H Open Access
Statistical methods for detecting and comparing
periodic data and their application to the
nycthemeral rhythm of bodily harm:
A population based study
Armin M Stroebel
1*
, Matthias Bergner
1
, Udo Reulbach
1,2
, Teresa Biermann
1
, Teja W Groemer
1
, Ingo Klein
3
,
Johannes Kornhuber
1
Abstract
Background: Animals, including humans, exhibit a variety of biological rhythms. This article describes a method for
the detection and simultaneous comparison of multip le nycthemeral rhythms.
Methods: A statistical method for detecting periodic patterns in time-related data via harmonic regression is
described. The method is particularly capable of detecting nycthemeral rhythms in medical data. Additionally a
method for simultaneously comparing two or more periodic patterns is described, which derives from the analysis
of variance (ANOVA). This method statistically confirms or rejects equality of periodic patterns. Mathematical
descriptions of the detecting method and the comparing method are displayed.
Results: Nycthemeral rhythms of incidents of bodily harm in Middle Franconia are analyzed in order to
demonstrate both methods. Every day of the week showed a significant nycthemeral rhythm of bodily harm. These
seven patterns of the week were compared to each other revealing only two different nycthemeral rhythms, one
for Friday and Saturday and one for the other weekdays.
Background
Analysis of biological activities that fluctuate throughout
the day is common in various fields o f medicine. Blood
pressure and heart rate as well as the occurrence of
acute cardiovascular disease are su bject to a twenty-four
hour rhythm (also referred to as circadian or nycthem-
eral rhythm) [ 1,2]. This rhythm is also present in epi-
sodes of dyspnoea in no cturnal asthma [3], intraocular
pressure [4,5], and hormonal pulses [6-8]. Nycthemeral
fluctuations in neurotransmitters and hormones have
been discussed as influencing human behavior [9-11].
Suicide as well as parasuicide and violence against the
person show day-night variation [12-14]. Assaults pre-
senting to trauma centers display a distinct nycthemeral
pattern [8-12]. In this s tudy the nycthemeral r hythm of
violent crime rates is analyzed to demonstrate a
detection method and a comparison method suitable for
twenty-four hour time series, but not limited to this
sampling period.
Much mathematical effort was invested to detect and
model the dependency on the time of day [15-19].
A classification of the data by identifying similarities and
distinctions requires statistical methods [20-25].
The cosinor analysis is a common approach [26] that
descri bes data by a single cosine function with fixed fre-
quency plus a constant (single-harmonic model) yielding
the three parameters amplitude, phase and mean [27].
Corresponding parameters were compared one by one to
compare two or more time series modeled by cosinor ana-
lysis [28,29]. A multivariate technique is applied in this
study aiming to compare several periodic patterns simulta-
neously. Models allowing more than one frequency (multi-
harmonic model) show no graphic equivalent for the
parameters amplitude and phase. Multi-harmonic models
have been used to describe human core-temperature [18],
blood pressure and incidence of angina [23] as well as in
* Correspondence:
1
Department of Psychiatry and Psychotherapy, University of Erlangen-
Nuremberg, Schwabachanlage 6, 91054 Erlangen, Germany
Full list of author information is available at the end of the article
Stroebel et al. Journal of Circadian Rhythms 2010, 8:10
/>© 2010 Stroebel et al; licensee BioMed Central Ltd. This is an Open Access article distributed under the t erms of the Creative Commons
Attribution License (http: //creativecommons.org/licenses/by/2.0), which permits unrestricted use, distribution, and reproduction in
any medium, provided the original work is properly cited.
the nycthemeral distribution of violent crime rates,
although the true waveform of nycthemeral rhythms is
still a matter of deb ate. The purpose of this study is to
identify the underlying frequencies and to compare the
resulting periodic patterns via Fourier transform. This
transform is common use in various fields of medicine
[16] as well as other scientific areas. The explained var-
iance of individual oscillatio ns is utilized to detect the
inherent periodic patterns of the data.
A modification of the analysis of variance (ANOVA) is
used to compare two or more time series with periodic
patterns. The typical ANOVA tests whether the means
of several groups are equal. The scope of ANOVA is
extended to periodic patte rns by combining it with
Fourier analysis. This new test rejects or confirms equal-
ity of multiple oscillating time series.
To demonstrate both methods, the oscillations of violent
crimes in Middle Franconia, Bavaria/Germany from 2002
to 2005, were analyzed. Nycthemeral rhythms of bodily
harm were identified on all seven days of the week. The
seven patterns of the week were compared to each other
revealing only two different nycthemeral rhythms. We
demonstrate that the nycthemeral rhythms on Friday and
Saturday are equal and d iffer significantly from the
rhythms of the other weekdays, which are then equal again.
To compare our method with the co sinor method a n
analysis of the same data is performed and yields no
strong evidence of different rhythms.
The simultaneous comparison of a greater number of
nycthemeral rhythms is made possible by the use of the
mathematical methods described in this study. A need
for such procedures derives from the prospect of devel-
oping a prediction model for violent crime rates which
is of immediate interest for public services such as social
facilities, police departments and hospitals.
The section detection method contains a procedure to
find the inherent frequencies of the data, the section
Fourier Anova describes the comparison method, the
results section illustrates both methods by analyzing
nycthemeral rhythms of offenses against the person caus-
ing bodily harm and in the conclusion limitations, modi-
fications and alternatives to our methods are discussed.
Methods
Detection method
A statistical test for finding th e frequencies of oscillating
data is described. Using harmonic frequencies the data are
modeled as a sum of sine and cosine oscillations and a
Fourier transform is performed. In our case the Fourier
transform equals an ordinary least squares. All frequencies
are tested for significance. The ratio of explained variance
of a frequency and remaining variance acts as test statistic.
Model selection is carried out by a Bonferroni-Holm
Method (see [30]).
Fitting harmonic models to nycthemeral rhythms is a
common procedure [31-33]. The detection method is
ancillary, its output is used as input for the comparison
method (see section Fourier ANOVA). From a numeri-
cal vantage point linear least squares with orthonormal
regressors are applied. From a linear algebra perspective
we choose a specific set of vectors forming an orthonor-
mal basis and change basis. Statistical methods are
applied to search for single coordinates of the data (rela-
tive to the new basis) that are “large” compared to the
other coordinates. The orthonormal basis ensures inde-
pendent and normal distributed regression coefficients;
thus choosing significant frequencies (i.e. model selec-
tion) is straightforward. Furthermore the orthonormal
regressors are necessary for our extension o f ANOVA
described in the section Fourier ANOVA.
The model for our data is
xa ftb ft tn
tj
j
jj jt
=++=
∑
cos( ) sin( ) ,22 1
(1)
with white noise . Constant terms are omitted. So a
time series sampled n times with a fixed sampling inter-
val, homoscedasticity and uncorrelated noise and with-
out a linear trend or missingvaluesisassumed.The
regressors have the harmonic frequencies
f
j
n
j
n
j
==
⎢
⎣
⎢
⎥
⎦
⎥
, 1
2
.
(2)
By this choice the regressors cos(2πf
j
t) and sin(2πf
j
t)
are an orthogonal basis of R
n
. Estimating a and b with
ordinary least squares against the normalized regressors
yields independent and normal distributed coefficients.
To determine significant frequenci es we search for large
coefficients a and b by a method similar to a Wald-sta-
tistic and by a Bonferroni-Holm procedure [30].
The null hypotheses are
H
j
0
: a
j
= b
j
=0,or:“no sig-
nificant periodic pattern with frequency f
j
in the data”.
To test these hypotheses
cab
jjj
222
=+
(3)
is calculated, mimicking a periodogram. The value
c
j
2
can be interpreted as the explained variance of fre-
quency f
j
,furthermorec
j
is invariant under time-shift
of the data. Then c is sorted in descending order a
F -distributed test statistic is calculated:
T
c
c
Fjn
j
j
i
ij
nj
==−
<
−
∑
2
2
22
11~,
,
(4)
Stroebel et al. Journal of Circadian Rhythms 2010, 8:10
/>Page 2 of 10
which is tested on the corrected significance level
11
1
−− ≈
−
−
()
nj
nj
.IfT
j
does not exceed the critical
value for a specific j, then all T
i
with i>jare not tested
anymore. This test yields a set of significant frequencies.
A Fourier approximation ℱ
F
ofthedataisobtainedby
evaluating equation 1 using only a subset F of the har-
monic frequencies (e.g. the signifi cant frequencies) and
their corresponding amplitudes:
Ff
fF
f
xa ftb fttn() cos( ) sin( ), .=+=
∈
∑
221
(5)
The Fourier approximation filters the periodic compo-
nents out o f the data; it i s a denoising procedure. The
data is decomposed in a fundamental frequency and its
multiple, the harmonics. T he Fourier coefficients indi-
cate the strength, i.e. the amplitude of these oscillations.
Usually the fundamental frequency has the highest
amplitude and the strength decreases for greater harmo-
nics. The influence of the harmonics can reach from
only small adjustments of the fundamental oscillations
to generating additional maxima, minima or plateaus.
Comparison method (Fourier ANOVA)
A statistical test for comparing periodic patterns of
grouped data is described. The test dete rmines if the
rhythm of the groups are equal or not. The mathematical
conceptoftheANOVAistransferredtoperiodicpat-
terns by substituting the mean estimators for Fourier
approxim ations. This test compares the periodic patterns
in its entirety. The orthogonal regressors mentioned in
the section Detection method are necessary for this test.
Suppose data divided in k groups with n measure-
ments for every group and denote this data as x
t,j
(t =1
n, j =1 k). The F distributed ANOVA test statistic
for equal means in every group is
1
1
1
2
2
2
df
xx
df
xx
j
tj
tj j
tj
., .,.
,
,.,
,
.
−
()
−
()
∑
∑
(6)
To compare not the means but the periodic patte rn of
every group we substitute the mean estimators for the
Fourier approximation (see 5):
Tx
df
xx
df
xx
F
Fj F
tj
tj F
tj
j
()
(() ())
(())
., .,.
,
,
,
.,
=
−
−
∑
∑
1
1
1
2
2
2
~~.
,
F
df df
12
(7)
The frequencies F are chosen as described in the section
Detection method: the detection method is applied to
every group of x.Testingwithd =|F| frequencies the
degrees of freedom are df
1
=2dk -2d and df
2
= nk -2dk.
The test uses the same idea as the ANOVA: Calculate
the variance within the groups, i.e. the deviation of the
data from its Fourier approximation within every group.
Furthermore calculate the variance between the groups,
i.e. the deviation the Fourier approximation of the single
groups and the Fourier approximation of the whole
data. If all groups show the same rhythm then the var-
iance between the groups should have roughly the same
magnitude as the variance within the groups. Conversely
a large variance between the groups argues for an
impact of a group on the rhythm.
In the following we will scrutinize the distribution of
the test statistic in equation 7: We show that the test sta-
tistic T
F
in equation is F distributed. Cochran’s Theorem,
as stated in [34], yields a c
2
distribution of the nominator
and the denominator of equation 7. To apply this ther-
oem the test statistic needs a matrix representation.
The Fourier approximation in equation 5 has a matrix
representation: For f Î ℝ define the column vectors
ckfn ft
skfn ft
f
n
ctn
f
n
st
:
:
=
=
(,)(cos( ))
(,)(sin( ))
2
2
01
0
=−
=
n−1
(8)
with normalization constants k
c
(f, n),k
s
(f, n). Then
then Fourier approximation can be written as
Ff
n
fF
f
nT
f
n
f
nT
xssccx() ( ) ( ) .=+
⎛
⎝
⎜
⎜
⎞
⎠
⎟
⎟
∈
∑
(9)
Let
M
F
n
be this transformation matrix of ℱ
F
, then
M
F
n
is a symmetric projection, i.e.
() , () .MM MM
F
n
F
n
F
nT
F
n2
==
(10)
Furthermore pile the colu mns of the data x Î R
n,k
one
below the other and call this vector y Î R
nk
.Definethe
matrices
AM
F
nk nk nk
1
:
()()
=∈
×
(11)
and
A
M
M
M
F
n
F
n
F
n
nk nk
2
0
0
:.
()()
=
⎛
⎝
⎜
⎜
⎜
⎜
⎜
⎞
⎠
⎟
⎟
⎟
⎟
⎟
∈
×
(12)
Stroebel et al. Journal of Circadian Rhythms 2010, 8:10
/>Page 3 of 10
Because A
1
and A
2
are symmetric projections the test
statistic T
F
in equation 7 can be written as
Tx
df
AAy
df
Ay
df
AAyAAy
F
()
|( ) |
|( ) |
(),()
=
−
−
=
〈− −
1
1
1
1
21
2
2
2
2
1
21 21
〉〉
〈− − 〉
=
−−
−
1
1
1
2
22
1
21 21
2
2
df
Ay Ay
df
yA A A Ay
df
yA
TT
T
(),()
()()
()
TT
T
T
Ay
df
yA Ay
df
yAy
()
()
()
.
−
=
−
−
2
1
21
2
2
1
1
(13)
Now the test statistic has a represen tation suitable for
Cochran’s Theorem. All that is left is the orthogonality
assumption for the projections A
2
- A
1
and
− A
2
.The
specific form of the harmonic frequencies is again uti-
lized: The image of A
1
is spanned by
s
f
nk
and
c
f
nk
(f Î F).
The image of A
2
is spanned by the vectors
s
fj
n
()
and
c
fj
n
()
filled up with the zero vector 0 =(0 0)Î ℝ
n
:
(),,,
(
()
00 00
00
m
fj
n
km
nk
m
cfFmk
times times
t
−−
∈∈ =−
1
01
iimes times
sfFmk
fj
n
km
nk
()
), , .00
−−
∈∈ =−
1
01
(14)
By definition of the harmonic frequencies (see equa-
tion 2) the follo wing equa tion holds except for normali-
zation factor:
sss
ccc
f
nk
f
n
f
n
k
f
nk
f
n
f
n
k
=
=
(, ,)
(, ,).
times
times
(15)
So the image of A
1
is a subset of the image of A
2
and
it holds:
AA AA A
12 21 1
==.
(16)
This equation shows the orthogonality of t he projec-
tions of Cochran’s Theorem.
Results
Nycthemeral rhythm of violent crime rates are analyzed
to demonstr ate both the detection and comparison
method.
The study included 15881 crimes of violent behavior
(without suicides) which were filed at the Police Depart-
ment of Middle Franconia, Bavaria/Germany between
January 1, 2002 and December 31, 2005, and gathered
into the EVioS (Erlangener Violence Studies [35]) data
base. Bodily harm as defined in § 223 German Criminal
Code is more closely examined. We investigate if the
seven days of the week show different nycthemeral
rhythms of bodily harm. Data handling and calculations
were performed by Microsoft Excel
®,Matlab® an d R.
Significance level was set to 0.05.
In the following, the detection method shows the exis-
tence of nycthemeral rhythms of bodily harm on all
seven days of the week. A comparison of these seven
rhythms reveals only two different nycthemeral rhythms,
one describing crime rat es on F riday and Saturday, the
other on Sunday to Thursday. In order to analyze a
more homogeneous sample, only crimes committed by
male offenders and not occurring on holidays such as
New Year’s Eve are further surveyed; this sample con-
sists of 11402 cases. The investigated data x Î ℝ
24 × 7
are the number of violent acts x(h, d) at a specific hour
h Î {1 24} and “day” d Î {1 7}.Wedefinethefirst
„da y“ as the 24 hours sta rting Sunday at 9:00 a.m. and
denote it with d1. This definition is adapted to the data:
at 9:00 a.m. violent crime rates of all seven days are
similar and a renewal of the time series occurs (see Fig-
ure 1). Furthermore the second “day” d2 is defined as
the 24 hours starting Monday at 9:00 a.m. lasting till
Tuesday 9:00 a.m. and so forth.
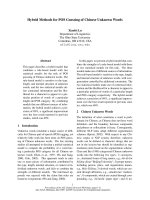
The histogram in Figure 2 shows the distribution of
violent crimes per “day” with 95% confidence intervals.
In particular the number of crimes on d6andd7 are dis-
tinct. We are interested in the nycthemeral rhythm and
not in tot al numbers; so we normalize the data by divid-
ing the number of crimes at “day” d and hour h by the
number of crimes on “day” d. The normalized data are
called y Î ℝ
24 × 7
. So every column of y sums up to 1 and
thus can be interpeted as relative frequency of crimes.
The assumptions of our model in equation 1 are satis-
fied by the data y: There is no trend or missing values
and a constant time between two consecutive samples. x
consists of count data, so x(h, d) follows a Poisson dis-
tribution and the normalized data y(h, d)arewell
approximated by a normal distribution. The sequence y
(h, d)
h = 1 24,d = 1 7
is assumed to be independent,
because sites of crimes are spatially separated or o ffen-
ders do n’t even know each other. Homoscedasticity
(constant variance of the residuals) and P oisson
Stroebel et al. Journal of Circadian Rhythms 2010, 8:10
/>Page 4 of 10
distributions do not make a good match: For Poisson
random variable the mean equals the variance and we
assume a oscillating number of crimes. So the residuals
will not automatically be homoscedastic and are after-
wards tested for “whiteness” byaKolmogorov-Smirnov
test [36], a Lilliefors test [37] (both for normal distribu-
tion), a Breusch-Godfrey test [38,39] and a Wald Wol-
vowitz runs test [40] (for absence of autocorrelation, the
latter is applied to the signs of the residuals). The data
are also tested for stationary cycles by a Canova-Hansen
[41] test and a Kwiatkowski-Phillips-Schmidt-Shin test
[42]. We also divided the data in 10 disjoint random
subsamples to avoid testing hypotheses suggested by the
data.
Applying the detection method to the columns of y
reveals significant nycthemeral rhythm on every “day”. All
seven “days” showed significant periods of length 24 and
12 hours except d3andd4, which showed only a signifi-
cant 24 hour period. So every “day” shows a nycthemeral
rhythm of bodily harm. Note that by analyzing single days
of the week, i.e. columns of y, which have a length of 24,
we restrict our search to the frequency
1
24h
and its integer
multiple (see the model in equation 1 and its description).
Wehavetworeasonfordoingso:firstwehaveapriori
knowledge: Th e sun is a zeitgeber for the human biological
clock [43], that argues for a 24 hour rhythm. Furthermore
the week is the time unit that governs the working life in
Germany and separates it in five working days (Monday to
Friday) and two weekend days (Saturday a nd Sunday). Sec-
ond we get a posteriori knowledge: by applying our detec-
tion method to the whole data y which revealed no other
significant periods, especially no significant period greater
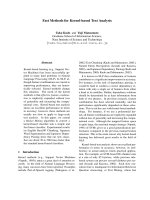
than 24 hours a nd by calculating a periodogram of the data
(see Figure 3), which reveals only a day period, a week per-
iod a nd their corresponding harmonics.
Applying the comparison method to d1tod7(fre-
quencies
f =∈(,)
1
24
1
12
2
and number of samples
n = 7·24) generates a p-value smaller than 0.05 (F =
18.1639, df
1
=24,df
2
= 140). So there are at least two
different periodic patterns in the data. This finding is
verified in the 10 ra ndomly-genera ted subsamples: com-
paring the period of the subsamples yields p-values
within the interval [1.04 · 10
-10
, 1.3 · 10
-3
].
Comparing d6andd7(n = 2 · 24, f as above) yields a
p-value of 0.3 582 (F = 1.13 52, df
1
=4,df
2
=40).So
9 33 57 81 105 129 153
0
0.03
0.06
0.09
0.12
cumulative time [hour]
relative frequency of crimes
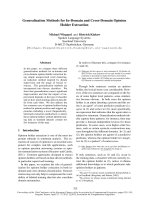
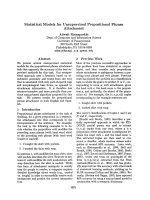
Figure 1 Normalized crime rates and its Fourier approx imations. Black dots show the relative frequency of 11402 crimes of bodily harm
committed in the years 2002 to 2005 in Middle Franconia, Bavaria/Germany during the 168 hours of a week, starting Sunday at 9:00 a.m.
Nycthemeral rhythms are visible. Solid line show the Fourier approximation of relative number of crimes versus cumulative time in hours,
starting at 9:00 a.m. Light gray line shows the Fourier approximations of normalized crime rates for d1tod5 (Sunday 9:00 a.m. to Friday 9:00 a.
m.); the dark gray line for d6 and d7 (Friday 9:00 a.m. to Sunday 9:00 a.m.). A difference of these two rhythms is a shift of the maxima from 10:00
p.m. to 1:00 a.m. Furthermore the maxima of the second rhythm are higher than those of the first.
Stroebel et al. Journal of Circadian Rhythms 2010, 8:10
/>Page 5 of 10
d1 d2 d3 d4 d5 d6 d7
0
750
1500
2250
3000
"day"
number of crimes
Figure 2 Distribution of crimes of bodily harm on the seven days of a week. Distribution of the 11402 crimes of bodily harm committed in
the years 2002 to 2005 in Middle Franconia, Bavaria/Germany on the seven “day” of a week, with 95% confidence intervals. d1 is the 24 hour
timespan starting at Sunday 9:00 a.m. and ending at Monday 9:00 a.m. and so on.
12 24 42 56 84 168
0
1
period [hour]
spectral density [au]
Figure 3 Periodogram of incidents per hour. The periodogram is applied to the 35064 hours of the four year sampling period. The period of
168 hours (one week), 24 hours (one day) and their corresponding harmonic frequencies are tagged with circles. All high peaks of the spectral
density coincide with these frequencies. The other shown periods have relatively small density.
Stroebel et al. Journal of Circadian Rhythms 2010, 8:10
/>Page 6 of 10
there is no significant difference between d6andd7. So
Friday and Saturday show the same nycthemeral rhythm
of bodily harm. By testing this hypothesis in the 10 sub-
samples p-values in the interval [0.15, 0.98] are
obtained.
We found that nycthemeral rhythm of d6andd7is
different from the rhythm of d1tod5. For statistical
verification, the comparison method was applied to the
93 partitions P ⊂ {1 7} of the seven days, that contain
at least one element o f {1, 2, 3, 4, 5} and at least one
element of {6, 7}. So w e tested the 93 hypothesis H
P
:
“There is no significant difference between the “day” of
partition P”. The comparison method yields p-values
smaller than 8.5 · 10
-11
.Bonferroni’s inequal ity yields an
upper bound for the p-value of the hypothesis ∪ H
P
(“There is at least one of the 93 partitions without sig-
nificant difference between the nycthemeral rhythms of
the “day” of this partit ion”): P (∪H
P
)<93·8.5·10
-11
<0.05 and thus reject this hypothesis. We accept the
alternative hypothesis: “the “day” of all 93 partitions
have significant different nycthemeral rhythms”.
Comparing only d1tod5(n = 5 · 24, f as above) yields
a p-value of 0.0515 (F = 1.7372, df
1
=16,df
2
=100).
Applying this test to the 10 subsamples yields p-values
within [0.0457, 0.93], one p-value was lower than 5%.
Testing the 26 partitions of {1 5}, which have at least
two elements yields p-values ranged from 0.0047 to
0.9908, none was smaller than Bonferroni-corr ected sig-
nificance level
5
26
0 0019
%
.=
.Altogetherwefound
some significant differences within d1tod5, but con-
sider them marginal. So there are only two significantly
different nycthemeral rhythms, one describing crime
rates on d6andd7, the other on d1tod5,seeFigure1
for a plot of these two rhythms.
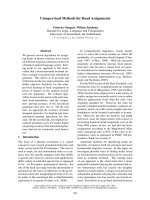
Now the “whiteness“ of the residuals of the fit of d1to
d5 is tested. Figure 4 shows a quantile-quantile-plot of
the residuals against a standard normal distribution,
which is a lmost linear, arguing for normal distributed
residuals. A formal test for normal distribution is the
Kolmogorov-Smirnov t est. Testing the residuals divided
by their estimated standard deviation against the stan-
dard normal distribut ion yields p =0.96,d
ks
= 0.0440,
n = 120.
Autocorrelation of t he residuals biases the estimation
of the coefficients and is a evidence for a misspecified
model. A Breusch-Godfrey test for autocorrelation up to
order 23 does also not reject the null hypothesis
(p = 0.155,
23
2
= 29.8). So these residuals show no sig-
nificant autocorrelation.
Stationarity is a pro perty often desired in time series
analysis, particular in econometrics [44,45]. A stationary
process fluctuates steadily around a deterministic trend,
a nonstationary series is subject to persistent random
shocks or can even be transient. If the variables in the
regression model are not stationary, then the standard
assumptions for asymptotic analysis may not be valid. In
other words, the usual F-ratios will not follow a F-
distribution, so we cannot validly undertake hypothesis
tests about the regression parameters. The Canova-Han-
sen Test and the Kwiatkowski-Phillips-Schmidt-Shin
Test did not reject the null Hypothesis of stationary sea-
sonal cycles. Applying these tests to the residuals of the
fit of d6 and d7 yields the same results (p = 0.369, d
ks
=
0.1290, n =48andp =0.350,
23
2
=25.0,norejection
of the null Hypothesis by Canova-Hansen Test and
Kwiatkowski-Phillips-Schmidt-Shin Test).
Though our Fourier approximation underestimates the
peaked crime rates around midnight the coefficient of
determination of the single days is within [0.86, 0.96].
Overall the model is satisfying.
Conclusion
Two statistical methods that will enlarge the scientists
toolbox for analyzing multi-harmonic o scillations were
described. As the example demonstrated the methods
can be used to detect and compare multi-harmonic pat-
terns in biological rhythm data.
Theorthogonalityofthesineandcosinevectorsis
intensively used to calculate the exact distribution of
certain test statistics, not just the approximate distribu-
tion for large sample sizes. But this orthogonality also
limits the set of fr equencies in our multi-harmonic
model. In this special case our detection method is an
extension of the cosinor-method to multi harmonic
models. It also includes a model selection process. Our
comparison method uses the whole periodic patterns
instead of single parameters. This is an enhanc ement of
the commonly used ANOVA with sing le parameter
“mean”. Furthermore the exact distribution of t he test
statistic is known, not just an approximate or a limiting
distribution for large sample sizes. This can in some
cases increase the te sts power. In addition th e method
allows a simultaneous compariso n of several time series.
This allows to test the hypothesis if “at least one time
series shows a different rhythm” without having any a
priori knowledge which one could be deviant (this situa-
tion can occur if for example the study design or the
data does not allow a partition in a control group and a
treatment group).
Problems may occur with missing values (no ON -
basis), trends in the data (m odel is not valid) or the
choice of the number of samples, when no a priori
knowledge of the inherent periods of the data is avail-
able. To derive a more robust version of the statistical
test use the rank of the residuals instead the residuals
Stroebel et al. Journal of Circadian Rhythms 2010, 8:10
/>Page 7 of 10
analogous to the ANOVA on ranks. Identifying the
method’s limitations will help improve it and make it
more universal, which is one of the reasons for provid-
ing a detailed description of the method calculation
steps.
Likelihood ratio tests are in common use for model
selection or hypothesis testing and could be an alterna-
tive to our tests. Least squares estimates of the coeffi-
cients coincide with the maximum likelihood estimates,
if the residua ls are normal distributed and homoscedas-
tic. Our tests confirm, that the residuals have these
properties. So there is neither a gain nor a loss in
switching to likelihood ratio tests, which are based on
maximum likelihood estimates. Furthermore only the
limiting distribution of t he likelihood ratio test statistic
for large sample sizes is known, whereas the exact distri-
bution of our test statistics is specified. The described
detection method uses all harmonic frequencies, because
potentially all frequencies could be inherent in the data.
However this approach can increase the false negative
rate of the test, because the corrected significance level
becomes too small. So we are using a conservative test.
As Albert and Hunsberger [31] point out there is a
“wide range of circadian patterns which can be charac-
terized with a few harmonics” and that they “recom-
mend choosing between one, two, or three harmonics”.
We too found only two significant harmonics in our
analysis and observed a good coefficient of determina-
tion and white noise residuals. So if some frequencies
are ruled out by a priori knowledge the detection
method can be executed with fewer harmonics to
increase the tests power.
We compared our methods with the cosinor method
[26], which fits a single cosine wave with a user defined
period to the data: coe fficien t of determination is 0.732
for a 24 hour period and 0.2 for a 12 hour period when
fitting Friday and Saturday. Our detection method
achieved a coefficient of determination of 0.86. The
cosinor method also calculated the amplitude of the 24
hour periods for workdays and weekends: they differed
by only 5%. Analyzing the amplitudes of the first harmo-
nic yields overlapping confidence intervals. So the cosi-
nor method gives no strong evidence for different
rhythms on workdays and weekends. A significant dif-
ference between workdays and week ends is revealed by
simultaneously comparing all weekdays as we did in
section.
The findings of a 24 hour period on every day could
be for example associated with the hormones testos-
teron and serotonin. Both of them show a nycthemeral
rhythm [7,8] and are linked to violent behavior [46,47].
The different rhythm on Friday and Saturday could be
−2.5 −1.25 0 1.25 2.5
−0.02
−0.01
0
0.01
0.02
quantiles of the standard normal distribution
quantiles of standardized residuals
q−q−plot of residuals of "day" 6 to 7
Figure 4 Quantil-quantil-plot of residuals. Quantil-quantil-plot of residuals of d6andd7 against standard normal quantiles (black cross). The
gray line joins the first and the third quartile. The absence of large deviations between the black crosses and the gray line implies a normal
distribution of the residuals.
Stroebel et al. Journal of Circadian Rhythms 2010, 8:10
/>Page 8 of 10
caused by exogenous factors like increased alcohol con-
sumption [48].
Acknowledgements
This work was supported by the Interdisciplinary Center of Clinical Research
(IZKF) at the University hospital of the University of Erlangen-Nuremberg.
The authors wish to thank Joanne Eysell for proofreading the manuscript.
Author details
1
Department of Psychiatry and Psychotherapy, University of Erlangen-
Nuremberg, Schwabachanlage 6, 91054 Erlangen, Germany.
2
Department of
Public Health and Primary Care, Trinity College Centre for Health Sciences,
Adelaide and Meath Hospital, incorporating the National Children’s Hospital,
Tallaght, Dublin 24, Ireland.
3
Department of Statistics and Econometrics,
University of Erlangen-Nuremberg, Lange Gasse 20, 90403 Nuremberg,
Germany.
Authors’ contributions
AS contributed to the conception and the design of the study, analyzed the
data and drafted the manuscript. UR contributed to the conception and the
design of the study. TB acquired the data. IK contributed to the analysis. JK
contributed to the intellectual content. TG, MB and all other authors read
and approved the final version of the article.
Competing interests
The authors declare that they have no competing interests.
Received: 23 August 2010 Accepted: 8 November 2010
Published: 8 November 2010
References
1. Manfredini R, Boari B, Smolensky MH, Salmi R, la Cecilia O, Maria
Malagoni A, Haus E, Manfredini F: Circadian variation in stroke onset:
identical temporal pattern in ischemic and hemorrhagic events.
Chronobiol Int 2005, 22(3):417-53.
2. Pierdomenico SD, Bucci A, Costantini F, Lapenna D, Cuccurullo F,
Mezzetti A: Circadian blood pressure changes and myocardial ischemia
in hypertensive patients with coronary artery disease. J Am Coll Cardiol
1998, 31(7):1627-34.
3. Martin RJ: Nocturnal asthma: circadian rhythms and therapeutic
interventions. Am Rev Respir Dis 1993, 147(6 Pt 2):S25-8.
4. Renard E, Palombi K, Gronfier C, Pepin JL, Noel C, Chiquet C, Romanet JP:
Twenty-four hour (Nyctohemeral) rhythm of intraocular pressure and
ocular perfusion pressure in normal-tension glaucoma. Invest Ophthalmol
Vis Sci 2009, 51(2):882-9.
5. Hara T, Tsuru T: Increase of peak intraocular pressure during sleep in
reproduced diurnal changes by posture. Arch Ophthalmol 2006,
124(2):165-8.
6. Buijs RM, Wortel J, Van Heerikhuize JJ, Feenstra MG, Ter Horst GJ, Romijn HJ,
Kalsbeek A: Anatomical and functional demonstration of a multisynaptic
suprachiasmatic nucleus adrenal (cortex) pathway. Eur J Neurosci 1999,
11(5):1535-44.
7. Nakayama K: Diurnal rhythm in extracellular levels of 5-
hydroxyindoleacetic acid in the medial prefrontal cortex of freely
moving rats: an in vivo microdialysis study. Prog Neuropsychopharmacol
Biol Psychiatry 2002, 26(7-8):1383-8.
8. Diver MJ, Imtiaz KE, Ahmad AM, Vora JP, Fraser WD: Diurnal rhythms of
serum total, free and bioavailable testosterone and of SHBG in middle-
aged men compared with those in young men. Clin Endocrinol (Oxf) 2003,
58(6):710-7.
9. Placidi GP, Oquendo MA, Malone KM, Huang YY, Ellis SP, Mann JJ:
Aggressivity, suicide attempts, and depression: relationship to
cerebrospinal fluid monoamine metabolite levels. Biol Psychiatry 2001,
50(10):783-91.
10. Lidberg L, Tuck JR, Asberg M, Scalia-Tomba GP, Bertilsson L: Homicide,
suicide and CSF 5-HIAA. Acta Psychiatr Scand 1985, 71(3):230-6.
11. Tripodianakis J, Markianos M, Rouvali O, Istikoglou C: Gonadal axis
hormones in psychiatric male patients after a suicide attempt. Eur Arch
Psychiatry Clin Neurosci 2007, 257(3):135-9.
12. Preti A, Miotto P: Diurnal variations in suicide by age and gender in Italy.
J Affect Disord 2001, 65(3):253-61.
13. Caracciolo S, Manfredini R, Gallerani M, Tugnoli S: Circadian rhythm of
parasuicide in relation to violence of method and concomitant mental
disorder. Acta Psychiatr Scand 1996, 93(4):252-6.
14. Laubichler W, Ruby M: Diurnal relations of criminal behavior. Arch Kriminol
1986, 177(5-6):176-84.
15. Artis M, Clavel JG, Hoffmann M, Nachane D:
Harmonic Regression Models:
A Comparative Review with Applications. IEW - Working Papers iewwp333,
Institute for Empirical Research in Economics, University of Zurich 2007 [http://
ideas.repec.org/p/zur/iewwpx/333.html].
16. Brown EN, Czeisler CA: The Statistical Analysis of Circadian Phase and
Amplitude in Constant-Routine Core-Temperature Data. J Biol Rhythms
1992, 7(3):177-202.
17. Celec P: Analysis of rhythmic variance-ANORVA. A new simple method
for detecting rhythms in biological time series. Biol Res 2004, 37(4 Suppl
A):777-82.
18. Indic P, Brown EN: Characterizing the amplitude dynamics of the human
core-temperature circadian rhythm using a stochastic-dynamic model. J
Theor Biol 2006, 239(4):499-506.
19. Teicher MH, Barber NI: COSIFIT: an interactive program for simultaneous
multioscillator cosinor analysis of time-series data. Comput Biomed Res
1990, 23(3):283-95.
20. Klerman EB, Jewett ME: Commentary: model building, quantitative
testing, and model comparison. J Biol Rhythms 1999, 14(6):621-4.
21. Gaffney M, Taylor C, Cusenza E: Harmonic regression analysis of the effect
of drug treatment on the diurnal rhythm of blood pressure and angina.
Stat Med 1993, 12(2):129-142.
22. Douglas AS, Strachan DP, Maxwell JD: Seasonality of tuberculosis: the
reverse of other respiratory diseases in the UK. Thorax 1996, 51(9):944-6.
23. Samel A, Wegmann HM, Vejvoda M, Maass H, Gundel A, Schutz M:
Influence of melatonin treatment on human circadian rhythmicity
before and after a simulated 9-hr time shift. J Biol Rhythms 1991,
6(3):235-48.
24. Li XM, Levi F: Circadian physiology is a toxicity target of the anticancer
drug gemcitabine in mice. J Biol Rhythms 2007, 22(2):159-66.
25. Goulet G, Mongrain V, Desrosiers C, Paquet J, Dumont M: Daily light
exposure in morning-type and evening-type individuals. J Biol Rhythms
2007, 22(2):151-8.
26. Nelson W, Tong YL, Lee JK, Halberg F: Methods for cosinor-rhythmometry.
Chronobiologia 1979, 6(4):305-23.
27. Zautcke JL, Morris RW, Koenigsberg M, Carmody T, Stein-Spencer L,
Erickson TB: Assaults from penetrating trauma in the State of Illinois. Am
J Emerg Med 1998, 16(6):553-6.
28. Tabata M, Takeshima T, Burioka N, Nomura T, Ishizaki K, Mori N, Kowa H,
Nakashima K: Cosinor analysis of heart rate variability in ambulatory
migraineurs. Headache 2000, 40(6):457-63.
29. Munakata M, Imai Y, Minami N, Sasaki S, Ichijyo T, Yoshizawa M, Sekino H,
Abe K, Yoshinaga K: Cosinor analysis of changes in circadian blood
pressure rhythm with aging in spontaneously hypertensive rats. Tohoku
J Exp Med 1990, 161:55-64.
30. Holm S: A Simple Sequentially Rejective Multiple Test Procedure. Scand
Stat Theory Appl 1979, 6(2):65-70.
31. Albert S, Hunsberger PS: On analyzing circadian rhythms data using
nonlinear mixed models with harmonic terms. Biometrics 2005,
61:1115-1120.
32. Greenhouse JB, Kass RE, Tsay RS: Fitting nonlinear models with ARMA
errors to biological rhythm data. Stat Med 1987, 6:167-183.
33. SJ P: Harmonic Analysis Applied to Seasonal Variations in Sickness
Absence. J R Stat Soc Ser C Appl Stat 1974, 23(2):103-120.
34. Hafner R: Wahrscheinlichkeitsrechnung und Statistik Springer, Wien; 1989.
35. Biermann T, Asemann R, McAuliffe C, Stroebel A, Keller J, Sperling W,
Bleich S, Kornhuber J, Reulbach U: Relationship between lunar phases and
serious crimes of battery: a population-based study. Compr Psychiatry
2009, 50(6):573-7.
36. Massey FJ: The Kolmogorov-Smirnov Test for Goodness of Fit. J Am Stat
Assoc 1951, 46(253):68-78.
37. Lilliefors HW: On the Kolmogorov-Smirnov Test for Normality with Mean
and Variance Unknown. J Am Stat Assoc 1967, 62(318):399-402.
38. Breusch T: Testing for Autocorrelation in Dynamic Linear Models. Aust
Econ Pap 1979, 17:334-355.
Stroebel et al. Journal of Circadian Rhythms 2010, 8:10
/>Page 9 of 10
39. Godfrey L: Testing Against General Autoregressive and Moving Average
Error Models when the Regressors Include Lagged Dependent Variables.
Econometrica 1978, 46:1293-1302.
40. Wald A, Wolfowitz J: On a test whether two samples are from the same
population. Ann Math Statist 1940, 11:147-162.
41. Canova F, Hansen BE: Are Seasonal Patterns Constant Over Time? A Test
for Seasonal Stability. J Bus Econ Stat 1995, 13(3):237-52.
42. Kwiatkowski D, Phillips PCB, Schmidt P, Shin Y: Testing the null hypothesis
of stationarity against the alternative of a unit root: How sure are we
that economic time series have a unit root? J Econom 1992, 54(1-
3):159-178.
43. Roenneberg T, Kumar CJ, Merrow M: The human circadian clock entrains
to sun time. Curr Biol 2007, 17(2):R44-5.
44. Diebold F, Senhadji : Deterministic vs. Stochastic Trend in U.S. GNP, Yet Again
Home pages, University of Pennsylvania; 1996 [ />RePEc:wop:pennhp:_054].
45. Cochrane J: How Big Is The Random Walk in GNP. J Polit Econ 1988,
96:893-920.
46. Manuck SB, Flory JD, McCaffery JM, Matthews KA, Mann JJ, Muldoon MF:
Aggression, impulsivity, and central nervous system serotonergic
responsivity in a nonpatient sample. Neuropsychopharmacology 1998,
19(4):287-99.
47. Virkkunen M, Rawlings R, Tokola R, Poland RE, Guidotti A, Nemeroff C,
Bissette G, Kalogeras K, Karonen SL, Linnoila M: CSF biochemistries,
glucose metabolism, and diurnal activity rhythms in alcoholic, violent
offenders, fire setters, and healthy volunteers. Arch Gen Psychiatry 1994,
51:20-7.
48. Sivarajasingam V, Matthews K, Shepherd J: Price of beer and violence-
related injury in England and Wales. Injury 2006, 37(5):388-94.
doi:10.1186/1740-3391-8-10
Cite this article as: Stroebel et al.: Statistical methods for detecting and
comparing periodic data and their application to the nycthemeral
rhythm of bodily harm: A population based study. Journal of Circadian
Rhythms 2010 8:10.
Submit your next manuscript to BioMed Central
and take full advantage of:
• Convenient online submission
• Thorough peer review
• No space constraints or color figure charges
• Immediate publication on acceptance
• Inclusion in PubMed, CAS, Scopus and Google Scholar
• Research which is freely available for redistribution
Submit your manuscript at
www.biomedcentral.com/submit
Stroebel et al. Journal of Circadian Rhythms 2010, 8:10
/>Page 10 of 10