Báo cáo y học: "Preferential expression of potential markers for cancer stem cells in large cell neuroendocrine carcinoma of the lung. An FFPE proteomic study" pptx
Bạn đang xem bản rút gọn của tài liệu. Xem và tải ngay bản đầy đủ của tài liệu tại đây (498.71 KB, 13 trang )
RESEARCH Open Access
Preferential expression of potential markers for
cancer stem cells in large cell neuroendocrine
carcinoma of the lung. An FFPE proteomic study
Masaharu Nomura
1,2*
, Tetsuya Fukuda
3
, Kiyonaga Fujii
4
, Takeshi Kawamura
5
, Hiromasa Tojo
6
, Makoto Kihara
7
,
Yasuhiko Bando
3
, Adi F Gazdar
8
, Masahiro Tsuboi
1
, Hisashi Oshiro
2
, Toshitaka Nagao
2
, Tatsuo Ohira
1
,
Norihiko Ikeda
1
, Noriko Gotoh
9
, Harubumi Kato
10
, Gyorgy Marko-Varga
11
and Toshihide Nishimura
1,3,7
Abstract
Background: Large cell neuroendocrine carcinoma (LCNEC) of the lung, a subtype of large cell carcinoma (LCC), is
characterized by neuroendocrine differentiation that small cell lung carcinoma (SCLC) shares. Pre-therapeutic
histological distinction between LCNEC and SCLC has so far been problematic, leading to adverse clinical outcome.
We started a project establishing protein targets characteristic of LCNEC with a proteomic method using formalin
fixed paraffin-embedded (FFPE) tissues, which will help make diagnosis convinci ng.
Methods: Cancer cells were collected by laser microdissection from cancer foci in FFPE tissues of LCNEC (n = 4),
SCLC (n = 5), and LCC (n = 5) with definite histological diagnosis. Proteins were extracted from the harvested
sections, trypsin-digested, and subjected to HPLC/mass spectrometry. Proteins identified by database search were
semi-quantified by spectral counting and statistically sorted by pair-wise G-statistics. The results were
immunohistochemically verified using a total of 10 cases for each group to confirm proteomic results.
Results: A total of 1981 proteins identified from the three cancer groups were subjected to pair-wise G-test under
p < 0.05 and specificity of a protein’ s expression to LCNEC was checked using a 3D plot with the coordinates
comprising G-statistic values for every two group comparisons. We identified four protein candidates prefe rentially
expressed in LCNEC compared with SCLC with convincingly low p-values: aldehyde dehydrogenase 1 family
member A1 (AL1A1) (p = 6.1 × 10
-4
), aldo-keto reductase family 1 members C1 (AK1C1) (p = 9.6x10
-10
) and C3
(AK1C3) (p = 3.9x10
-10
) and CD44 antigen (p = 0.021). These p-values were confirmed by non-parametric exact
inference tests. Interestingly, all these candidates would belong to cancer stem cell markers. Immunohistochmistry
supported proteomic results.
Conclusions: These results suggest that candidate biomarkers of LCNEC were related to cancer stem cells and this
proteomic approach via FFPE samples was effective to detect them.
Keywords: large cell neuroendocrine carcinoma, formalin-fixed paraffin embedded tissues, mass spectrometry,
cancer stem cell markers
Introduction
Lung cancer is the leading cause of cancer-related death
worldwide [1]. In Japan, annual deaths from lung cancer
have been increasing and reached about 70,000 [2] and
in USA reached 160,000 even with a recent decreasing
trend [3]. Generally, lung cancer is divided into two
histological subgroups, non-small cell lung carcinoma
(NSCLC) and small cell lung carcinoma (SCLC). NSCLC
mainly consists of adenocarcinom a (AC), squamous cell
carcinoma (SC) and large cell carcinoma (LCC). AC and
SC are differe ntiated with the features of normal cells
but L CC is undifferentiated without such features. The
prognosis of lung cancer depends on pathological stages
and histological types; in NSCLC, AC is the best, while
LCC the worst [4].
* Correspondence:
1
Dept. of Surgery I, Tokyo Medical University, Tokyo, Japan
Full list of author information is available at the end of the article
Nomura et al. Journal of Clinical Bioinformatics 2011, 1:23
/>JOURNAL OF
CLINICAL BIOINFORMATICS
© 2011 N omura et al; licensee BioMe d Central Ltd. This is an Open Access article distributed under the terms of the Creative Commons
Attribution License ( 2.0), which permits unrestricted use, distribution, and repro duction in
any medium, provided the original work is properly cited.
Travis et al. [5] proposed a new subtype of LCC, named
large cell neuroendocrine carcinoma (LCNEC) in 1991,
and the World Health Organ izati on finally adopted it for
the revised pathological classification of lung cancer in
1999. LCNEC exhibits morphology similar to LCC but
neuroendocrine differentiation like SCLC t hat could be
judged by expression of at least one of three representa-
tive neuroendocrine proteins, CD56, synaptophy sin (Syn)
and chromogranin A (CGA). Among subtypes of LCC,
the prognosis of LCNEC was poorer than others even if
at early stages [6,7] like SCLC. However therapeutic stra-
tegies of LCNEC and SCLC differ from each other. The
former needs surgery as the first choice but the latter
chemotherapy. It is therefore important to distinguish
LCNEC from SCLC definitely but common morphologi-
cal growth patterns characteristic of neuroendocrine
tumors sometimes hinder clear pathologic distinction
between the two neuroendocrine cancers.
It follows that new biomarkers should be developed for
definite diagnosis of those cancers, even if histopathology
has long been the golden standard for diagnosis and deter-
mination of disease progression. Genomic and immuno-
histochemical analyses for such a purpose have been
reported [8,9] but there have still been no biomarkers
specific to LCNEC. Recent advancements in shotgun
sequencing and quantitative mass spectrometry for protein
analyses could make proteomics amenable to clinical bio-
marker discovery [10]. In addition, selective collection of
target cells from formalin fixed paraffin embedded (FFPE)
tissues by laser microdissection can permit to access to tis-
sues of a variety of cancer types with definite diagnosis.
We have used these methods for exploring stage-related
proteins on non-metastatic lung AC by both global and
multiple reaction monitoring (MRM) mass spectrometry-
based p roteomics [11,12]. In this study, we appli ed them
to detect the potential protein markers characteristic of
LCNEC by label-free semi-quantitative shotgun proteo-
mics using spectral counting.
2. Materials and methods
2. 1. Sample Preparation for FFPE Tissue Specimens
Surgically removed lung tissues were fixed with a buffered
formalin solution containing 10-15% methanol, and
embedded by a conventional method. Archived paraffin
blocks of formalin-fixed tissues obtained from four
LCNEC cases, five LCC and five SCLC, which were
retrieved with the approval from Ethical Committee of
Tokyo Medical University Hospital and used with patients’
consents. Patients’ characteristics are listed in Table 1.
Paraffin blocks were cut into 4 μm sectio ns for diag nosis
and 10 μm sections for proteomics. The 10 μmsections
were stained with only haematoxylin. Three pathologists
(M.N., H.O., and T.N.) independently made a diagnosis
using the 4 μm sections stained with haematoxylin and
eosin according to the WHO classification. LCNEC has its
characteristic cancer cells with relatively larger cytoplasm,
less fine chromatin and more distinct nucleoli than those
of SCLC. The sections of patients diagnosed unequivocally
were used in this study.
2. 2. Immunohistochemical Staining
The neuroendocrine nature of tumors was confirmed with
the three representative antibodies, monoclonal mouse anti
CD56 antibody (Novocastra, Newcastle upon Tyne, U.K.),
polyclonal rabbit anti CGA antibody (DAKO Japan, Kyoto,
Japan) and monoclonal mouse anti SYN antibody (DAKO
Japan, Kyoto, Japan). The staining of these antibodies was
performed automatically on a Ventana Benchmark
®
XT
(Ventana Japan, Tokyo, Japan). Expression of four proteo-
mics-identifying proteins specific to LCNEC was tested
with the following commercially available antibodies
according to the manufacturer’s protocols: monoclonal
rabbit anti AL1A1 antibody (Abcom Japan, Tokyo, Japan),
Table 1 Patients’ Characteristics
Cancer groups Patient No. Gender Age TNM* Staging
LCNEC 1 F 68 T1N0M0 IA
2 M 73 T2N0M0 IB
3 M 58 T1N1M0 IIA
4 M 70 T2N0M0 IB
5 M 76 T2N2M0 IIIA
6 M 69 T3N3M0 IIIB
7 M 64 T2N1M0 IIB
8 M 60 T2N2M0 IIIA
9 F 77 T1N0M0 IA
10 M 69 T1N2M0 IIIA
SCLC 1 F 62 T2N0M0 IB
2 M 77 T2N1M0 IIB
3 M 57 T2N1M0 IIB
4 M 76 T1N1M0 IIA
5 M 64 T1N1M0 IIA
6 F 70 T1N1M0 IIA
7 M 69 T1N1M0 IIA
8 M 77 T2N0M0 IB
9 M 73 T1N0M0 IA
10 M 73 T2N1M0 IIB
LCC 1 M 52 T2N1M0 IIB
2 M 71 T1N0M0 IA
3 F 57 T1N0M0 IA
4 M 51 T4N2M0 IIIB
5 M 72 T1N1M0 IIA
6 M 67 T1N1M0 IIA
7 M 67 T2N0M0 IB
8 M 58 T1N0M0 IA
9 M 67 T2N0M0 IB
10 M 66 T1N0M0 IA
*Ref. [31].
Nomura et al. Journal of Clinical Bioinformatics 2011, 1:23
/>Page 2 of 13
polyclonal anti AK1C1 antibody (GeneTex, Irvine, CA,
USA), monoclonal anti AK1C3 antibody (Sigma Japan,
Tokyo, Japan) and monoclonal mouse anti CD44 antibody
(Abcom Japan, Tokyo, Japan). Briefly, sections were incu-
bated with xylene, rehydrated with graded e thanol solu-
tions and incubated with methyl alcohol containing 3%
hydrogen pero xide to rem ove endogenous pero xidase
activity. After washing thoroughly with PBS, sections were
incubated with adequately diluted primary antibodies and
then with Histofine simple stain
®
(Nichirei Bioscience,
Tokyo, Japan), and finally visualized with products of the
peroxidase and diaminobenzidien reaction.
2. 3. Laser Capture and Protein Solubilization
Cancerous lesions were identified on serial sections of
NSCLC tissu es stained with hematoxyl in-eosin (HE). For
proteomic analysis, a 10 μm thick section prepared from
thesametissueblockwasattachedontoDIRECTOR™
slides (Expression Pathology, Rockville, MD, USA), de-
paraffinized twice with xylene for 5 min., rehydrated with
graded ethanol solutions and distilled water and stained
by only hematoxylin. Those slides were air-dried and
subjected to laser microdissection with a Leica LMD6000
(Leica Micro-systems GmbH, Ernst-Leitz-St rasse,
Wetzlar, Germany). At least 30,000 cells (8.0mm
2
)were
collected directly into a 1.5mL low-binding plastic tube.
Proteins were extracted and digested with trypsin using
Liquid Tissue™ MS Protein Prep kits (Expression
Pathology, Rockville, MD, USA) according to the manu-
facturer’s protocol.
2. 4. Liquid Chromatography-Tandem Mass Spectrometry
We here adopted label-free semi-quantitation using spec-
tral counting by liquid chromatography (LC)-tandem mass
spectrometry (MS/MS) to a global proteomic analysis. The
digested samples were analyzed in triplicates by LC-MS/
MS using reversed-phase liquid chromatography (RP-LC)
interfaced with a LTQ-Orbitrap hybrid mass spectrometer
(Thermo Fisher Scientific, Bremen, Germany) via a nano-
electrospray device as described in details previously [13].
Briefly, the RP-LC system consisted of a peptide Cap-Trap
cartridge (0.5 × 2.0 mm) and a capillary separation column
(an L-column Micro of 0.2 × 150 mm packed with reverse
phase L-C18 gels of 3 μm in diameter and 12 nm pore
size, (CERI, Tokyo, Japan)) connected an emitter tip (For-
tisTip of 20 μm ID and 150 μm OD with a perfluoropoly-
mer-coated blunt end, OmniSeparo-TJ, Hyogo, Japan) to
the outlet. An autosampler (HTC-PAL, CTC Analytics,
Switzerland) loaded an aliquot of samples onto the trap,
which then was washed with solvent A (98% distilled
water with 2% acetonitrile and 0.1% formic acid) for con-
centrating peptides on the trap and desalting. Subse-
quently, the trap was connected in series to the separation
column, and the whole columns we re developed for
70 min. with a linear acetonitrile concentration gradient
made from 5 to 40% solvent B (10% distilled water and
90% acetonitrile containing 0.1% formic acid) at the flow-
rate of 1 μL/min. An LTQ was operated in the data-
dependent MS/MS mode to automatically acquire up to
three successive MS/MS scans in the centroid mode. The
three most intense precursor ions for these MS/MS scans
could be selected from a high-resolution MS spectrum (a
survey scan) that an Orbitrap previously acquired during a
predefined short time window in the profile mode at the
resolution of 30 000 in the m/z range of 400 to 1600. The
sets of acquired high-resolution MS and MS/MS spectra
for peptides were converted to single data files and they
were merged into Mascot generic format files for database
searching.
2.5 Database Searching and Semi-quantification with
Spectral Counting
Mascot software (version 2.1.1, Matrix Science, London,
UK) was used for database search against Homo sapiens
entries in the UniProtKB/Swiss-Prot database (Release
56.6, 20413 entries). Peptide mass tolerance was 10ppm,
fragment mass tolerance 0.8Da, and up to two missed
cleavages were allowed for errors in trypsin specificity.
Carbamidomethylation of cysteines was taken as fixed
modifications, and methionine oxidation and formylation
of lysine, arginine and N-terminal amino acids as variable
modifications. A p-value bein g < 0.05 was considered
significant, and the score cutoff was 44. The lists of iden-
tified proteins were me rged into a master file where
the primary accession numbers and entry names from
UniProtKB were used. The false positive rates for protein
identification were estimated using a decoy database cre-
ated by reversing the protein sequences in the original
database; the es timated false positive rate of peptide
matches was 0.45% under protei n score thresho ld condi-
tions (p < 0.005). Mascot search results were processed
through Scaffold software (version 2.02.03, Proteome
Software, Portland, OR) to semi-quantitatively analyze
differential expression levels of proteins in LCNEC, LCC
and SCLC by spectral counting as described [11]. The
number of peptide MS/MS spectra with high confidence
(Mascot ion score, p < 0.005) was used for calculating
spectral counts. Fold changes of expressed proteins in
thebase2logarithmicscale(R
SC
) were calculated using
spectral counting as described [11]. Candidate proteins
between two groups were chosen so that their R
SC
satisfy
>1 or <−1, which correspond to their fold changes >2 or
<0.5. G-test was used for evaluating differential protein
expression in pair-wise cancer groups [14]. In this study
we mainly focus on LCNEC vs. SCLC comparison, but
the other pairs were considered. The results are illu-
strated in a three-dimensional plot to judge whether a
protein is specifically expressed in a given cancer group.
Nomura et al. Journal of Clinical Bioinformatics 2011, 1:23
/>Page 3 of 13
Although G-test does not require replicates, spectral
counts for each protein from triplicates were pool ed and
used for G-sta tistic calculation using a two- way contin-
gency table arranged in two rows for a target protein and
any other proteins, and two columns for cancer groups
on an Excel macro. Statistical significance should be p <
0.05. The Yates correction for continuity is applied to the
2 × 2 tables. The correction could enable us to handle
the data containing small spectral count s including zero.
Statisticians, however, showed that the results of G-test
using a contingency table containing small counts are
not so convincing because it is assumed that the G statis-
tic asymptotically obey a c
2
distribution with one degree
of freedom. To validate the G-test results, we calculated
exact p-values for some significant proteins without mak-
ing any assumptions of statistical distribution based on
the permutational distribution of the test statistic, i.e.,
Fisher’s exact test and Mann-Whitney U test for the con-
tingency tables using a R package.
3. Results
3. 1. Patient groups and pathological classification
To explore protein markers to distinguish LCNEC from
SCLC, we investigated cancer cells prepared by laser
microdissection from FFPE sections of LCNEC, SCLC,
and LCC with a shotgun proteomic method. The LCNEC
group consisted of four independent patients and other
two groups consisted of five independent ones. For immu-
nohistochemistry, we added more patients so as to amount
to 10 patients for each group. Patients were divided into
those cancer groups according to the WHO classification
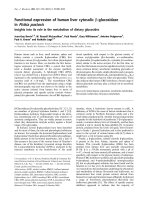
and by immunohistochemistry with antibodies raised
against established neuroendocrine markers, CD56, CGA
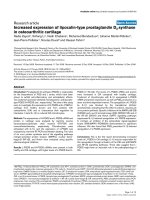
and Syn (Table 1 and Figure 1). All LCNEC and SCLC tis-
sues used in this study are positively stained with at least
one of these antibodies consistent with the neuroendo-
crine nature of those cancers. LCC tissues were not
stained immunohistochemically except for 2 cases w ith
faintly positive for Syn but histopathological differentiation
from SC, AC and SCLC was required for its definite diag-
nosis. The patient profiles including the TNM pathological
classification and staging are summarized in Table 1.
There was no difference between the ages for each group
(p =0.076byANOVA,meanage
+ SD: 68.4 +6.3for
LCNEC, 69.8
+ 6.8 for SCLC, and 62.8 + 7.7 for LCC) and
the number of male accounts for over 80% for all groups.
The majority of patients remained at stages from IA to IIB
and accordingly had the extent of the primary tumor (T1
and T2) and of regional lymph node involvement (N0 and
N1) except for the most advanced stage IIIA or IIIB in a
LCC patient (patient 4) and additional four patients of
LCNEC for immunohistochemistry (patients 5, 6, 8, and
10). All patients had no distant metastasis (M0). All the
patients but patient 5 (carboplatin + irinotecan) in LCNEC
and patient 4 (carboplatin + pacritaxel) in LCC have not
undergone pre-operative chemotherapy.
3. 2. LC-MS/MS protein identifications and semi-
quantification by spectral counting
Trypsin-digests from laser-microdissected samples typi-
cally containing ~30,000 cells were analyze d in tri plicate
by LC-MS/MS as des cribed in “Materials and Methods”.
Under the database search settings used, we identified
significant proteins as follows: LCNEC contained a total of
1,124 proteins including 410 unique, 168 in the overlap
only between LCNEC and SCLC, 93 in the overlap only
between LCNEC and LCC, and 453 in the overlap among
three groups; SCLC contained a total of 1,096 including
362 unique, 100 in the overlap only between SCLC and
LCC and the overlapped proteins described above; LCC
contained a total of 1,083 including 450 unique and the
overlapped proteins described earlier. The spectral counts
were calculated for these proteins and those from triplicate
experiments were pooled, thereby improving the perfor-
mance of G-test and decreasing false positive rates signifi-
cantly [14]. There was no significant difference among the
total spectral counts of each group (p = 0.248 by ANOVA;
mean counts
+ SD: 1916 + 571 for LCNEC, 1879 + 457
for SCLC, 2491
+ 645 for LCC). Next, the values of R
sc
that is a measure of fold changes for protein expression
levels were calculated as described in “ Materials and
Methods” using the spectral counts of these proteins. The
pooled counts for each protein were also subjected to
pair-wise G-test between cancer groups. Table 2 shows
the identified proteins that are significantly up- or down-
regulated in LCNEC compared with SCLC as judged by G
test under p <0.05. The proteins are listed in descending
order of the R
sc
values; the larger the R
sc
value of a given
protein, the greater its e xpression level in LCNEC com-
pared with SCLC and vice versa. Representative protein s
up-regulated in LCNEC were AL1A1, AK1C1, AK1C3,
brain-type fatty acid-binding protein (FABP) and b-eno-
lase. On the other hand, those in SCLC were brain acid
soluble protein 1 (BASP), secretagogin (SEGN), fascin and
neural cell adhesion molecule (CD56).
3. 3. Biomarker Candidates for LCNEC
To illustrate the specificity of p rotein expression toward
LCNEC more clearly, we made a 3D scatter plot with an ×
axis indicating G-statistic values (G values) for LCNEC vs.
LCC analysis, a y axis for LCC vs. SCLC, and a z axis for
LCNEC vs. SCLC (Figure 2). When the spectral counts of
a target protein are zero for both groups in question, it is
hereafter defined as G = 0. The proteins expressed specifi-
cally to LCNEC will therefore be present in the region
(x>3.84, z>3.84 corresponding to p < 0.05 each) on the x-z
plane, those in SCLC in the region (y>3.84, z>3.84) on the
y-z plane and those in LCC in the region (x>3.84, y>3.84)
Nomura et al. Journal of Clinical Bioinformatics 2011, 1:23
/>Page 4 of 13
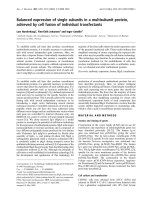
on the x-y plane. We used 1,918 proteins for this plotting.
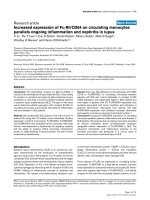
Close inspection of the 3D plot shows that AK1C3 at a
point (40.8, 0, 39.1), AK1C1 at a point (39.0, 0, 37.4),
AL1A1 at a point (8.75, 2.6 × 10
-5
, 11.8) and CD44 antigen
precursor (CD44) at a point (5.56, 0, 5.27) are very near
or on th e x-z plane with convincingly low p-values (3.9 ×
10
-10
, 9.6 × 10
-10
, 6.1 × 10
-4
, and 0.021, respectively) from
LCNEC vs. SCLC comparisons and thus specific to
LCNEC. Interestingly, AK1C1, AK1C3, AL1A1, and CD44
have been reported to be biomarkers of cancer stem cells
(see Discussion). In Table 2 BASP and SEGN are signifi-
cantly up-regulated in SCLC compared with LCNEC,
which are indeed located on the y-z plane at the respective
points (0, 32.2, 24.1) and (0, 21.5, 15.9), and specific to
SCLC. Major vault protein (MVP) is at a point (23.8, 34.1,
0) on the x-y plane, indicating an LCC-specific protein.
One of well known proteins related to SCLC, g-enolase
(ENOG) is detectable at a point (0.55, 7.23, 2.84) in the 3D
G-statistic space which indicates that it is expressed signif-
icantly in SCLC c ompared to in LCC. The G-statistic is
assumed to ob ey a c2-distribution with one degree of free-
dom and the p-values based on G-values obtained with
the contingency tables containing small counts should be
handled with caution. Therefore we calculated exact p-
values for the 2 × 2 tables with the non-parametric Fisher’s
exact test and Mann-Whitney U test. The results were
fully consistent with those obtained with the G-test; the
exact p-values for LCNEC vs. SCLC were 3.40 × 10
-4
for
AL1A1, 5.53 × 10
-10
for AK1C1, 2.27 × 10
-10
for AK1C3,
and 0.012 for CD44. The G-test analyses of three cancer
group pairs (LCNEC vs. SCLC, LCNEC vs. LCC, and LCC
vs. SCLC) under p < 0.05 retrieved the respective 95, 186
and 237 proteins that showed significant changes in
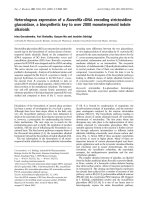
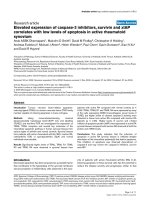
expression levels. These proteins were subjected to gene
ontology (GO) analysis, highlighting their biological and
molecular functions and cellular localization. As Figure 3
shows, the molecular functions and cellular localization of
proteins preferentially expressed in the LCNEC v s. SCLC
pair were quite different from those of the other pairs.
3. 4. Extended immunohistochemical validation of the
proteomics results
From this proteomic study we identified AL1A1, AK1C1,
AK1C3 and CD44 as biomarker candidates for LCNEC.
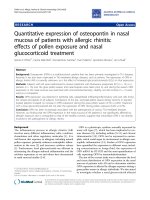
The results were immunohistochemically verified using a
total of 10 c ases for each group. W e assessed i m munorea c-
tivity with the percentage of immunopositive area and
staining intensity compared to those of positive-control
samples at the maximal cut-surface of tumors (Figure 4).
All SCLC cases showed no immunoreactivity with AK1C1,
AK1C3 and CD44 and the reactivity of all antibodies with
LCNEC sections differed impressively from that of SCLC,
supporting the proteomic results. Notably, nine cases of
LCNEC including four use d for t he proteomic e xperiments
Figure 1 Immunohistochemistry with antibodies raised against established neuroendocrine markers, CD56, CGA, and Syn.
Nomura et al. Journal of Clinical Bioinformatics 2011, 1:23
/>Page 5 of 13
Table 2 Significant changes in protein expression levels as judged with G-test under p < 0.05 for an LCNEC vs. SCLC
pair.
No Entry name Accession number Proteins GPRsc Spectral
counts
LCNEC SCLC
1 AK1C3 P42330 Aldo-keto reductase family 1 member C3 39.1 3.93E-10 4.91 25 0
2 AK1C1 Q04828 Aldo-keto reductase family 1 member C1 37.4 9.56E-10 4.86 24 0
3 FABP7 O15540 Fatty acid-binding protein, brain 21.9 2.89E-06 4.22 15 0
4 ENOB P13929 Beta-enolase 22.2 2.50E-06 3.61 18 1
5 AL1A1 P00352 Retinal dehydrogenase 1 11.8 6.07E-04 3.55 9 0
6 4F2 P08195 4F2 cell-surface antigen heavy chain 11.8 6.07E-04 3.55 9 0
7 1C12 P30508 HLA class I histocompatibility antigen, Cw-12 alpha chain precursor 11.8 6.07E-04 3.55 9 0
8 TBA4A P68366 Tubulin alpha-4A chain 11.8 6.07E-04 3.55 9 0
9 LG3BP Q08380 Galectin-3-binding protein precursor 20.6 5.77E-06 3.54 17 1
10 1C03 P04222 HLA class I histocompatibility antigen, Cw-3 alpha chain precursor 10.1 1.48E-03 3.40 8 0
11 TKT P29401 Transketolase 8.46 3.62E-03 3.24 7 0
12 VTNC P04004 Vitronectin precursor 6.85 8.87E-03 3.05 6 0
13 G6PD P11413 Glucose-6-phosphate 1-dehydrogenase 6.85 8.87E-03 3.05 6 0
14 PRDX4 Q13162 Peroxiredoxin-4 6.85 8.87E-03 3.05 6 0
15 VDAC1 P21796 Voltage-dependent anion-selective channel protein 1 6.85 8.87E-03 3.05 6 0
16 1B15 P30464 HLA class I histocompatibility antigen, B-15 alpha chain precursor 6.85 8.87E-03 3.05 6 0
17 VILI P09327 Villin-1 6.85 8.87E-03 3.05 6 0
18 DESP P15924 Desmoplakin 11.19 8.24E-04 2.96 11 1
19 AHSA1 O95433 Activator of 90 kDa heat shock protein ATPase homolog 1 5.27 2.18E-02 2.84 5 0
20 COPB P53618 Coatomer subunit beta 5.27 2.18E-02 2.84 5 0
21 TMEDA P49755 Transmembrane emp24 domain-containing protein 10 precursor 5.27 2.18E-02 2.84 5 0
22 CD44 P16070 CD44 antigen precursor 5.27 2.18E-02 2.84 5 0
23 COPA P53621 Coatomer subunit alpha 5.27 2.18E-02 2.84 5 0
24 TBB4Q Q99867 Putative tubulin beta-4q chain 5.27 2.18E-02 2.84 5 0
25 THIL P24752 Acetyl-CoA acetyltransferase, mitochondrial precursor 5.27 2.18E-02 2.84 5 0
26 EFTU P49411 Elongation factor Tu, mitochondrial precursor 14.88 1.14E-04 2.47 19 4
27 IDHP P48735 Isocitrate dehydrogenase [NADP], mitochondrial precursor 13.55 2.32E-04 2.39 18 4
28 LRC47 Q8N1G4 Leucine-rich repeat-containing protein 47 5.41 2.01E-02 2.39 7 1
29 CO6A1 P12109 Collagen alpha-1(VI) chain precursor 4.08 4.34E-02 2.20 6 1
30 PSA P55786 Puromycin-sensitive aminopeptidase 4.08 4.34E-02 2.20 6 1
31 IMB1 Q14974 Importin subunit beta-1 5.95 1.47E-02 2.17 9 2
32 PSA2 P25787 Proteasome subunit alpha type-2 4.72 2.99E-02 2.02 8 2
33 FAS P49327 Fatty acid synthase 9.93 1.63E-03 1.93 18 6
34 A1AT P01009 Alpha-1-antitrypsin precursor 4.05 4.41E-02 1.62 10 4
35 ROA1 P09651 Heterogeneous nuclear ribonucleoprotein A1 6.43 1.12E-02 1.58 16 7
36 FINC P02751 Fibronectin precursor 8.01 4.64E-03 1.57 20 9
37 TRAP1 Q12931 Heat shock protein 75 kDa, mitochondrial precursor 6.26 1.24E-02 1.50 17 8
38 MYH14 Q7Z406 Myosin-14 6.26 1.24E-02 1.50 17 8
39 ANXA2 P07355 Annexin A2 5.46 1.94E-02 1.49 15 7
40 PHB2 Q99623 Prohibitin-2 4.67 3.07E-02 1.49 13 6
41 GSTP1 P09211 Glutathione S-transferase P 10.63 1.12E-03 1.38 32 17
42 PDIA1 P07237 Protein disulfide-isomerase precursor 8.96 2.76E-03 1.33 29 16
43 1433G P61981 14-3-3 protein gamma 8.11 4.40E-03 1.28 28 16
44 ACTN4 O43707 Alpha-actinin-4 8.82 2.98E-03 1.26 31 18
45 PCBP2 Q15366 Poly(rC)-binding protein 2 5.03 2.49E-02 1.16 21 13
46 TPIS P60174 Triosephosphate isomerase 6.45 1.11E-02 1.12 28 18
47 TRFE P02787 Serotransferrin precursor 7.17 7.41E-03 1.12 31 20
48 ARF1 P84077 ADP-ribosylation factor 1 5.00 2.53E-02 1.09 23 15
49 PCBP1 Q15365 Poly(rC)-binding protein 1 4.31 3.79E-02 1.01 23 16
Nomura et al. Journal of Clinical Bioinformatics 2011, 1:23
/>Page 6 of 13
Tab le 2 Signif icant changes in protein expression levels as judged wi th G-test under p < 0.05 for an LCNEC vs. SCLC
pair. (Continued)
50 CO6A3 P12111 Collagen alpha-3(VI) chain precursor 5.16 2.31E-02 0.91 32 24
51 EF1A1 P68104 Elongation factor 1-alpha 1 4.72 2.98E-02 0.83 35 28
52 PDIA6 Q15084 Protein disulfide-isomerase A6 precursor 4.01 4.52E-02 0.81 31 25
53 G3P P04406 Glyceraldehyde-3-phosphate dehydrogenase 14.21 1.64E-04 0.77 113 95
54 ENPL P14625 Endoplasmin precursor 5.76 1.64E-02 0.66 62 56
55 TBB2A Q13885 Tubulin beta-2A chain 5.80 1.61E-02 0.63 69 64
56 VIME P08670 Vimentin 5.92 1.49E-02 0.60 77 73
57 HBB P68871 Hemoglobin subunit beta 4.88 2.72E-02 -0.53 53 110
58 TBB5 P07437 Tubulin beta chain 10.89 9.64E-04 -0.63 81 179
59 TBA1A Q71U36 Tubulin alpha-1A chain 14.38 1.49E-04 -0.67 93 211
60 TBB2B Q9BVA1 Tubulin beta-2B chain 5.93 1.49E-02 -0.69 35 82
61 H2B1B P33778 Histone H2B type 1-B 6.45 1.11E-02 -0.83 25 65
62 LMNB1 P20700 Lamin-B1 7.27 7.03E-03 -0.87 25 67
63 HBA P69905 Hemoglobin subunit alpha 5.77 1.63E-02 -0.92 17 48
64 CALM P62158 Calmodulin 3.90 4.82E-02 -1.00 9 28
65 HNRH1 P31943 Heterogeneous nuclear ribonucleoprotein H 4.36 3.67E-02 -1.01 10 31
66 NUMA1 Q14980 Nuclear mitotic apparatus protein 1 4.83 2.80E-02 -1.01 11 34
67 LAP2A P42166 Lamina-associated polypeptide 2 isoform alpha 5.31 2.13E-02 -1.05 11 35
68 H31T Q16695 Histone H3.1t 6.23 1.26E-02 -1.06 13 41
69 GDIA P31150 Rab GDP dissociation inhibitor alpha 7.65 5.67E-03 -1.09 15 48
70 TBA1C Q9BQE3 Tubulin alpha-1C chain 14.23 1.62E-04 -1.12 27 86
71 TBA1B P68363 Tubulin alpha-1B chain 35.27 2.88E-09 -1.16 63 202
72 K1C19 P08727 Keratin, type I cytoskeletal 19 10.64 1.11E-03 -1.19 17 58
73 HSP76 P17066 Heat shock 70 kDa protein 6 6.46 1.10E-02 -1.23 9 33
74 H12 P16403 Histone H1.2 7.59 5.87E-03 -1.31 9 35
75 TBB4 P04350 Tubulin beta-4 chain 12.66 3.73E-04 -1.50 11 48
76 MOES P26038 Moesin 4.51 3.36E-02 -1.51 3 16
77 KU70 P12956 ATP-dependent DNA helicase 2 subunit 1 22.32 2.31E-06 -1.64 16 75
78 DYHC1 Q14204 Cytoplasmic dynein 1 heavy chain 1 8.54 3.48E-03 -1.67 5 27
79 RBBP4 Q09028 Histone-binding protein RBBP4 6.58 1.03E-02 -1.74 3 19
80 PGS1 P21810 Biglycan precursor 3.99 4.59E-02 -1.81 1 10
81 ROA1L Q32P51 Heterogeneous nuclear ribonucleoprotein A1-like protein 7.30 6.89E-03 -1.81 3 20
82 HNRPF P52597 Heterogeneous nuclear ribonucleoprotein F 4.77 2.90E-02 -1.93 1 11
83 RUXG P62308 Small nuclear ribonucleoprotein G 6.40 1.14E-02 -2.15 1 13
84 1433S P31947 14-3-3 protein sigma 4.19 4.08E-02 -2.21 0 7
85 PEG10 Q86TG7 Retrotransposon-derived protein PEG10 4.19 4.08E-02 -2.21 0 7
86 CAYP1 Q13938 Calcyphosin 4.19 4.08E-02 -2.21 0 7
87 GBB1 P62873 Guanine nucleotide-binding protein G(I)/G(S)/G(T) subunit beta-1 4.19 4.08E-02 -2.21 0 7
88 NCA11 P13591 Neural cell adhesion molecule 1, 140 kDa isoform precursor 4.19 4.08E-02 -2.21 0 7
89 FSCN1 Q16658 Fascin 5.11 2.38E-02 -2.37 0 8
90 ROA0 Q13151 Heterogeneous nuclear ribonucleoprotein A0 8.98 2.74E-03 -2.43 1 16
91 MDHC P40925 Malate dehydrogenase, cytoplasmic 7.00 8.13E-03 -2.66 0 10
92 H2A1D P20671 Histone H2A type 1-D 8.94 2.79E-03 -2.89 0 12
93 SEGN O76038 Secretagogin 15.915 6.63E-05 -3.51 0 19
94 MAP1B P46821 Microtubule-associated protein 1B 16.926 3.89E-05 -3.58 0 20
95 BASP P80723 Brain acid soluble protein 1 24.067 9.30E-07 -3.99 0 27
Proteins are listed in descending order of R
sc
values, pooled spectral counts are listed, and “_HUMAN” are removed from UniProtKG entry names.
Nomura et al. Journal of Clinical Bioinformatics 2011, 1:23
/>Page 7 of 13
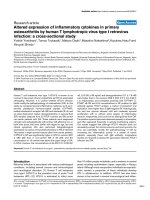
were AL1A1 positive in the extent of 30 to 90%. The most
intense staining (90% positive area) was observed in patient
2 of LCNEC (Table 1 and Figure 4A). On the other hand,
LCC and SCLC sections with typical histology were
AL1A1 negative (Figure 4A). There were four cases with
weak immunoreac tivity (30-80% area) w hich would contain
the small areas mimicking some LCNEC morphology. In
LCNEC four were immuno-positive (30-100% positive
area) to both AK1C1 and AK1C3, and there was one more
AK1C3 positive case. In LCC group one case was AK1C1
positive and four cases were AK1C3 positive; these cases
showed small areas with neuroendocrine tendency in the
Figure 2 Marker candidates’ extraction by pairwise G statistics. In the 3D scatter plot, X, Y, Z-axis shows G-values (X: LCNEC vs. LCC; Y: LCC
vs. SCLC; Z: LCNEC vs. SCLC). Data point sets from 1,918 proteins were plotted with circles. AK1C1 and AK1C3 (orange), AL1A1 (purple) and
CD44 (red) Proteins being located very near or on X-Z plane are isolated as candidates of specific LCNEC markers. SEGN (yellow) were located
on Y-Z plane, which was already known as one of SCLC-specific markers.
Nomura et al. Journal of Clinical Bioinformatics 2011, 1:23
/>Page 8 of 13
Figure 3 Gene ontology (GO) analysis on the molecular functions and cellular localization of proteins preferentially expressed in three
cancer group pairs (LCNEC vs. SCLC, LCNEC vs. LCC, and LCC vs. SCLC). A) Molecular functions: 1, antioxidant activity; 2, auxiliary transport
protein activity; 3, binding; 4, catalytic activity; 5, chemoattractant activity; 6, electron carrier activity; 7, enzyme regulator activity; 8, molecular
function; 9, molecular transducer activity; 10, motor activity; 11, structural molecule activity; 12, transcription regulator activity; 13, translation
regulator activity; 14, transporter activity. B) Cellular localizations: 1, Golgi apparatus; 2, cytoplasm; 3, cytoskeleton; 4, endoplasmic reticulum; 5,
endosome; 6, extracellular region; 7, intracellular organelle; 8, membrane; 9, mitochondrion; 10, nucleus; 11, organelle membrane; 12, organelle
part; 13, plasma membrane; 14, ribosome.
Nomura et al. Journal of Clinical Bioinformatics 2011, 1:23
/>Page 9 of 13
Figure 4 Imunohistochemical identification of proteomics-identifying proteins. A) Histological appearances of LCNEC, SCLC and LCC, and
immunohistochemical staining of AL1A1, AK1C1 and AK1C3. Magnification, x200. B) Immunoreactivitiy with AL1A1, AK1C1, AK1C3, and CD44. The
immunoreactivity was indicated as the percentage of immunopositive area at the maximal cut-surface of tumors.
Nomura et al. Journal of Clinical Bioinformatics 2011, 1:23
/>Page 10 of 13
tissue structure. Immnoreactivity of LCNEC cells to CD44
werethesameasthatofLCC.
4. Discussions
This study aimed at developing the way of proteomic
distinction between LCNEC and SCLC, which will assist
pathologic distinction that has not sometimes been
straightforward, leading t o therapeutic inefficiency.
We have been focusing our attention on using laser-
microdissection sampling from FFPE sections for proteo-
mics to explore disease-related protein markers. We have
already applied this method to both global semi-quantita-
tive shot gun proteomics using spectral counting and
MRM-based quantitative proteomics and successfully
identified stage-related proteins on lung AC [11,12]. In
this study, we used the same global shotgun method for
comparison of three cancer groups (LCNEC, SCLC, and
LCC) by spectral counting and explicitly interpreted three
sets of pairwise G test results in the 3D G-statistic space
(Figure 2). This resulted in identifying four proteins
AL1A1, AK1C1 AK1C3 and CD44 that were expressed in
LCNEC more than in SCLC and LCC with high probabil-
ities. These proteomic findings using the limited scale of
patients were confirmed by routine immunohistochemitry
with additional patients. Moreover we identified other pro-
teins related to these cancer groups in the present study,
further demonstrating the technical feasibility of this FFPE
proteomic method. The identified four proteins physiolo-
gically take part in known metabolic processes. AL1A1,
AK1C1 and AK1C3 are cytosolic oxidoreductases that are
involved in reduction of progesterone to the inactive form
20-alpha-hydroxy-progesterone, metabolism of steroids
and prostaglandins with multi-specificity, oxidation of ret-
inal to retinoic acid and the precursor of the storage form
vitamin A, respectively. CD44 is one of cell-surface glyco-
proteins which relates to cell-cell interactions including
adhesion and migration, and thus to tumor growth and
progression [15]. When we have considered the properties
common to these proteins that hav e apparently no func-
tional relationship with one another, we noticed t hat
AL1A1 [16,17], AK1C1 [18], AK1C3 [19] and CD44 [20 ]
have been proposed to be the markers of cancer stem
cells. Their expression in tumor cells could correlate with
their aggressive biological behavior, drug resistance and
poor prognosis, which are common characteristics of
LCNEC and SCLC. The preferential expression of the can-
cer stem cell markers in LCNEC over SCLC suggests that
the mechanism of increasing the extent of malignancy in
LCNEC differs from that in SCLC. Previous studies sug-
gested that these redox enzymes were present in a variety
of malignant tumor cells. In particular, AK1C1, and
AK1C3 are reported in human non-small cell lung carci-
noma (A549) c ells [21], and a high expression of AL1A1
in lung cancer cell l ines, e specially in AC cell lines
compared to LCC and SCLC cell lines [22-24]. To our
knowledge, however, this is the first report of the statisti-
cally significant proteomic detection o f AL1A1, AK1C1
and AK1C3 in clinical samples of lung cancers, especially
in LCNEC. Out of the top five LCNEC-specific proteins,
brain-type FABP7 is present in highly infiltrative malig-
nant glioma and associated with enhanced cell migratory
activity and thus with poor prognosis [25], suggesting for
its involvement in the aggressive nature of LCNEC. Out of
the top five down-regulated LCNEC proteins compared
with SCLC, BASP is a potential tumor suppressor [26],
consistent with its down-regulation in LCNEC, and its
specific expression in SCLC suggests that different
mechanisms of tumor growth could operate between
LCNEC and SCLC. Another SCLC-specific SEGN is a
novel neuroendocrine marker that has a distinct expres-
sion pattern from the conventional ones used in this
study, consistent with being negative in LCNEC, and with
the reported rate for positive staining in SCLC (26 out of
31) [27]. The role of AL1A1 in lung cancers is still
unknown, but it is recently reported that AL1A1 plays an
important role in Notch pathway [28]. Though there has
been no effective chemotherapy to LCNEC, Sorafen ib, a
tyrosine kinase inhibitor in the MAP kinase pathway, is
effective to malignant tumor cells with AL1A [29]. AL1A1
would be not only cancer stem cell m arkers, but also an
attractive target of treatment of L CNEC. In addition to
statistically sorting protein expression levels by spectral
counting, GO mapping of significant proteins on pairwise
comparison (p < 0.05) provides insights into overall differ-
ences from pair and pair in their biological and molecular
functions, and cellular components. Gene ontology distri-
butions of molecular function and cellular components in
neuroendocrine vs. non-neuroendocrine comparisons, i.e.,
LCNEC vs. LCC and SCLC vs. LCC, did not significantly
differ from each other. On the other hand, those distribu-
tionsincomparisonwithinneuroendocrinegroups,
LCNEC vs. SCLC, differed greatly from those of the other
pairs. This does encourage us to go ahead with further stu-
dies in this line and will promise to get target proteins of
LCNEC eventually in future. We checked the rate of posi-
tive immuno-reaction of relevant antibodies with proteo-
mics-identifying proteins for ten patients of each group
(Figure 4B). Differences between the rates for all target
proteins in LCNEC and SCLC are fully consistent with the
proteomic results, confirming the specificity to LCNEC.
The preferential expression of AL1A1 and AK1C1 in
LCNEC over LCC was also immunochemically confirmed,
and the rate of AL1A1 positive cases in LCC (20%) agreed
with the previous results (25%, 1 of 4) [16]. In contrast,
the positive staining rates of AK1C3 and CD44 in LCNEC
and LCC were similar to each other. Close inspection of
HE sections showed that the positive cases in LCC had
small areas with neuroendocrine tendency in the tissue
Nomura et al. Journal of Clinical Bioinformatics 2011, 1:23
/>Page 11 of 13
structure as pointed out above. Almost all sections of LCC
exhibited no immunoreactivity with the neuroendocrine
markers used except for weak reactivity (20 or 30%) in
only two cases. This suggests that the LCNEC like struc-
ture observed in small portions of L CC sections does not
necessarily contain enough secretory granules, but pre-
sumably contain LCNEC specific AK1C3 and CD44. Con-
firmatory conclusion of this issue should await proof by
electron micrographic immunohitochemistry. A previous
study indicated that CD44 wa s expressed more in SC
(97%) and AC (71%) compared to LCC (29%) and SCLC
(0%) [30] in agreement with the present positive rates for
LCC (30%) and SCLC (0%).
5. Conclusions
WeconcludedthatAL1A1,AK1C1,AK1C3,andCD44
were specific for the LCNEC phenotype in relation to
SCLC and LCC through proteomics of FFPE samples.
They were useful targets to immunohistochemically distin-
guish LCNEC from SCLC and LCC. Though we need a
variety of studies with more extensive experimental and
clinical data to assess the precise function of these marker
candidates and confirm them as real biomarkers, this pro-
teomic analysis was effective to detect them and will be
applied to other phenotype of malignancies.
Abbreviations
NSCLC: non-small cell lung carcinoma; LCNEC: large cell neuroendocrine
carcinoma; LCC: large cell carcinoma; SCLC: small cell lung carcinoma; CSC:
cancer stem cell; LC: liquid chromatography; MS: mass spectrometry; FFPE:
formalin-fixed paraffin embedded; LMD: laser microdissection; MS/MS:
tandem mass spectrometry; ISIS: in-sample internal standard; AL1A1:
aldehyde dehydrogenase 1 family, member A 1; AK1C1: aldo-keto reductase
family 1, member C1; AK1C3: aldo-keto reductase family 1, member C3; HE:
hematoxylin-eosin
Acknowledgements
The authors wish to thank Hiroaki Iyobe for his excellent technical assistance
and all the members of the first Department of surgery, Tokyo Medical
University. This work was supported in part by financial support from the
first department of surgery and the 3
rd
Cancer Broad Strategic Project of the
Japanese Ministry of Public Welfare and Labor.
Author details
1
Dept. of Surgery I, Tokyo Medical University, Tokyo, Japan.
2
Diagnostic
Pathology, Division, Tokyo Medical University, Tokyo, Japan.
3
Biosys
Technologies, Inc., Tokyo, Japan.
4
Dept. of Structural Biology, Graduate
School of Pharmaceutical Science. Hokkaido, University, Hokkaido, Japan.
5
Laboratory for Systems Biology and Medicine, RCAST, The University of
Tokyo, Tokyo, Japan.
6
Dept. of Biophysics and Biochemistry, Osaka University,
Graduate School of Medicine, Suita, Japan.
7
Medical ProteoScope Co., Ltd.
Tokyo, Japan.
8
Hamon Center for Therapeutic Cancer Research, UT
Southwestern Medical Center, Texas, USA.
9
Division of Systems Biomedical
Technology, The Institute of Medical Science, The University of Tokyo, Tokyo,
Japan.
10
Niizashiki Central General Hospital, Saitama, Japan.
11
Clinical Protein
Science & Imaging, Dept. of Measurement Technology and Industrial
Electrical Engineering, Lund University, Lund, Sweden.
Authors’ contributions
MN coordinated the clinical and experimental parts of study and drafted the
manuscript. TF and KF performed protein analysis through mass
spectrometry. TK carried out proteomic data analysis. HT performed
statistical analysis and helped to draft the manuscript. MK performed
statistical analysis of G-test. YB helped us to use FFPE technique. AG
suggested some important points of pathological diagnosis of LCNEC. MT
offered clinical samples from patients. HO and TN pathologically diagnosed
all samples independently. TO and NI supported us clinically and financially.
NG supported us experimentally and financially. HK supported us clinically.
GMV and TN coordinated FFPE project and assessed the results. All authors
read and approved the final manuscript.
Competing interests
The authors declare that they have no competing interests.
Received: 1 April 2011 Accepted: 3 September 2011
Published: 3 September 2011
References
1. Jemal A, Siegel R, Ward E, Hao Y, Xu J, Thun MJ: Cancer statistics, 2009. CA
Cancer J Clin 2009, 59:225-49.
2. The data base of Japanese Ministry of Health, Labor and Welfare. [http://
www.mhlw.go.jp/toukei/saikin/hw/jinkou/geppo/nengai09/kekka3.html].
3. The data base of National Cancer Institute at the National Institute of
Health. [ />4. Koike T, Yamato Y, Asamura H, Tsuchiya R, Sohara Y, Eguchi K, Mori M,
Nakanishi Y, Goya T, Koshiishi Y, Miyaoka E, Japanese Joint Committee for
Lung Cancer Registration: Improvements in surgical results for lung
cancer from 1989 to 1999 in Japan. J Thorac Oncol 2009, 4:1364-9.
5. Travis WD, Linnoila RI, Tsokos MG, Hitchcock CL, Cutler GB Jr, Nieman L,
Chrousos G, Pass H, Doppman J: Neuroendocrine tumors of the lung with
proposed criteria for large-cell neuroendocrine carcinoma. An
ultrastructural, immunohistochemical, and flow cytometric study of 35
cases. Am J Surg Pathol 1991, 15:529-53.
6. Dresler CM, Ritter JH, Patterson GA, Ross E, Bailey MS, Wick MR: Clinical-
pathologic analysis of 40 patients with large cell neuroendocrine
carcinoma of the lung. Ann Thorac Surg 1997, 63:180-5.
7. Battafarano RJ, Fernandez FG, Ritter J, Meyers BF, Guthrie TJ, Cooper JD,
Patterson GA: Large cell neuroendocrine carcinoma: an aggressive form
of non-small cell lung cancer. J Thorac Cardiovasc Surg 2005, 130:166-72.
8. Przygodzki RM, Finkelstein SD, Langer JC, Swalsky PA, Fishback N, Bakker A,
Guinee DG, Koss M, Travis WD: Analysis of p53, K-ras-2, and C-raf-1 in
pulmonary neuroendocrine tumors. Correlation with histological subtype
and clinical outcome. Am J Pathol 1996, 148:1531-41.
9. Cho NH, Koh ES, Lee DW, Kim H, Choi YP, Cho SH, Kim DS: Comparative
proteomics of pulmonary tumors with neuroendocrine differentiation. J
Proteome Res 2006, 5:643-50.
10. Fehniger TE, Marko-Varga G: Proteomics and disease revisited: the
challenge of providing proteomic tools into clinical practice. J Proteome
Res 9:1191-2.
11. Kawamura T, Nomura M, Tojo H, Fujii K, Hamasaki H, Mikami S, Bando Y,
Kato H, Nishimura T: Proteomic analysis of laser-microdissected paraffin-
embedded tissues: (1) Stage-related protein candidates upon non-
metastatic lung adenocarcinoma. J Proteomics 73:1089-99.
12. Nishimura T, Nomura M, Tojo H, Hamasaki H, Fukuda T, Fujii K, Mikami S,
Bando Y, Kato H: Proteomic analysis of laser-microdissected paraffin-
embedded tissues: (2) MRM assay for stage-related proteins upon non-
metastatic lung adenocarcinoma. J Proteomics 73:1100-10.
13. Kawase H, Fujii K, Miyamoto M, Kubota KC, Hirano S, Kondo S, Inagaki F:
Differential LC-MS-based proteomics of surgical human
cholangiocarcinoma tissues. J Proteome Res 2009, 8:4092-103.
14. Zhang B, VerBerkmoes NC, Langston MA, Uberbacher E, Hettich RL,
Samatova NF: Detecting differential and correlated protein expression in
label-free shotgun proteomics. J Proteome Res 2006, 5:2909-18.
15. Aruffo A, Stamenkovic I, Melnick M, Underhill CB, Seed B: CD44 is the
principal cell surface receptor for hyaluronate. Cell 1990, 61:1303-13.
16.
Jiang F, Qiu Q, Khanna A, Todd NW, Deepak J, Xing L, Wang H, Liu Z, Su Y,
Stass SK, Katz RL: Aldehyde dehydrogenase 1 is a tumor stem cell-
associated marker in lung cancer. Mol Cancer Res 2009, 7:330-8.
17. Deng S, Yang X, Lassus H, Liang S, Kaur S, Ye Q, Li C, Wang LP, Roby KF,
Orsulic S, Connolly DC, Zhang Y, Montone K, Bützow R, Coukos G, Zhang L:
Distinct expression levels and patterns of stem cell marker, aldehyde
dehydrogenase isoform 1 (ALDH1), in human epithelial cancers. PLoS
One 2010, 5:e10277.
Nomura et al. Journal of Clinical Bioinformatics 2011, 1:23
/>Page 12 of 13
18. Seo DC, Sung JM, Cho HJ, Yi H, Seo KH, Choi IS, Kim DK, Kim JS, El-
Aty AMA, Shin HC: Gene expression profiling of cancer stem cell in
human lung adenocarcinoma A549 cells. Mol Cancer 2007, 6:75.
19. Pfeiffer MJ, Smit FP, Sedelaar JP, Schalken JA: Steroidogenic enzymes and
stem cell markers are up-regulated during androgen deprivation in
prostate cancer. Mol Med 2011.
20. Rudzki Z, Jothy S: CD44 and the adhesion of neoplastic cells. Mol Pathol
1997, 50:57-71.
21. Palackal NT, Lee SH, Harvey RG, Blair IA, Penning TM: Activation of
polycyclic aromatic hydrocarbon trans-dihydrodiol proximate
carcinogens by human aldo-keto reductase (AKR1C) enzymes and their
functional overexpression in human lung carcinoma (A549) cells. J Biol
Chem 2002, 277:24799-808.
22. Sreerama L, Sladek NE: Class 1 and class 3 aldehyde dehydrogenase
levels in the human tumor cell lines currently used by the National
Cancer Institute to screen for potentially useful antitumor agents. Adv
Exp Med Biol 1997, 414:81-94.
23. Moreb JS, Zucali JR, Ostmark B, Benson NA: Heterogeneity of aldehyde
dehydrogenase expression in lung cancer cell lines is revealed by
Aldefluor flow cytometry-based assay. Cytometry B Clin Cytom 2007,
72:281-9.
24. Patel M, Lu L, Zander DS, Sreerama L, Coco D, Moreb JS: ALDH1A1 and
ALDH3A1 expression in lung cancers: correlation with histologic type
and potential precursors. Lung Cancer 2008, 59:340-9.
25. Mita R, Beaulieu MJ, Field C, Godbout R: Brain fatty acid-binding protein
and omega-3/omega-6 fatty acids: mechanistic insight into malignant
glioma cell migration. J Biol Chem 2010, 285(47):37005-15.
26. Hartl M, Nist A, Khan MI, Valovka T, Bister K: Inhibition of Myc-induced cell
transformation by brain acid-soluble protein 1 (BASP1). Proc Natl Acad Sci
USA 2009, 106(14):5604-9.
27. Lai M, Lü B, Xing X, Xu E, Ren G, Huang Q: Secretagogin, a novel
neuroendocrine marker, has a distinct expression pattern from
chromogranin A. Virchows Arch 2006, 449(4):402-9.
28. Sullivan JP, Spinola M, Dodge M, Raso MG, Behrens C, Gao B, Schuster K,
Shao C, Larsen JE, Sullivan LA, Honorio S, Xie Y, Scaglioni PP, DiMaio JM,
Gazdar AF, Shay JW, Wistuba II, Minna JD: Aldehyde dehydrogenase
activity selects for lung adenocarcinoma stem cells dependent on notch
signaling. Cancer Res 2010, 70:9937-48.
29. Rausch V, Liu L, Kallifatidis G, Baumann B, Mattern J, Gladkich J, Wirth T,
Schemmer P, Büchler MW, Zöller M, Salnikov AV, Herr I: Synergistic activity
of sorafenib and sulforaphane abolishes pancreatic cancer stem cell
characteristics. Cancer Res 2010, 70:5004-13.
30. Fasano M, Sabatini MT, Wieczorek R, Sidhu G, Goswami S, Jagirdar J: CD44
and its v6 spliced variant in lung tumors: a role in histogenesis? Cancer
1997, 80:34-41.
31. Goldstraw P, Crowley J, Chansky K, Giroux DJ, Groome PA, Rami-Porta R,
Postmus PE, Rusch V, Sobin L, International Association for the Study of
Lung Cancer International Staging Committee; Participating Institutions: The
IASLC Lung Cancer Staging Project: Proposals for the revision of the
TNM stage groups in the forthcoming (seventh) edition of the TNM
classification of malignant tumours. J Thorac Oncol 2007, 2:706-14.
doi:10.1186/2043-9113-1-23
Cite this article as: Nomura et al.: Preferential expression of potential
markers for cancer stem cells in large cell neuroendocrine carcinoma of
the lung. An FFPE proteomic study. Journal of Clinical Bioinformatics 2011
1:23.
Submit your next manuscript to BioMed Central
and take full advantage of:
• Convenient online submission
• Thorough peer review
• No space constraints or color figure charges
• Immediate publication on acceptance
• Inclusion in PubMed, CAS, Scopus and Google Scholar
• Research which is freely available for redistribution
Submit your manuscript at
www.biomedcentral.com/submit
Nomura et al. Journal of Clinical Bioinformatics 2011, 1:23
/>Page 13 of 13