Báo cáo y học: " Automated ERCC1 immunochemistry on hybrid cytology/tissue microarray of malignant effusions: evaluation of antibodies 8F1 and D-10." potx
Bạn đang xem bản rút gọn của tài liệu. Xem và tải ngay bản đầy đủ của tài liệu tại đây (4.17 MB, 10 trang )
RESEARCH Open Access
Automated ERCC1 immunochemistry on hybrid
cytology/tissue microarray of malignant effusions:
evaluation of antibodies 8F1 and D-10
Alex Soltermann
*
, Sandra Kilgus-Hawelski, Silvia Behnke, Martina Storz, Holger Moch and Beata Bode
Abstract
Background: The excision repair cross-complementation group 1 (ERCC1) protein is the key enzyme of the
nucleotide excision repair (NER) pathway. Loss of protein expression on immunohistochemistry is predictive for
platinum-based chemotherapy response. Frequently, the diagnosis of malignancy is made on cytologic effusion
samples. Therefore, we evaluated the staining quality of monoclonal anti-ERCC1 antibodies 8F1 and D-10 on
microarrays of malignant pleural and peritoneal effusions by automated immunochemistry.
Methods: Cores from effusion cell blocks of 117 patients with > 40 malignant cell clusters per whole section (pleural
n = 75, peritoneal n = 42) were assembled together with 30 histologic control cores from large tissue blocks (lung,
breast and ovarian carcinoma, each n = 10) on hybrid cytology-tissue microarrays (C/TMA). Four immunochemistry
protocols (Mab 8F1 and D-10, CC1-mono Ventana and H2-60 Bond auto mat) were performed. Immunoreactivity was
semi-quantitatively scored for intensity and intensity multiplied by percentage staining (H-score).
Results: Tumors were classified into female genital tract carcinoma (n = 39), lung adenocarcinoma (n = 23),
mesothelioma (n = 15), unknown primary (n = 14), breast carcinoma (n = 10), gastro-intestinal carcinoma (n = 12)
and other (n = 4). On both platforms, reproducible nuclear ERCC1 immunoreactivity was achieved with both
antibodies, although D-10 was slightly weaker and presented more background staining as well as m ore variation
in the low expression range. No significant differences were found between cytologic and histologic cores. Using
the 8F1 CC1-mono protocol, lung and breast carcinomas had lower ERCC1 expression in comparison to the other
entities (p-value < 0.05).
Conclusions: Cytology microarrays (CMA) are suitable for investigation of clinical biomarkers and can be combined
with conventional TMA’s. Dichotomization of ERCC1 immunoreactivity scores is most suitable for patient
stratification since definition of negativity is antibody-dependent.
Background
Platinum-containing drugs like cisplatin are widely used in
chemotherapy (CT) regimens of advanced cancers such as
ovarian or lung carcinoma due to their robust effective-
ness. Cisplatin forms DNA adducts, thereby causing inter-
and intra-strand cro ss links, comparable to alkylating
agents. If not repaired, this DNA damage will lead to
apoptotic cell death or mutation. The cross links are
removed by trans-lesion synthesis via nucleotide excision
repair (NER), which is the primary repair system for bulky
DNA lesions caused by such drugs [1]. In the NER system,
the heterodimer ERCC1-XPF functions as a structure-spe-
cific endonuclease to make the 5’-incision on the damaged
strand. This step is claimed to be th e key fact or [1-3].
Subsequently, a short oligonucleotide fragment containing
the offending lesion is replaced. It was deduced that
tumors with low nuclear ERCC1 expression better
respond to platinum-containing CT because of reduced
repair capability for DNA adducts [4,5]. Conversely,
patients having tumors with high ERCC1 expression and
thus functional NER and also HRR (homologous recombi-
nation repair) systems were found to have a better overall
survival, since such tumors are assumed to be less unstable
and dedifferentiated (so-called ERCC1 paradoxon). Thus,
* Correspondence:
Institute of Surgical Pathology, University Hospital Zurich, Schmelzbergstrasse
12, CH-8091 Zurich, Switzerland
Soltermann et al. Journal of Clinical Bioinformatics 2011, 1:25
/>JOURNAL OF
CLINICAL BIOINFORMATICS
© 2011 Soltermann et al; licensee BioMed Central Ltd. This is an Open Access article distributed under the terms of the Creative
Commons Attribution License ( w hich permits unrestricted use, distribution, and
reprodu ction in any medium, provided the original work is properly cited.
ERCC1 is considered an important predictive biomarker
for response to platinum-containing CT. A valid predictor
of this widely used regimen is of high clinical importance,
because response rates in e.g. unselected non-small cell
lung cancer (NSCLC) patients range from only 16 to 30%
[6,7].
Assessment of tumoral ERCC1 expression has been
performed in different settings, including preclinical,
adjuvant and palliative studies [8,9]. The resu lts of these
studies were controversial. First, differences between
mRNA and protein-based studies as well as between for-
malin-fixed, paraffin-embedded (FFPE) and frozen tissue
were observed [10]. Second, protein expression was
mostly assessed by immunohistochemistry (IHC) on
FFPE tissue, using the mouse monoclonal anti-ERCC1
antibody clone 8F1 [11-14]. However, specificity and
intranuclear compartmentalization of this clone was
recently challenged [15,16]. The ERCC1 predictor con-
cept is now at the poin t wher e profound and controlled
validation in multi-centre ring-tests be envisaged since
this biomarker is used as stratification parameter in
oncologic trials. Thus tissue types, tissue processing and
protocols of automated immunochemistry platforms
need to be standardized.
Importantly, patients having advanced cancers, e.g. origi-
nating from ovary, lung or pleura, may primarily present
with malignant peritoneal or pleural effusion. Often, the
effusion is sent for cytologic diagnosis. Cytologic smears
and cell blocks are prepared. No further tissue biopsy may
be performed if patients are palliative. Thus, predictors
such as EGFR (epidermal growth factor receptor) or
ERCC1 are increasingly demanded by clinicians on cytolo-
gic material. There are although relevant technical differ-
ences between histology and cytology: Histologic sections
are 2 to 4 μm thick, therefore only a part of the tumor cell
nucleus is represented since e.g. NSCLC nuclei have by
definition a diameter > 30 μm (> 3 × resting lymphocyte
diameter) [17]. In contrast, on cytologic smears, entire
tumor cells are adherent to the glass slide, thus nuclei are
conserved in all 3 dimensions, incl uding z-axis. This fact
may lead to major differences when counting nuclear
EGFR signals by fluorescence in-situ hybridization (FISH)
or semi-quantitatively scoring protein expression intensi-
ties by immunohistochemi stry. Manufacture of cytologic
cell blocks out of the sediment is a means to ci rcumvent
cyto-histologic discrepancies since cut thickness is equal.
We have previously investigated the 3 anti-ERCC1 anti-
bodies Mab 8F1, Mab D-10 and Rab FL-297 on a retro-
spective NSCLC patient cohort assembled on a tissue
microarray (TMA) [18]. Only 8F1 and D-10 could be con-
fidently scored. The rabbit polyclonal ab FL-297 presented
high cytosolic background and rare weak nuclear staining,
thus was omitted. In this study, we aimed for evaluating
the staining quality of the 8F1 and D-10 antibodies on
cytologic effusion cell blocks from most common cancers
associated with malignant effusions. Cores from cell blocks
and histologic controls were assembled on two hybrid
cytology/tissue microarrays (C/TMA) and immunochem-
istry performed on 2 different automated IHC platforms.
We tested the null hypothesis that both antibodies yield
similar staining perfo rmance due to consistent cut thick-
ness of 4 μm across the whole C/TMA surface.
Methods
Patient cohort
Cytologic cell blocks of malignant pleural or peritoneal
effusions of 125 patients in the time frame 2005-2010,
presenting high amounts of malignant cells (> 40 clusters
per whole section surface) were enrolled in the study.
Following diagnostic categories were set up based on
morphology, clinical data and immuno chemistry with
respective markers (using e.g. TTF-1 or Ber-EP4 in case
of differential diagnosis between lung adenocarcino ma
and mesothelioma): Female genital tract carcinoma
(including ovarian, primary peritoneal and uterine carci-
noma), lung adenocarcinoma, mesothelioma, breast car-
cinoma, gastro-intestinal carcinoma (including pancreas,
colon and oesophagus carcinoma), unknown primary
tumor and other (including squamous cell and large cell
carcinoma of the lung, transitional carcinoma of the
bladder and rhabdomyosarcoma). On a first C/TMA, 56
tumoral cell block cores wer e assembled, together with
controls (n = 16) including benign inflammatory-reactive
pleural effusions and histologic tissues from mesothe-
lioma, adenocarcinomas of different organs, transitional
cell carcinoma of the bladder and a thoracic lymph node.
These controls were not computed. On a second C/
TMA, 69 tumoral cell block cores were assembled
together with non-matched control histologic cores from
lung, breast and ovarian carcino mas (each n = 10, total n
= 30). During processing, malignant cells were lost or
immunochemistry was incomplete, respectively, in 8 of
125 cases, thus 117 tumoral cytologic cell block cores
from both C/TMAs and all 30 histologic controls from
the second could be entirely scored. The study was
approved by the institutional review board of the Univer-
sity Hospital Zurich (reference number StV 29-2009).
Cell block
The effusion liquid was centrifuged at 2000 × g for 10
min at room temperature and the cell-free supernatant
discarded, leaving a small amount of 100 μlliquidabove
the sediment. The sediment consisted of an upper white
phase, containing the tumor cells as well as lymphocytes
and mesothelial cells. The lower red phase represented
erythrocytes. The upper white phase was aspirated with a
Paste ur pipette and few droplets used for manufacture of
3 Papanicolaou stained smears. The rest of the white
Soltermann et al. Journal of Clinical Bioinformatics 2011, 1:25
/>Page 2 of 10
phase was then transferred into a microtube. A clot was
quickly formed by addition of 4 droplets plasma (from
the hospital ’s blood donation service) and 1 droplet
thrombin (60 NIH-U/ml, Diagnotec AG, Liestal, Switzer-
land). The clot was transferred into a small inlay cassette
with a wooden stick and this cassette was put into a lar-
ger histology cassette. After formalin fixatio n, clots were
processed by paraffin embedding and haematoxylin-eosin
(H&E) staining of whole sections.
Hybrid cytology/tissue microarray
From a representative region of the donor block, a par-
affin core of 0.6 mm diameter and 3-4 mm height was
taken and precisely arrayed into a new recipient paraffin
block using a custom-m ade, semiautomatic tissue
arrayer (Beecher Instruments, Sun Prairie, WI, USA).
Four μm sections were cut for immunochemistry.
Immunochemistry
The two mouse monoclonal anti-ERCC1 antibodies 8F1
(Novus Biologicals, Littleton, CO, USA, dilution 1:30)
and D-10 (Santa Cruz Biotechnology, Santa Cruz, CA,
USA, dilution 1:100), directed agai nst full length protein,
were tested on 3 multi-tissue microarrays to select the
appropriate dilution as described [18] and further evalu-
ated on whole sections of NSCLC for surface homogene-
ity. Two automated immunochemistry platforms were
used: First, on a Ventana Benchmark
®
platform (Ventana
Medical Systems, Tucson, AZ, USA), the cell conditioner
1 (CC1) standard mono protocol (CC1-mono) was per-
formed: pre-treatment with boiling f or 60 min in pH 8
Tris buffer, incubation with primary ab for 60 min at
room temperature (RT) and development with the Ultra-
view-HRP mono kit, including incubation with respective
secondary ab for 30 min at RT and additional amplifica-
tion with respective third and fourth ab. Second, on a
Leica Bond
®
platform (Vision Biosys tems, Melbourne,
Australia), the H2 standard (H2-60) protocol was per-
formed: pre-treatment with boiling f or 60 min in pH 8
Tris buffer, incubation with primary ab for 30 min at RT
and subs equent development with the Refine-DAB Bond
kit, including incubation with respective secondary ab for
30 min at RT and additional polymer amplification. For
TTF-1, the monoclonal antibody SPT24 (Novocastra
Laboratories Ltd, Newcastle upon Tyne, UK, dilution
1:100) was used with protocol Ventana CC1-mono. For
Ber-EP4weusedMabM0804(DakoCytomation, Baar,
Switzerland, dilution 1:40) with protocol prediluted pro-
tease 1 Ventana and 4 min digestion.
Scoring system
Nuclear immunoreactivity of both the 8F1 and the D-10
ab was scored by A.S. in a blinded manner. The staining
intensity was semi-quantitatively scored 0 (negative), 1
(weak), 2 (moderate) or 3 (strong). Further, the percentage
of cells having any positivity was proportionally scored 0
(0%), 0.1 (1-9%), 0.5 (10-49%) or 1.0 (50% and more) as
described [4]. The H-score was obtained by multiplication
of intensity with percentage staining (final range 0 to 3,
per core). Endothelial cells in lymphatic control tissue
were assigned an intensity of 2 by default.
Image capture and statistical analysis
Images were captured on a Zeiss A xioskop connected to
a CCD camera, using the image analysis software analy-
SIS FIVE (Olympus BioSystem, Volketswil, Switzerland).
White balance was adjusted on analySIS FIVE. No
further image processing on Adobe Photoshop such as
application of gradation curves for enhancement of con-
trast or brightness was performed. Correlations of
ERCC1 immunoreactivity scores with tumor entities
were computed using non-dichotomized data and Ken-
dall’ s tau-b tests, comparison of score means b y the
Mann-Whitney U test. P-values < 0.05 were considered
significant. Analyses were carried out on PASW 18.0.0
software package (SPSS Inc., Chicago, IL, USA).
Results
Cohort description
Of the 117 patients (pleural effusion n = 75, peritoneal n
= 42) 77 were female and 40 male. The mean age was 66
years (range 29 to 91 years). Table 1 indicates the fre-
quencies of each diagnostic category in both C/TMAs.
We concluded that this distribution well represents most
common cancers giving rise to malignant effusions and
thus is adequate for further investigations.
ERCC1 protein expression on whole sections
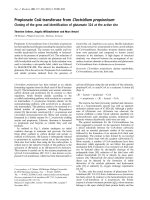
In order to check for surface homogeneity of immunor-
eactivity, we first stained 4 μm thick whole sections of
squamous cell lung carcinoma (Figure 1). No image pro-
cessing such as enhancement of contrast or brightness was
performed, except adjustment of white balance. Distinct
nuclear staining was achieved with all 4 protocols; how-
ever intensity and background varied significantly. Inten-
sity was higher for both antibodies with the H2-60
protocol, although on the cost of increased cytosolic back-
ground. The CC1-mono protocol yielded weaker staining,
particularly for D-10, but no background. Homogeneous
staining was observed over the entire tissue surface. Nuclei
were equally stained and no intranuclear compartmentali-
zation was visible apart from omission of nucleoli or
nuclear invaginations. Few stroma and necrosis (< 25% of
total surface) was present on the respective whole section,
but contributions of immunoreactivity from these com-
partments were negligible. We concluded that such a
Soltermann et al. Journal of Clinical Bioinformatics 2011, 1:25
/>Page 3 of 10
surface would be amenable to automated quantitative
intensity measurements including creation of a continuous
variable.
ERCC1 protein expression on hybrid C/TMA sections
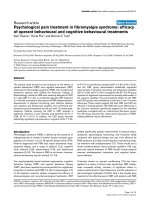
Consecutive C/TMA sections were first stai ned for H&E
and respective diagnostic markers. Representative images
are presented on Figure 2. Second, the four anti-ERCC1
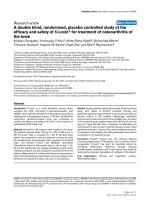
protocols were performed. Both antibodies yielded distinct
nuclear signals, although D-10 presented additional focal,
but strong background staining of the plasma membrane
and intracellular mucin vac uoles (Figure 3). Importantly,
many tumor cell clusters were heavily a dmixed with
inflamm atory cells also expressing ERCC1 with intensity
score 2 -3. Inflammatory cells of both malignant and benign
effusion sediments stained equally intense compared to
lymphatic parenchyma on histologic cores (Figure 4). The
same was observed for intratumoral inflammatory infil-
trates of histologic solid tumors (data not shown). Further,
the cores from the patients with non-malignant control
effusions all had reactive mesothelial cells again expressing
ERCC1 score 2-3. We concluded that ERCC1 staining
intensity of such surfaces is difficult to be quantitatively
measured since up to 50% of immunoreactivity is due to
surrounding reactive and inflammatory cells.
Distribution of intensity and H-scores
For practical reasons, ERCC1 protein expression levels
have been dichotomized in most publications closest to
the median into low/high, although alternative cut-of f’s
were tested [4,19], since the definition of “ERCC1 nega-
tive” is pending. To address this issue, the statistical distri-
butions of the ERCC1 scores were analysed as following:
ERCC1 means were consistently found to be in the 1.3 to
2.3 range for all protocols; D-10 antibody incubated with
the CC1-mono protocol defining the lower end (Table 2,
part A). No significant differences regardin g means were
found between intensity only and inten sity multip lied by
percentage of positive cells (H-score). Comparing cytologic
versus histologic cores, the average of all 8 means was
slightly lower in controls, but this was not significant (p-
value 1.000, Mann-Whitney U test).
Regarding distributions of possi ble score values in %, a
potential advantage of the H-score was again scarcely visi-
ble (Table 2, part B). Consider e.g. the D-10 ab with proto-
col CC1-mono: Multiplication with percentage of positive
cell s results in more degrees of freedom, but with regard
to dichotomization closest to the median, both intensity
and H scores need to be equally dichotomized 0 to 1 (55.5
and 56.4% low, respectively) against 2 to 3 (44.5 and 43.6%
high, respectively). Importantly, truly accepting only score
0and0.1as“ERCC1 negative” would mean that for the
D-10 antibody from zero (H2-60 protocol, intensity score)
to 32.5% (CC1-mono protocol, H-score) of tumors are
negative and thus primarily suited for cisplatin-containing
chemotherapy. How ever, for the 8F1 antibody much less
variation was found in the low expression range. Further,
using a dichotomization of 0 to 1 versus 2 to 3, from
43.6% (D-10 ab, CC1-mono, H-score) to 82.9% (8F1 ab,
H2-60, intensity score) of tumors would be classified as
ERCC1 high. We concluded that statistical distributions of
ERCC1 protein expression levels are dependent on techni-
cal aspects, in particular selection of antibody and incuba-
tion protocol.
Correlation with tumor entities and diagnostic markers
All ERCC1 scores were next computed against the tumor
categories (Table 2, part C a nd D). Female genital tract
carcinoma and mesothelioma had average score means
above 2, whereas the categories breast carcinoma and
other marked the lower end. Comparison of cytologic
with histologic scores showed similar mean values for
breast and female genital tract carcinoma, whereas the
lung adenocarcinoma controls had lower expression of
ERCC1 compared with cytologic cores. In more detail,
we computed scores among lung adeno, breast, female
genital tract and gastro-intestinal carcinoma as well as
Table 1 Overview of tissue cores assembled in the 2 C/
TMAs, including controls from reactive effusions and
histologic solid tumors
C/TMA 1 C/TMA 2 Total
nnn%
Tumoral cell blocks
Female Genital Tract Ca 13 26 39 33.3
Lung Adeno Ca 12 11 23 19.7
Mesothelioma 6 9 15 12.8
Unknown Primary 12 2 14 11.9
Gastro-Intestinal Ca 3 9 12 10.3
Breast Ca 3 7 10 8.6
Other 4 4 3.4
Total 53 64 117 100
Control cell blocks
Reactive pleural effusion 5
Total 5
Control histology
Female Genital Tract Ca 2 10
Lung Adeno Ca 1 10
Breast Ca 1 10
Mesothelioma 1
Oesophagus Ca 1
Colon Ca 1
Lung Squamous Cell Ca 1
Prostata Ca 1
Bladder Ca 1
Thoracic Lymph Node 1
Total 11 30
Soltermann et al. Journal of Clinical Bioinformatics 2011, 1:25
/>Page 4 of 10
mesothelioma by Kendall’s tau-b tests. The intensity and
H-score of the 8F1 antibody with protocol CC1-mono
were significantly lower in lung adenocarcinoma and
breast carcinoma. However, this relation was not found
with any of the other scores. We concluded that ce lls
from most common malignancies giving rise to pleural
or peritoneal effusion display a robust ERCC1 protein
expression and that no particular entity has completely
lost expression of this enzyme.
Discussion
In this study, we have investigated the immunochemical
performance of the 2 m ouse monoclonal anti-ERCC1
antibodies 8F1 and D-10 on cell blocks of malignant
pleural and peritoneal effusions assembled together with
histologic control cores to hybrid C/TMAs.
Oncologic trials have started using the ERCC1 expres-
sion level as stratification parameter for inclusion into a
respective study arm; therefore measurements must be
reproducible. Several studies in the precli nical, adjuvant
and palliative setting have been performed, using 2 main
laboratory approaches: First, patient tumor tissue was
examined for ERCC1 expression by either RT-PCR
(mRNA) or IHC (prot ein). Second, tumor tissue or per-
ipheral blood components were genotyped by PCR to
examine for SNPs (single nucleotide polymorphism).
However, resulting d ata (comprehensively reviewed in
[8,9]) is conflicting and entirelyoppositecorrelations
were observed. Main reasons for these discrepancies
may be differences between fresh frozen and FFPE tissue
[10], the small size of bronchial biopsies comprising
only few tumor cells and cohort bias due to histotype
composition. ERCC1 expression is e.g. higher in squa-
mous cell carcinoma compared to adenocarcinoma.
Assessment of SNPs is a new method, mainly investi-
gated in patients with advanced colorectal carcinoma
treated with oxaliplatin. Again, e.g. the allelic combina-
tion T/T was associated on the one hand with a better
8F1 CC1-mono
D-10 H2-60
8F1 H2-60
D-10 CC1-mono
Figure 1 Anti-ERCC1 immunohistochemistry on whole sections of a lung squamous cell carcinoma, using Mab 8F1 and D-10 with CC1-
mono and H2-60 protocols. Note increased cytosolic background with H2-60. Arrow: Necrotic centre. Arrowhead: Stromal axis. 100 × original
magnification.
Soltermann et al. Journal of Clinical Bioinformatics 2011, 1:25
/>Page 5 of 10
RR (response rate), on the other han d with increased
risk of progression [8].
For many patients with advanced cancer, only cytologic
smears and corresponding sediments may be available.
These sediments can be processed into paraffin cell blocks.
The cell block technology has attracte d much interest
since serial sections, potentially > 100, can be manufac-
tured and used for assessment of clinically relevant bio-
markers, such as EGFR and EML4-ALK (echinoderm
microtubule-associated protein-like 4; anaplastic lym-
phoma kinase) FISH (fluorescent in-situ hybridization) or
DNA extraction for PCR of EGFR exons 18-21. Data from
these cell block sections is highly comparable to corre-
sponding sections of histologic tissue biopsies or surgical
specimens due to the same cut thickness, in most labora-
tories 2 to 4 μm. Furthermore, paraffin cores of 0.6 mm
diameter from sediment blocks or also cell line pellets can
be assembled into a cytology microarray the same way
than cores from histologic blocks into a tissue microarray
[20-22]. A cell block may also be an effective quality assur-
ance tool for cancer registries and national mortality sta-
tistics [23], since no furth er diagnostic procedures maybe
performed if e.g . a positive pleu ral effusion def ines the
pM1a advanced stage of lung adenocarcinoma.
H&E
Colon Ca TTF-1
Ber-EP4
Figure 2 Whole section view of first hybrid C/TMA and representative core from cytologic cell block of a lung adenocarcinoma,
stained with H&E, Ber-EP4 and TTF-1. Lower left: control histologic core of a colon adenocarcinoma. Compare cellular density and thickness
of tissue between cytologic and histologic core.
Soltermann et al. Journal of Clinical Bioinformatics 2011, 1:25
/>Page 6 of 10
However, formalin fixation time between cytologic and
histologic cores can be significantly different. Clots of
tumor cells are quickly formed with plasma/thrombin
and often fixed only during the day for some hours. The
inlay cassette is then processed the same night on the
fixation/staining automat. Conversely, surgical specimens
are frequently fixed for up to 48 h before tissue cuts are
loaded on the over-night automat. Thus the major ques-
tion arises if cytologic cell blocks are usable the same
way for biomarker assessment or if additional tissue biop-
sies need to be taken. Notably, such biopsies are taken
only for biomarker investigation and are increasingly
considered as integral part of translational research pro-
tocols. Ethical concerns have been raise d for this strategy
and some organs such as lung have not negligible inter-
vention risk. On our hybrid C/TMAs we noticed that
inflammatory cells in the effusion sediments had equal
staining intensity compared to lymphatic parenchyma or
intratumoral inflammatory infiltrate of solid tumors on
histologic cores. Further, no significant differences in
ERCC1 immunoreactivity were found between tumor
cells in effusion liquid and solid sheets on histologic con-
trols. Thus, potential influence of fixation time and depth
of fixative penetration seems to be of minor importance.
Currently, im muno cyto chemistry can be performed on
several types of effusion preparations: Ethanol-fixed
smears, air-dried and post-fixed cytospins, liquid-based
thin laye rs (ThinPr ep), ethanol-fixed cell blocks and for-
malin-fixed cell blocks. Data on technique superiority is
conflicting. Som e au tho rs observed best immunoreactiv-
ity with ethanol-fixed smears [24]; others experienced
equal staining for non-nuclear but superior staining for
nuclear markers for formalin-fixed cell blocks in compar-
ison to ThinPrep slides [25]. In general, cell blocks seem
to give better morphology and less backg round staining
than cytospins or ThinPrep [26,27] and the use of a
8F1 CC1-mono
8F1 H2-60
D-10 CC1-mono
D-10 H2-60
Figure 3 Anti-ERCC1 immunocytochemistry on cell block core of malignant pleural mesothelioma, using Mab 8F1 and D-10 with CC1-
mono and H2-60 protocols. Arrow: Surrounding non-tumoral cells, including lymphocytes, macrophages and neutrophil granulocytes.
Arrowhead: Unspecific plasma membrane staining with D-10. 200 × original magnification. Inset lower left: Staining of intracellular mucin
vacuoles of a mucinous adenocarcinoma of unknown origin. 400 × original magnification.
Soltermann et al. Journal of Clinical Bioinformatics 2011, 1:25
/>Page 7 of 10
combined ethanol-formalin fixative has been reported to
best preserve the cyto-morphologic features [28]. We
thus believe that a formalin-fixation protocol is adequate
for a nuclear epitope. Concerning embedding medium,
agarose may be used as intermediate [29]. In our protocol
a clot is formed by addition of plasma and thrombin to
the cells. The question of optimal core diameter and
minimal cellularity has bee n addressed [29,30]. The dia-
meter of 0.6, 1, 2 or 3 mm defines the d ensity on the
glass slide, but core loss seems to be a minor problem
with any diameter. In contrast, cellularity is of major
importance when evaluating a larger antibody panel. The
distinction into low (1 to 20 cell clusters), moderate (20
to 40 cell clusters) and high cellularity (> 40 cell clusters),
one cell cluster being an aggregate ≥ 5 cells, seems rea-
sonable and we have implemented the same concept,
selecting only blocks with high cellularity. Concerning
automated IHC/ICC platforms, the Bond protocol may
yield a higher staining intensity due to an in-built
polymer amplification step in the detection kit. This is
althoughpaidbyaslightlyincreased diffuse background
staining. In general, both automated platforms are widely
used in routine pathology and reveal sufficient and robust
staining for many different antibodies.
Bioinformatics research is ongoing to generate software
tools for automated analysis of TMA localization data and
XLM-based standardized data capture and transfer [31].
As presented on F igure 2, our h ybrid C/TMAs are likely
to be amenable to automated localization software.
Further, markers such as Ber-EP4 or TTF-1 seem to be
suitable for automated quantitative intensity measure-
ments such as AQUA [32-34] or automated image texture
analysis [35], due to homogeneous surface staining and
absence of co-expressing background inflammatory cells.
However, such techniques would be difficult to perform in
case of ERCC1 (c.f. Figure 3). Also, parallel protein analy-
sis by immunoblot or mRNA techniques would not allevi-
ate the problem.
8F1 CC1-mono Cyto
8F1 CC1-mono Histo
8F1 H2-60 Cyto
8F1 H2-60 Histo
Figure 4 Cyto-histologic comparis on of anti- ERCC1 immunoreactivity using the protocol 8F1 CC1-mono (top) or 8F1 H2-60 (bottom).
Left: Pleural effusion sediment of lung adenocarcinoma. Right: thoracic lymph node. Arrow: Lymphocyte. Arrowhead: Streak of endothelial cells.
Asterisk: Tumor cell cluster. 400 × original magnification.
Soltermann et al. Journal of Clinical Bioinformatics 2011, 1:25
/>Page 8 of 10
In the original paper of ERCC1 IHC on human FFPE
tissue of NSCLC patients, the Mab 8F1 was used [4].
The specificity of this antibody was although recently
challenged [15,16], since 8F1stainedasecondspurious
band on immunoblots from human fibroblasts but not
HeLa cervical carcinoma cells and could not discrimi-
nate between ERCC1-positive and negative fibroblasts
on immunofluorescence. However, 8F1 confidently
detected His-tagged purified ERCC1. In reply, the
authors of the first NSCLC study demonstrated that in
the HeLa and the A549 lung adenocarcinoma cell lines,
one major band of 36 kD was observed on immunoblot
using 8F1 and this band disappeared after siRNA-
mediated depletion [11]. In this study, both 8F1 and D-
10 homogeneously and robustly stained the whole
nuclear surface. No intranuclear compartmentalization
was observed apart from omission of nucleoli or nuclear
invaginations. However, D-10 showed unspecific back-
ground staining at the plasma membrane and in intra-
cellular mucin vacuoles and was generally weaker on
same protocols.
Conclusions
In summary, cell block cytology micr oarrays (CMA) are
suitable for investigations of relevant clinical biomarkers
and can be mixed with TMA’s to yield C/TMA hybrids.
On the two automated IHC/ICC platforms Ventana
Benchmark
®
and Leica Bond
®
, the anti-ERCC1 antibody
Table 2 Summary of statistical data.
8F1 D-10
CC1-mono H2-60 CC1-mono H2-60
Int H Int H Int H Int H Average
A. Score means
Cell blocks 2.10 2.06 2.25 2.18 1.51 1.28 2.20 2.19 1.97
Histo controls 1.63 1.57 1.97 1.92 1.63 1.46 2.23 2.08 1.81
B. Distribution %
Cell blocks
0 1.7 1.7 3.4 3.4 12.8 12.8 0.0 0.9 4.6
0.1 0.0 0.9 0.0 4.3 0.0 19.7 0.0 0.9 3.2
0.5 0.0 1.7 0.0 2.6 0.0 10.2 0.0 5.0 2.4
1 21.4 21.4 13.7 7.6 42.7 13.7 17.9 12.8 18.9
1.5 0.0 0.0 0.0 0.0 0.0 0.0 0.0 0.9 0.1
2 41.9 39.3 37.6 36.8 24.8 23.9 44.5 42.7 36.3
3 35.0 35.0 45.3 45.3 19.7 19.7 37.6 36.8 34.3
Total 100.0 100.0 100.0 100.0 100.0 100.0 100.0 100.0 100.0
C. Score means
Cell blocks
Lung Adeno Ca 1.96 1.94 2.22 2.26 1.43 1.35 2.13 2.03 1.92
Breast Ca 1.90 1.61 1.90 1.81 1.60 1.37 1.90 1.65 1.72
Female Genital Tract Ca 2.13 2.13 2.28 2.20 1.72 1.48 2.33 2.29 2.07
Mesothelioma 2.47 2.47 2.40 2.34 1.80 1.53 2.40 2.40 2.23
Gastro-Intestinal Ca 2.33 2.33 1.92 1.83 1.25 1.10 2.00 2.00 1.85
Unknown Primary 1.93 1.86 2.57 2.57 1.21 0.69 2.21 2.11 1.89
Other 1.75 1.63 2.00 2.00 0.50 0.25 1.75 1.63 1.44
Histologic controls
Lung Adeno Ca 1.10 0.90 1.50 1.40 1.20 0.78 1.70 1.40 1.25
Breast Ca 1.90 1.90 2.00 1.95 1.60 1.50 2.50 2.35 1.96
Female Genital Tract Ca 1.90 1.90 2.40 2.40 2.10 2.10 2.50 2.50 2.23
D. Correlat.ion entities
Lung AdenoCa p 0.019 0.009 ns ns ns ns ns ns ERCC1 lower
Breast Ca tau 0.186 0.201 Lung Adeno
Female Genital Tract Ca and Breast Ca
Mesothelioma
Gastro-Intestinal Ca
A. Means of intensity and H-scores across cytologic (n = 117) and histologic (n = 30) cores. B. Distributions (%) of score values. C. Means of scores among tumor
entities on both cytologic and histologic cores. D. Correlation of ERCC1 scores with tumor entities (Kendall’s tau-b test used).
Soltermann et al. Journal of Clinical Bioinformatics 2011, 1:25
/>Page 9 of 10
8F1 performed superior compared to D-10 in terms of
staining quality and restriction to the nuclear
compartment.
Acknowledgements
We would like to thank P. Cione for excellent technical assistance in
manufacturing cell blocks.
Authors’ contributions
AS carried out the immunochemical scoring, performed statistical analysis
and drafted the manuscript together with HM. SKH and BB diagnosed
patients and assembled the cohort. SB carried out the immunochemistry,
MS manufacture d the C/TMAs. All authors read and approved the final
manuscript.
Competing interests
The authors declare that they have no competing interests.
Received: 6 September 2010 Accepted: 30 September 2011
Published: 30 September 2011
References
1. de Laat WL, Jaspers NG, Hoeijmakers JH: Molecular mechanism of
nucleotide excision repair. Genes Dev 1999, 13:768-785.
2. Friedberg EC: How nucleotide excision repair protects against cancer. Nat
Rev Cancer 2001, 1:22-33.
3. Martin LP, Hamilton TC, Schilder RJ: Platinum resistance: the role of DNA
repair pathways. Clin Cancer Res 2008, 14:1291-1295.
4. Olaussen KA, Dunant A, Fouret P, Brambilla E, Andre F, Haddad V, et al:
DNA repair by ERCC1 in non-small-cell lung cancer and cisplatin-based
adjuvant chemotherapy. N Engl J Med 2006, 355:983-91.
5. Soria JC: ERCC1-tailored chemotherapy in lung cancer: the first
prospective randomized trial. J Clin Oncol 2007, 25:2648-2649.
6. Schiller JH, Harrington D, Belani CP, Langer C, Sandler A, Krook J, et al:
Comparison of four chemotherapy regimens for advanced non-small-cell
lung cancer. N Engl J Med 2002, 346:92-98.
7. Fossella F, Pereira JR, von Pawel J, Pluzanska A, Gorbounova V, Kaukel E,
et al: Randomized, multinational, phase III study of docetaxel plus
platinum combinations versus vinorelbine plus cisplatin for advanced
non-small-cell lung cancer: the TAX 326 study group. J Clin Oncol 2003,
21:3016-3024.
8. Vilmar A, Sørensen JB: Excision repair cross-complementation group 1
(ERCC1) in platinum-based treatment of non-small cell lung cancer with
special emphasis on carboplatin: A review of current literature. Lung
Cancer 2009, 64:131-139.
9. Gossage L, Madhusudan S: Current status of excision repair cross
complementing-group 1 (ERCC1) in cancer. Cancer Treat Rev 2007,
33:565-577.
10. Booton R, Ward T, Ashcroft L, Morris J, Heighway J, Thatcher N: ERCC1
mRNA expression is not associated with response and survival after
platinum-based chemotherapy regimens in advanced non-small cell
lung cancer. J Thorac Oncol 2007, 2:902-906.
11. Olaussen KA, Fouret P, Kroemer G: ERCC1-specific immunostaining in non-
small-cell lung cancer. N Engl J Med 2007, 357:1559-1561.
12. Zheng Z, Chen T, Li X, Haura E, Sharma A, Bepler G: DNA synthesis and
repair genes RRM1 and ERCC1 in lung cancer. N Engl J Med 2007,
356:800-808.
13. Lee HW, Han JH, Kim JH, Lee MH, Jeong SH, Kang SY, et al: Expression of
excision repair cross-complementation group 1 protein predicts poor
outcome in patients with small cell lung cancer. Lung Cancer 2007,
59:95-104.
14. Kwon HC, Roh MS, Oh SY, Kim SH, Kim MC, Kim JS, et al
: Prognostic value
of expression of ERCC1, thymidylate synthase, and glutathione S-
transferase P1 for 5-fluorouracil/oxaliplatin chemotherapy in advanced
gastric cancer. Ann Oncol 2007, 18:504-509.
15. Niedernhofer LJ, Bhagwat N, Wood RD: ERCC1 and non-small-cell lung
cancer. N Engl J Med 2007, 356:2538-2540.
16. Bhagwat NR, Roginskaya VY, Acquafondata MB, Dhir R, Wood RD,
Niedernhofer LJ: Immunodetection of DNA repair endonuclease ERCC1-
XPF in human tissue. Cancer Res 2009, 69:6831-6838.
17. Wiatrowska BA, Krol J, Zakowski MF: Large-cell neuroendocrine carcinoma
of the lung: proposed criteria for cytologic diagnosis. Diagn Cytopathol
2001, 24:58-64.
18. Arbogast S, Behnke S, Opitz I, Stahel R, Seifert B, Weder W, et al:
Automated ERCC1 immunohistochemistry in non-small cell lung cancer:
Comparison of anti-ERCC1 antibodies 8F1, D-10 and FL-297. Appl
Immunohistochem Mol Morphol 2010, Oct. 27, E-pub.
19. Holm B, Mellemgaard A, Skov T, Skov BG: Different impact of excision
repair cross-complementation group 1 on survival in male and female
patients with inoperable non-small-cell lung cancer treated with
carboplatin and gemcitabine. J Clin Oncol 2009, 27:4254-4259.
20. Bubendorf L: Tissue microarrays meet cytopathology. Acta Cytol 2006,
50:121-122.
21. Pu RT, Giordano TJ, Michael CW: Utility of cytology microarray
constructed from effusion cell blocks for immunomarker validation.
Cancer 2008, 114:300-306.
22. Wirth GJ, Schandelmaier K, Smith V, Burger AM, Fiebig HH: Microarrays of
41 human tumor cell lines for the characterization of new molecular
targets: expression patterns of cathepsin B and the transferrin receptor.
Oncology 2006, 71:86-94.
23. Hsu FD, Nielsen TO, Alkushi A, Dupuis B, Huntsman D, Liu CL, et al: Tissue
microarrays are an effective quality assurance tool for diagnostic
immunohistochemistry. Mod Pathol 2002, 15:1374-1380.
24. Ueda J, Iwata T, Ono M, Takahashi M: Comparison of three cytologic
preparation methods and immunocytochemistries to distinguish
adenocarcinoma cells from reactive mesothelial cells in serous effusion.
Diagn Cytopathol 2006, 34:6-10.
25. Gong Y, Sun X, Michael CW, Attal S, Williamson BA, Bedrossian CW:
Immunocytochemistry of serous effusion specimens: a comparison of
ThinPrep vs cell block. Diagn Cytopathol 2003, 28:1-5.
26. Fetsch PA, Simsir A, Brosky K, Abati A: Comparison of three commonly
used cytologic preparations in effusion immunocytochemistry. Diagn
Cytopathol 2002, 26:61-66.
27. Pereira TC, Saad RS, Liu Y, Silverman JF: The diagnosis of malignancy in
effusion cytology: a pattern recognition approach. Adv Anat Pathol 2006,
13:174-184.
28. Nathan NA, Narayan E, Smith MM, Horn MJ:
Cell block cytology. Improved
preparation and its efficacy in diagnostic cytology. Am J Clin Pathol 2000,
114:599-606.
29. Wen CH, Su YC, Wang SL, Yang SF, Chai CY: Application of the microarray
technique to cell blocks. Acta Cytol 2007, 51:42-46.
30. Anagnostou VK, Lowery FJ, Syrigos KN, Cagle PT, Rimm DL: Quantitative
evaluation of protein expression as a function of tissue microarray core
diameter: is a large (1.5 mm) core better than a small (0.6 mm) core?
Arch Pathol Lab Med 2010, 134:613-619.
31. Dhir R: Tissue microarrays: an overview. Methods Mol Biol 2008,
441:91-103.
32. Gustavson MD, Bourke-Martin B, Reilly D, Cregger M, Williams C, Mayotte J,
et al: Standardization of HER2 immunohistochemistry in breast cancer by
automated quantitative analysis. Arch Pathol Lab Med 2009,
133:1413-1419.
33. Moeder CB, Giltnane JM, Moulis SP, Rimm DL: Quantitative, fluorescence-
based in-situ assessment of protein expression. Methods Mol Biol 2009,
520:163-175.
34. Rojo MG, Bueno G, Slodkowska J: Review of imaging solutions for
integrated quantitative immunohistochemistry in the Pathology daily
practice. Folia Histochem Cytobiol 2009, 47:349-354.
35. Karacali B, Tozeren A: Automated detection of regions of interest for
tissue microarray experiments: an image texture analysis. BMC Med
Imaging 2007, 7 :2.
doi:10.1186/2043-9113-1-25
Cite this article as: Soltermann et al.: Automated ERCC1
immunochemistry on hybrid cytology/tissue microarray of malignant
effusions: evaluation of antibodies 8F1 and D-10. Journal of Clinical
Bioinformatics 2011 1:25.
Soltermann et al. Journal of Clinical Bioinformatics 2011, 1:25
/>Page 10 of 10