báo cáo khoa học: " An imbalance in progenitor cell populations reflects tumour progression in breast cancer primary culture models" ppt
Bạn đang xem bản rút gọn của tài liệu. Xem và tải ngay bản đầy đủ của tài liệu tại đây (2.44 MB, 10 trang )
RESEARCH Open Access
An imbalance in progenitor cell populations
reflects tumour progression in breast cancer
primary culture models
Simona Donatello
1
, Lance Hudson
1
, David C Cottell
2
, Alfonso Blanco
3
, Igor Aurrekoetxea
1,4
, Martin J Shelly
5
,
Peter A Dervan
6
, Malcolm R Kell
7
, Maurice Stokes
7
, Arnold DK Hill
1
and Ann M Hopkins
1*
Abstract
Background: Many factors in fluence breast cancer progression, including the ability of progenitor cells to sustain
or increase net tumour cell numbers. Our aim was to define whether alterations in putative progenitor populations
could predict clinicopathological factors of prognostic importance for cancer progression.
Methods: Primary cultures were established from human breast tumour and adjacent non-tumour tissue. Putative
progenitor cell populations were isolated based on co-expression or concomitant absence of the epithelial and
myoepithelial markers EPCAM and CALLA respectively.
Results: Significant reductions in cellular senescence were observed in tumour versus non-tumour cultures,
accompanied by a stepwise increase in proliferation:senescence ratios. A novel correlation between tumour
aggressiveness and an imbalance of putative progenitor subpopulations was also observed. Specifically, an
increased double-negative (DN) to double-positive (DP) ratio distinguished aggressive tumours of high grade,
estrogen receptor-negativity or HER2-positivity. The DN:DP ratio was also higher in malignant MDA-MB-231 cells
relative to non-tumourogenic MCF-10A cells. Ultrastructural analysis of the DN subpopulation in an invasive tumour
culture revealed enrichment in lipofuscin bodies, markers of ageing or senescent cells.
Conclusions: Our results suggest that an imbalance in tumour progenitor subpopulations imbalances the
functional relationship between proliferation and senescence, creating a microenvironment favouring tumour
progression.
Background
Breast cancer is a heterogeneous disease of considerable
social and economic burden. Significant interest sur-
rounds the question whether cancer stem/progenitor
cells drive tumour formation [1,2], however it remains
to be und erstood if progenitor analysis has prognostic
value in cancer patients. One approach towards interro-
gating this involves using patient tumour primary cul-
tures to correlate in vitro data and clinicopathological
information.
Breast progenitor cells are isolated based on expression
of markers suggesting capabilities to generate cells of
mixed myoepithelial and luminal epithel ial lineages [3,4].
Other methods involve isolation of cells positive for alde-
hyde dehydrogenase (ALDH) activity [5], or ultrastruc-
tural identification [6]. Importantly, primary breast
cultures retain progenitor/stem cell populations [7].
Using primary cultures from human breast tumour
and non-tumour tissue, we sought to define correlations
between progenitor cell numbers and clinicopathological
or functional indicators of cancer aggressiveness. Our
results demonstrate an imbalance between two putative
progenitor cell populations inclinicopathologically-
aggressive tumours, in conjunction with functional
alterations promoting increased proliferation or reduced
growth arrest. Taken together, full investigations of pro-
genitor populations in relation to clinicopathological
parameters could make an important contribution
* Correspondence:
1
Department of Surgery, Royal College of Surgeons in Ireland; Dublin, Ireland
Full list of author information is available at the end of the article
Donatello et al. Journal of Experimental & Clinical Cancer Research 2011, 30:45
/>© 2011 Donatello et al; licensee BioMed Central Ltd. This is an Open Access article distributed under the terms of the Creative
Commons Attribution License ( which permits unrestricted use, distribution, and
reproduction in any medium, provi ded the original work is properly cited.
towards a better understanding of breast cancer
progression.
Methods
Reagents
Suppliers: trypsin-EDTA, penicillin/streptomy cin, peni-
cillin/streptomycin/neomycin, fungizone, Cyquant, X-
gal, Alexa-Fluor antibodies (Invitrogen); soybean trypsin
inhibitor, collagenase I, hyaluronidase 1-S, DMEM/
Ham’s F12, bovine insulin, peroxidase-labelled secondary
antibodies (Sigma) ; HMEC, mammary epithelial growth
medium (MEGM) kits, foetal bovine serum (FBS,
Lonza); glutaraldehyde (Fluka); osmium tetroxide (Elec-
tron Microscopy Services). Antibody suppliers: actin,
ESA and SMA (Sigma); cytokeratin-19, PE-conjugated
CALLA, F ITC-conjugated EPCAM, FITC- or PE-conju-
gated IgG controls (Dako); cytokeratin-18 (Abcam);
cytokeratin-14 (Millipore); vimentin and p63 (BD
Biosciences).
Primary cultures
Breast primary cultures were generated from patient lum-
pectomy/mastectomy samples with informed consent as
approved by the Medical Ethics committees of Beaumont
Hospital and the Mater Misericordiae Hospital, in accor-
dance with the Declaration of Helsinki. One piece each of
tumour tissue and non-tumour margins (Additional file 1)
were cultured as described [8]. Tissues were incubated in
10X penicillin/streptomycin/neomycin, minced in
DMEM/F12 containing 1X penicillin/streptomycin/neo-
mycin, 10% FBS, 10 μg/ml insulin, 5 μg/ml fungizone,
100U/ml hyaluronidase 1-S, 20 0U/ml collagenase and
rotated for 2 hours/37°C. Supernatants were pelleted,
washed and cultured in MEGM. Occasional fibroblast
contamination was removed by brief trypsinization (to
remove fibroblasts but not underlying epithelial cells), and
cultures containing >30% fibroblasts were discarded. In
some experiments, primary human mammary epithelial
cells (HMEC, Lonza) were cultured in MEGM.
Breast cell lines
MCF10A and MDA-MB-231 cells (ATCC) grown nor-
mally in DMEM-F12, 5% horse serum, 0.5 μg/ml hydro-
cortisone, 10 μg/ml insulin, 100 ng/ml cholera toxin, 20
ng/ml human recombinant EGF (MCF10A) or DMEM,
10% FBS, 2 mM L-glutamine(MDA-MB-231) were con-
ditioned in MEGM for 2-3 weeks and used in flow cyto-
metry experiments as controls for normal and
tumourogenic phenotypes respectively.
Proliferation assays
Primary cells (5 × 10
3
) were plated in triplicate and har-
vested after 0, 3 or 6 days. Cyquant solution was incubated
on freeze-thawed cells (5 min), and emitted fluorescence
detected at 520 nm on a Wallac plate-reader. Fluorescence
readings of unknown samples were translated into cell
numbers by referring to two separate fluorescence stan-
dard curves - one for non-tumour and one for tumour
cultures- constructed from known cell numbers (Addi-
tional file 2). The slope of each proliferation graph was cal-
culated from the linear regression line using the formula y
=mx+c,wherem=slopeandc=y-intercept.
Senescence-associated b-galactosidase assays
Primary cells (5 × 10
4
) were plated in duplicate, and
stained for senescence-associated b-galactosidase activity
[9]. Three brightfield micrographs per condition were
captured, and blue senescent cells expressed as a per-
centage of total cells/field.
Immunofluorescence staining for epithelial and
myoepithelial markers
Primary cells (passage 1-2) grown in chamber slides
were fixed in 3.7% paraformaldehyde and immunos-
tained for epithelial (K19, K18, ESA) or myoepithelial
(SMA, K14, VIM) markers using DAPI as a n uclear
counter-stain. Primary antibodies were omitted in nega-
tive controls, and slides visualized on a Zeiss LSM510-
meta confocal microscope.
SDS-PAGE and Western blotting
Confluent primary cultur es were harvested in RIPA (20
mM Tris-HCl pH7.5, 150 mM NaCl, 5 mM EDTA, 1%
Triton-X100) containing protease and phosphatase inhi-
bitors. Lysates were dounced and 25 μg supernatant
subjected to SDS-PAGE and Western blot analysis for
K19, K18, VIM and p63.
FACS analysis of putative progenitor cell populations
Confluent passage 0 primary cells ( T25 flask/condition)
were trypsinized, blocked in human serum an d co-incu-
bated with FITC-conjugated mouse anti-human EPCAM
and PE-conjugated mouse anti-human CALLA (4°C/30
min). Negative controls were unlabelled or single-
stained with FITC-EPCAM, PE-CALLA, FITC-IgG or
PE-IgG. Cells were analyzed on a Beckman Coulter
Cyan-ADP and/or an Accuri-C6 flow cytometer. Cells
were sorted into CALLA
+
/EPCAM
+
, CALLA
+
/EPCAM
-
,
CALLA
-
/EPCAM
-
or CALLA
-
/EPCAM
+
populations on
a BD FACSAria cell sorter. Some passage 0 cells were
analyzed for activity of the stem cell marker ALDH by
Aldefluor assay [5]. Briefly, 2 × 10
5
cells were resus-
pended in assay buffer and incubated with activated sub-
strate or the negative control reagent before analysis.
Transmission electron microscopy (TEM)
Passage 0 primary cultures or HMECs were fixed with
2.5% glutaraldehyde, processed as described [10] and
Donatello et al. Journal of Experimental & Clinical Cancer Research 2011, 30:45
/>Page 2 of 10
analyzed on a FEI-Tecnai transmission electron micro-
scope. TEM was also performed on sorted DN subpopu-
lations expanded in 24-well plates.
Calculations and statistics
Data are expressed as mean ± standard error of the
mean. Non-tumour versus tumour results were com-
pared using non-param etric tests and one- tailed
unpaired t-tests. Population variances were first com-
pared u sing Instat-3.3.6 to inform the choice of equal/
unequal variance between populations. The prolifera-
tion:senescence ratio was calculated based upon the data
shown in Figure 2B - the linear regression slopes of pro-
liferation graphs and the percentages of senescent cells
at the timepoint measured.
Results
Primary breast cultures recapitulate the cellular balance
of human breast
Primary cultures of both non-tumour (NT) and tumour
(T) human breast tissue yielded adherent organoids with
outwardly-proliferating colonies (Figure 1A, left). Two
cellular populations were observed - large polygonal
cell s in colony centres (lpc; Figure 1A, right), and small
polygonal cells (spc) at the peripheries. Since spc and
lpc resembled respectively myoepithelial and luminal
epithelial cells, expression of epithelial and myoepithelial
markers was examined by immunofluorescence micro-
scopy (Figure 1B). In comparison to the negative control
(-ve), cultures were mostly dual-positive for epithelial
markers such as K18, K19 or epithelial-specific antigen
(ESA) and myoepithelial markers such as K14, vimentin
or smooth muscle actin (SMA). Western blot (Figure
1C) detection of K18 was not as sensitive as immufluor-
escenceanalysis,sinceonlysomeofthecultures
expressed K18. Interestingly our analysis (Figure 1C)
also revealed that 3 out of 4 non-tumour cultures
expressed high levels of the epithelial marker K19 and
low levels of the myoepithelial marker p63. In contrast,
3outof4tumourculturesexpressedlowlevelsofK19
but high levels of p63. Western blotting analysis also
confirmed high expression of the myoepithelial marker
vimentin.
Ultrastructural and functional properties of breast
primary cultures separate non-tumour and tumour
primary cultures
Ultrastructural analysis of matched cultures was under-
taken to c onfirm differences between tumour and non-
tumour specimens (Figure 2). Firstly, tumour cells were
considerably larger than non-tumour cells (~100 μm
versus 16 μm respectively along wides t axis, data not
shown). Extensive abnormal vesiculation patterns were
identified in the peri-nuclear regions of tumour versus
non-tumour cultures (Figure 2A, V
NT
versus V
T
). Multi-
nucleation of tumour cells was frequently observed, in
parallel with compromised nuclear membranes (Figure
2A, N M
NT
versus NM
T
). Furthermor e, tumour cell
mitochondria were abnormal, elongated and occasionally
fus ed (Figure 2A, M
NT
versus M
T
). Finally, non-tumour
cells displayed a well-differentiated rough endoplasmic
reticulum (RER) while that in tumour cells was frag-
mented and dispersed (Figure 2A, R
NT
versus R
T
).
We next investigated if morphological differences were
accompanied by cell fate differences (Figure 2B). Prolif-
eration abilities were assessed by Cyquant assay on 4
non-tumour cultures and 12 tumour cultures - 5 low
grade (LG, grade 1-2) and 7 high grade (HG, grade 3).
Values were calculated relative to a standard curve o f
fluorescence intensity versus known cell numbers (Addi-
tional file 2). A significant increase in proliferation was
observed in high grade tumour cultures (HG; grade 3)
relative to non-tumour or low grade tumour cultures
(LG; grades 1-2; Figure 2B, left). Since Cyquant prolif-
eration assays quantify all cells rather than just actively-
proliferating cells, we performed senescence-associated
(SA) b-galactosidase assays [9] to estimate growth arrest
(Figure 2B, right). Non-tumour cultures had two-fold
higher SA-b-galactosidase staining than that in tumour
cultures. This was independent of the grade of the origi-
nat ing tumour, and did not reflect an impaired capacity
to senesce in response t o exogenous stimulation (data
not shown).
As the balance between proliferation and senescence is
more importa nt than either parameter a lone, we exam-
ined whether altered proliferation:senescence ratios in
breast primary cultures could identify aggressive
tumours. The proliferation:senescence relationship was
estimated based on proliferation graph slopes and senes-
cence values (Figure 2B). Our data reve aled a stepwise
increase in proliferation:senescence ratio from non-
tumour through LG and finally HG tumours, correlating
with a simple model of tumour progression (Table 1).
Alterations in putative progenitor cell subpopulations
correlate with aggressive tumours
Since progenitor cells control the generation of new
cell s in a tissue, we questioned if alterations in progeni-
tor populations could distinguish between aggressive
and non-aggressive tumours. Several pieces of evidence
suggested the presence of progenitors in primary cul-
tures. Firstly, tumour and non-tumour cultures exhib-
ited epithelial and myoepithelial co-differentiati on
(Figure 1). Secondly, they expressed the myoepithelial
marker p63 (Figure 1C) which is also a progenitor mar-
ker [11]. Thirdly, filter-grown cultures had basal elec-
tron-lucent, glycogen-rich cells (Figure 3aarrow)
resembling those described as progenitor/stem cells in
Donatello et al. Journal of Experimental & Clinical Cancer Research 2011, 30:45
/>Page 3 of 10
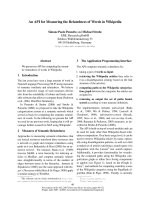
B.
NT14
K18ESA
SMAK14VIM
K19
NT20NT19
NON-TUMOUR
EPITHELIALMYOEPITHELIAL
T16T13 T18
TUMOUR
Negative
controls
NON-TUMOUR
TUMOUR
A.
spc
lpc
lpc
spc
NON-TUMOUR TUMOUR
C.
K19
Actin
NT23 NT30 NT40 NT41 T25 T26 T28 T39
p63
K18
Vim
NON-TUMOUR TUMOUR
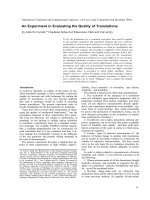
Figure 1 Characteriza tion of tumour and non-tumour primary cultures. A. Organoid-d erived cultures (A, top panels, 10X magnification)
from both tumour and non-tumour specimens had large polygonal cells (lower panels, lpc) surrounded by small polygonal cells (lower
panels, spc, 20X magnification). B. Representative tumour and non-tumour cultures (passages 1-3) were analyzed for expression of the
epithelial markers K19, K18 and ESA and the myoepithelial markers SMA, K14 and vimentin (scale bar 50 μm). C. Representative cultures were
immunoblotted for expression of epithelial (K19, K18) and myoepithelial (vimentin, p63) markers.
Donatello et al. Journal of Experimental & Clinical Cancer Research 2011, 30:45
/>Page 4 of 10
mammary duct basal laminae [6]. Apicall y-located cells
were attenuated and squamous-differentiated (Figure 3b,
top arrow). Layering of dark filament-rich cells (Figure
3b arrows) with light glycogen-rich cells (Figure 3b
arrowhead) was observed in all cultures (Figure 3c).
Flow cytometry was used to isolate putative progenitor
populations f rom primary cultures and search for links
with clinicopathological evidence of tumour progression.
Non-tumour and tumour cultures were analyzed for
expression of CALLA ( myoepithelial) and EPCAM
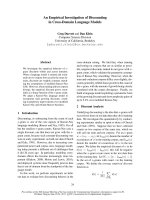
Figure 2 Ultrastructural and functional differences distinguish non-tumour from tumour primary cultures. A. TEM analysis of non-tumour
cells revealed modest numbers of cytoplasmic vesicles (V
nt
), single nuclei, distinct nuclear double membranes (NM
nt
), regular mitochondria (M
nt
)
and well-organized RER (R
nt
). Tumour cells showed abnormal peri-nuclear vesicles (V
t
), >1 nucleus per cell with thin nuclear membranes (NM
t
),
abnormal mitochondria (M
t
) and disorganized RER (R
t
). B. Proliferation was enhanced in HG tumour cultures relative to LG tumour cultures or
non-tumour cultures (left). Basal senescence, estimated by SA-b-galactosidase staining, was lower in tumour versus non-tumour cultures (right;
p < 0.001).
Donatello et al. Journal of Experimental & Clinical Cancer Research 2011, 30:45
/>Page 5 of 10
(epithelial) markers [4,12]. All cultures had highest
expressi on of CALLA and lowest expression of EPCAM
single-positive cells, with double-negative (DN) popula-
tions exceeding double-positive (DP). Results were
grouped according to clinicopathological factors of prog-
nostic relevance, namely tumour grade and expression
of ER and HER2 (Figure 4A). The DP population w as
significantly reduced in aggressive HG relative to LG
tumour or non-tumour cultures (p < 0.05), while the
CALLA population increased significantly. Both DN and
EPCAM populations decreased slightly with increasing
grade. Trends were similar inaggressiveER-negative
tumour cultures, but not statistically significant. Inter-
estingly, the DN population was increased in aggressive
HER2-positive relative to HER2-negative tumours,
resembling the larger DN profile of non-tumour cells.
Given DN differences in aggressive HG or ER-negative
tumours versus aggressive HER2-positive tumours, we
performed ultrastructural analysis on DN populations
from one non-tumour and one tumour culture (grade 2
IDC, ER+, HER2+). Although both populations had
many similarities (data not shown), unique to the
tumour DN populat ion was the presence of abundant
lipofuscin b odies (Figure 4B, arrows). These markers of
cellular ageing were also observed in unsorted normal
and pre-invasive tumour cultures (data not shown).
Since both DN and DP popula tions are putative pro-
genitor/stem cells [3,4], we questioned whether popula-
tion ratios better reflected tumour progression than
changes in single populations (Figure 4C). Increased
DN:DP ratios were observed in all aggressive tumour
cultures ( HG, ER- or HER2+) relative to non-tumour or
non-aggressive tumour cultures. A DN:DP increase was
also noted i n metastatic MDA-MB-231 cells versus nor-
mal MCF- 10A cells (Figure 4D). For these exp eriments,
MDA-MB-231 and MCF-10A cells were switched from
their normal media and conditioned to grow in MEGM
(as used for primary cultures). Although this was not
their preferred medium, the cells grew well and w e did
not observe any morphological diffe rences as a result of
media switching ( Additional file 3). We also analyzed
ALDH activity to estimate progenitor cell numbers. A
low percentage of cells were ALDH-positive (Figure 4E,
left). However ALDH activity in LG tumour cultures
was significantly higher than that in non-tumour cul-
tures (Figure 4E, right). Interestingly, ALDH activity
dropped significantly from L G to HG cultures, to lower
than that in non-tumour cultures (p < 0.001). This mir-
rored observed reductions in both DP and DN popula-
tions in HG versus LG tumour cultures (Figure 4A).
Discussion
Intriguing recent work has suggested that immunohisto-
chemical profiling of breast tumours for cancer stem
Table 1 Increased proliferation:senescence ratios
correlate with tumour progression
Proliferation:Senescence ratio
Non-tumour (P n = 4; S n = 4) 1.9
Low-grade tumours (P n = 5; S n = 4) 9.5
High-grade tumours (P n = 7, S n = 8) 23.8
where P = proliferation assays, S = senescence assays.
The ratio of proliferation:senescence was calculated for non-tumour, low
grade tumour and high grade tumour primary cultur es using the slope of
proliferation graphs and senescence values from Figure 2B. An increased ratio
was observed in the stepwise progression from non-tumour to low grade
tumour to high grade tumour categories.
A.
basal
B.
apical
C.
filter
Plump cells
Filament-rich cells
Glycogen-rich cells
Dead cells
2 m2 m
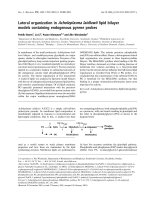
Figure 3 Ultrastructural identification of putative proge nitor cells in primary cultures. HMEC and tumour primary cultures analyzed by
TEM were observed to grow as multi-layers, with basally-located cells having plump morphologies (a, arrow) compared to the attenuated
morphologies of apically-located cells. Filament-rich cells (b, arrows) were layered with glycogen-rich cells (b, arrowhead). A schematic
representation of cellular organization is shown in (c).
Donatello et al. Journal of Experimental & Clinical Cancer Research 2011, 30:45
/>Page 6 of 10
cell populations may have prognostic value [13]. To
probe at a cellular level the relationship b etween pro-
gen itor cells and clinicopathological indicators of breast
cancer progression, we isolated primary cells from
tumour and non-tumour tissue and cultured them in
serum-free medium [14]. Although many isolation
methods and media formulations have been described
over the years, we chose this method because it allowed
us a high yield of cells from small tissue samples and
because the commercially-available medium offered
advantages of consistency and reproducibility relative to
self-made medium. Using these culture conditions, most
cultures presented two cell-type populations as
described [7,15,16], namely large and small polygonal
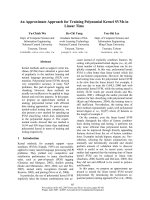
% ALDH1-positive cells
0
10
20
30
40
50
NON-TUMOUR (n=5)
TUMOUR (n=5)
NON-TUMOUR
LG
HG
ER pos
ER neg
Her2 NEG
Her2 POS
DN:DP ratio
0
1
2
3
4
5
6
7
NON-TUMOUR
NON AGGRESSIVE TUMOUR
AGGRESSIVE TUMOUR
% ALDH1-positive cells
0
10
20
30
40
50
NON-TUMOUR (n=5)
TUMOUR LG (n=2)
TUMOUR HG (n=3)
**
*
Her2 status
CALLA DP DN EPCAM
%
cells
0
20
40
60
80
100
NON-TUMOUR (n=9)
TUMOR Her2 neg (n=2)
TUMOR Her2 pos (n=4)
ER status
CALLA DP DN EPCAM
0
20
40
60
80
100
NON-TUMOUR (n=9)
TUMOUR ER pos (n=5)
TUMOUR ER neg (n=2)
MCF-10A MDA-MB-231
50
100
250,000
500,000
DN:DP ratio
A.
B.
C.
D.
E.
Tumour grade
CALLA DP DN EPCAM
% cells
0
20
40
60
80
100
NON-TUMOUR (n=9)
TUMOUR LG (n=4)
TUMOUR HG (n=3)
*
*
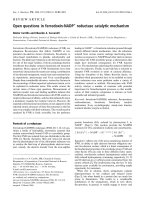
Figure 4 Isolation of putative progenitor cells from primary cultures and cell lines. A. Breast primary cultures were sorted into CALLA
single-positive, EPCAM single-positive, double-positive (DP) or double-negative (DN) populations, and expressed as a percentage of total cells. B.
TEM analysis revealed a high content of lipofuscin bodies in the DN population sorted from a tumour culture (arrows). C. The DN:DP ratio
increased in three types of aggressive tumour (high grade, ER-negative or HER2-positive) relative to non-tumour or non-aggressive tumour
cultures. D. The DN:DP ratio in metastatic MDA-MB-231 cells exceeded that in non-tumourogenic MCF-10A cells. E. Activity of the stem cell
marker ALDH was similar in non-tumour versus pooled tumour cultures (left), but significantly higher in non-tumour and low grade tumour
cultures compared to high grade tumour cultures (p < 0.001; right).
Donatello et al. Journal of Experimental & Clinical Cancer Research 2011, 30:45
/>Page 7 of 10
cell s which are presumptive epithelial and myoepithelial
cells respectively. A relatively crude isolation approach
which allows retention of multiple cellular populations
may offer advantages over isolation approaches in which
cells are purified to homogeneity, since a mixed cell
population better recapitulates the cellular balance of
tumours in vivo.
Myoepithelial marker e xpression was found to dom i-
nate over luminal epithelial e xpression, consistent with
observations in HMEC [17,18]. Expression studies have
linked myoepithelial and mesenchymal/basal-like pheno-
types; the latter associated with poor patient progno sis
[19]. While some studies favour separate media formula-
tions [20], our ultrastructural data suggested t hat
MEGM supported separate growth of non-tumour and
tumour populations. For example, malignant character-
istics including abnormal v esiculation, branched mito-
chondria, poorly-developed RER and multi-nucleation
were observed only in tumour cultures.
Mesenchyma l/basal-like phenotypes also promote pro-
genitor grow th and tissue regeneration [21]. The expres-
sion of the myoepithelial marker p63 was recently
described to be involved in the develop ment of stratified
epithelial tissue such as that of the breast, and it has
been associated with the presence of progenitor cells
and tumour progression [11]. Interestingly, most of our
non-tumour cultures expressed the luminal epithelial
marker K19, but low levels of the myoepithelial (and
progenitor) marker p63, while tumour cultures conver-
sely expressed low levels of K19 and high levels of p63.
These data may suggest that non-tumour culture s are
enriched in more differentiated cells (K19-positive) than
tumour cultures which may be less differentiated and
more enriched in multipotent or non-specialized cells
(p63-positive) [22]. While K14/K18 are generic markers
for discerning epithelial versus myoepithelial cells, K19/
p63 are considered to discriminate more differentiated/
specialized cells versus non differentiated/specialized
cells [11,18,23]. In addition, CALLA/EPCAM have been
described to better detect progenitor populations [12].
In fact, we used CALLA and EPCAM as myoepithelial
and epithelial markers to subdivide cultures into termin-
ally-differentiated or undifferentiated (putative progeni-
tor) populations. Both populations, double positive (DP)
and double-negative (DN) for these markers have been
described as putative progenitor cells [3,4]. Our cultures
had large DN populations and highest expression of
myoepithel ial markers, in accordance with other reports
[12].
We sought to correlate subpopulation changes with
tumour clinicopathological parameters, and observed
decreased DP populations in aggressive tumours of high
grade or ER negativity. ALDH activity was also reduced
in HG tumours, an interesting fact since ALDH
expression has been correlated with poor prognosis in
breast cancer [ 5,24] - although the opposite has been
reported in ovarian cancer [25]. However we did observe
increased ALDH activity in LG tumours relative to non-
tumour cultures. Taken together, our results could sug-
gest that DP, DN a nd ALDH-positive populations are
progenitor cells lost from aggressive HG or ER-negative
tumours. Perhaps such progenitor cells generate fully-
differentiated cells in normal tissue, and their loss could
favour undifferentiated phenotypes in aggressive
tumours. The DN population was also lower in aggres-
sive HG or ER-negative tumours, but not in aggressive
HER2-positive tumours. If individual cells over-expres-
sing HER2 are indeed tumour-initiators [26], o ur DN
results could represent a progenitor population associat-
ing with HER2 expression.
DN and DP populations have been described as
slightly different putative progenitor/stem cell popula-
tions; with D N representing an undiffer entiated popula-
tion while DP represents a multipotent population
[4,12]. Since in normal tissue the balance between these
2 populations is tightly regulated, we wondered if the
balance is disrupted in malignant phenotypes and may
be a marker of tumour progression. Thus in an attempt
to mathematically reflect this balance, we calculated the
ratios between DN and DP subpopulations. Importantly,
we show that a DN/DP imbalance (in the f orm of
increased DN:DP ratios) identifies all three types of
aggressive tumour, namely HG, ER-negative or HER2-
positive. The abundanc e of lipofuscin bodies, markers of
cellular ageing, in tumour DN populations is an interest-
ing point. Since premature senescence was reduced in
tumour versus non-tumour cultures, we speculate that
tumour DN populations represent undifferentiated cells
capable of senescing, and that DN reductions in a ggres-
sive HG or ER-negative tumours suggest loss of an
endogenous tumour-suppressive mechanism.
Interestingly, we did not observe DN reductions in
HER2-positive cultures. However elevated HER2 can
drive premature senescence [27], and high DN:DP ratios
better identify aggressive tumours than DN changes
alone. Thus loss of a putative pro-senescence (DN)
“normal” population is unlikely to drive tumour progres-
sion unless proliferation is high. Any pro-senescence
(anti-tumourogenic) effects of HER2 could be out-
weighed by the pro-proliferative e ffects of HER2 [28].
Our study has illustrated a stepwise increase in prolif-
eration:senescence ratios through non-tumour, LG and
HG tumours. The proliferation:senescence balance is an
important determinant of tumour progression, dor-
mancy or regression. If the DN:DP ratio estimates this,
it could have prognostic value. Although progenitor iso-
lation using markers will never recapitulate the com-
plexity of these plastic and diverse cellular populations,
Donatello et al. Journal of Experimental & Clinical Cancer Research 2011, 30:45
/>Page 8 of 10
our study nonetheless illustrates that marker studies can
yield important insights into clinical samples.
Conclusions
We have reported reduced senescence in tumour versus
non-tumour breast primary cultures, and s tepwise
increases in the proliferation:senescence ratio with
incre asing tumour grade. Isolation of putative progenitor
subpopulations revealed a novel correlation between
increased DN:DP ratios and clinicopathological indica-
tors of aggressive tumours (HG, ER-negativity or HER2-
positivity). Our data suggest that progenitor p opulation
imbalance could promote tumour progression by altering
the relationship between proliferation and senescence
(Figure 5). Future investigations relating clinicopathologi-
cal factors to alterations in progenitor cell populations
may be valuable in dissecting mechanisms a ssociated
with progenitor-driven breast tumour progression.
Additional material
Additional file 1: Primary culture patient information.
Additional file 2: Proliferation assay standard curves for tumour
and non-tumour cultures. Two non-tumour and two tumour cultures
were used to generate standard curves to calculate numbers of cells
from fluorescence values obtained at different time points of the
Cyquant proliferation assays.
Additional file 3: MEGM medium does not alter the morphology of
MCF-10A and MDA-MB-231 cells. MCF-10A and MDA-MB-231 cells
were cultured for 15 days in MEGM or their standard serum-positive
media, and imaged by phase contrast microscopy. No overt
morphological differences were observed in either cell type after the
media was switched.
Abbreviations
MEGM: mammary epithelial growth medium; HMEC: human mammary
epithelial cells; DCIS: ductal carcinoma in situ; IDC: invasive ductal carcinoma;
LC: lobular carcinoma; ITLC: invasive tubular lobular carcinoma; SA-β-gal:
senescence-associated β-galactosidase; ER: estrogen receptor; PR:
progesterone receptor; ESA: epithelial-specific antigen; SMA: smooth muscle
actin; VIM: vimentin; CALLA: common acute lymphoblastic leukaemia
antigen; EPCAM: epithelial cell adhesion molecule; DP: CALLA & EPCAM
double-positive; DN: CALLA & EPCAM double-negative; HG: high grade; LG:
low grade; ALDH: aldehyde dehydrogenase; TEM: transmission electron
microscopy; K14: cytokeratin-14; K18: cytokeratin-18; K19: cytokeratin-19.
Acknowledgements
The authors thank Cancer Research Ireland (CRI05HOP/AMH), the Irish
Research Council for Science, Engineering & Technology (EMBARK/SD),
Ministerio de Educación y Ciencia (IA), the Mater Foundation and the
Beaumont Hospital Cancer Research & Development Trust. The confocal
microscope was supported through the National Biophotonics and Imaging
Platform, Ireland, and funded by the Irish Government’s Programme for
Research in Third Level Institutions, Cycle 4, Ireland’s EU Structural Funds
Programmes 2007 - 2013.
Author details
1
Department of Surgery, Royal College of Surgeons in Ireland; Dublin,
Ireland.
2
Electron Microscopy, UCD Conway Institute, University College
Dublin, Ireland.
3
Flow Cytometry, UCD Conway Institute, University College
Dublin, Ireland.
4
Division of Gene Therapy and Hepatology, University of
Navarra, Bilbao, Spain.
5
UCD Mater Clinical Research Centre, Mater
Misericordiae University Hospital, Dublin, Ireland.
6
Pathology, Mater
Misericordiae University Hospital, Dublin, Ireland.
7
Surgery, Mater
Misericordiae University Hospital, Dublin, Ireland.
Non-tumourAggressive
tumours
DN DP
Normal/ Luminal-like
Basal-like
DN:DP
ratio
Proliferation :
senescence
ratio
Phenotype
CALLA EPCAMProlif. Senesc.
Figure 5 Progenitor imbalance model. A normal phenotype likely requires a fine balance between different progenitor populations (DP and
DN). In normal cells, a balance between proliferation and senescence interplays with a balance between these putative progenitor populations.
This promotes regulated generation of differentiated cells. In aggressive tumours, increased proliferation and decreased senescence influences
the equilibrium between different progenitor populations. This may alter the differentiated/undifferentiated cell balance, promoting basal-like
phenotypes associated with tumour progression.
Donatello et al. Journal of Experimental & Clinical Cancer Research 2011, 30:45
/>Page 9 of 10
Authors’ contributions
SD and AMH conceived and designed the study, analyzed and interpreted
the data, drafted the manuscript and revised it. SD performed most of the
experimental work, with assistance from LH (primary culture generation), IA
(senescence assay set-up), DCC (electron microscopy) and AB (cell sorting).
DCC, AB and ADKH contributed to the interpretation of the results. ADKH,
PAD, MJS, MS and MRK contributed to patient selection, sample acquisition
and clinical interpretation. All authors read and approved the final
manuscript.
Competing interests
The authors declare that they have no competing interests.
Received: 4 January 2011 Accepted: 26 April 2011
Published: 26 April 2011
References
1. Molyneux G, Geyer FC, Magnay FA, McCarthy A, Kendrick H, Natrajan R,
Mackay A, Grigoriadis A, Tutt A, Ashworth A, et al: BRCA1 basal-like breast
cancers originate from luminal epithelial progenitors and not from basal
stem cells. Cell Stem Cell 7:403-417.
2. Kakarala M, Wicha MS: Implications of the cancer stem-cell hypothesis for
breast cancer prevention and therapy. J Clin Oncol 2008, 26:2813-2820.
3. Stingl J, Eaves CJ, Kuusk U, Emerman JT: Phenotypic and functional
characterization in vitro of a multipotent epithelial cell present in the
normal adult human breast. Differentiation 1998, 63:201-213.
4. Clayton H, Titley I, Vivanco M: Growth and differentiation of progenitor/
stem cells derived from the human mammary gland. Exp Cell Res 2004,
297:444-460.
5. Ginestier C, Hur MH, Charafe-Jauffret E, Monville F, Dutcher J, Brown M,
Jacquemier J, Viens P, Kleer CG, Liu S, et al: ALDH1 is a marker of normal
and malignant human mammary stem cells and a predictor of poor
clinical outcome. Cell Stem Cell 2007, 1:555-567.
6. Smith GH, Chepko G: Mammary epithelial stem cells. Microsc Res Tech
2001, 52:190-203.
7. Pechoux C, Gudjonsson T, Ronnov-Jessen L, Bissell MJ, Petersen OW:
Human mammary luminal epithelial cells contain progenitors to
myoepithelial cells. Dev Biol 1999, 206:88-99.
8. Stampfer MR, Bartley JC: Human mammary epithelial cells in culture:
differentiation and transformation. Cancer Treat Res 1988, 40:1-24.
9. Dimri GP, Lee X, Basile G, Acosta M, Scott G, Roskelley C, Medrano EE,
Linskens M, Rubelj I, Pereira-Smith O, et al: A biomarker that identifies
senescent human cells in culture and in aging skin in vivo. Proc Natl
Acad Sci USA 1995, 92:9363-9367.
10. Hayat M: Principles and Techniques of Electron Microscopy. London:
Macmillan press; 1987.
11. Blanpain C, Fuchs E: p63: revving up epithelial stem-cell potential. Nat
Cell Biol 2007, 9:731-733.
12. Stingl J, Eaves CJ, Zandieh I, Emerman JT: Characterization of bipotent
mammary epithelial progenitor cells in normal adult human breast
tissue. Breast Cancer Res Treat 2001, 67:93-109.
13. Neumeister V, Agarwal S, Bordeaux J, Camp RL, Rimm DL: In situ
identification of putative cancer stem cells by multiplexing ALDH1,
CD44, and cytokeratin identifies breast cancer patients with poor
prognosis. Am J Pathol 176:2131-2138.
14. Stampfer M, Hallowes RC, Hackett AJ: Growth of normal human mammary
cells in culture. In Vitro 1980, 16
:415-425.
15. Krasna L, Dudorkinova D, Vedralova J, Vesely P, Pokorna E, Kudlackova I,
Chaloupkova A, Petruzelka L, Danes J, Matouskova E: Large expansion of
morphologically heterogeneous mammary epithelial cells, including the
luminal phenotype, from human breast tumours. Breast Cancer Res Treat
2002, 71:219-235.
16. Ethier SP, Mahacek ML, Gullick WJ, Frank TS, Weber BL: Differential
isolation of normal luminal mammary epithelial cells and breast cancer
cells from primary and metastatic sites using selective media. Cancer Res
1993, 53:627-635.
17. Brozova M, Kleibl Z, Netikova I, Sevcik J, Scholzova E, Brezinova J,
Chaloupkova A, Vesely P, Dundr P, Zadinova M, et al: Establishment,
growth and in vivo differentiation of a new clonal human cell line, EM-
G3, derived from breast cancer progenitors. Breast Cancer Res Treat 2007,
103:247-257.
18. Taylor-Papadimitriou J, Stampfer M, Bartek J, Lewis A, Boshell M, Lane EB,
Leigh IM: Keratin expression in human mammary epithelial cells cultured
from normal and malignant tissue: relation to in vivo phenotypes and
influence of medium. J Cell Sci 1989, 94(Pt 3):403-413.
19. van de Vijver MJ, He YD, van’t Veer LJ, Dai H, Hart AA, Voskuil DW,
Schreiber GJ, Peterse JL, Roberts C, Marton MJ, et al: A gene-expression
signature as a predictor of survival in breast cancer. N Engl J Med 2002,
347:1999-2009.
20. Gazdar AF, Kurvari V, Virmani A, Gollahon L, Sakaguchi M, Westerfield M,
Kodagoda D, Stasny V, Cunningham HT, Wistuba II, et al: Characterization
of paired tumor and non-tumor cell lines established from patients with
breast cancer. Int J Cancer 1998, 78:766-774.
21. Mani SA, Guo W, Liao MJ, Eaton EN, Ayyanan A, Zhou AY, Brooks M,
Reinhard F, Zhang CC, Shipitsin M, et al: The epithelial-mesenchymal
transition generates cells with properties of stem cells. Cell 2008,
133:704-715.
22. Bentires-Alj M, Clarke RB, Jonkers J, Smalley M, Stein T: It’s all in the details:
methods in breast development and cancer. Breast Cancer Res 2009,
11:305.
23. Moll R, Krepler R, Franke WW: Complex cytokeratin polypeptide patterns
observed in certain human carcinomas. Differentiation 1983, 23:256-269.
24. Zhou L, Jiang Y, Yan T, Di G, Shen Z, Shao Z, Lu J: The prognostic role of
cancer stem cells in breast cancer: a meta-analysis of published
literatures. Breast Cancer Res Treat 122:795-801.
25. Chang B, Liu G, Xue F, Rosen DG, Xiao L, Wang X, Liu J: ALDH1 expression
correlates with favorable prognosis in ovarian cancers. Mod Pathol 2009,
22:817-823.
26. Magnifico A, Albano L, Campaner S, Delia D, Castiglioni F, Gasparini P,
Sozzi G, Fontanella E, Menard S, Tagliabue E: Tumor-initiating cells of
HER2-positive carcinoma cell lines express the highest oncoprotein
levels and are sensitive to trastuzumab.
Clin Cancer Res 2009,
15:2010-2021.
27. Trost TM, Lausch EU, Fees SA, Schmitt S, Enklaar T, Reutzel D, Brixel LR,
Schmidtke P, Maringer M, Schiffer IB, et al: Premature senescence is a
primary fail-safe mechanism of ERBB2-driven tumorigenesis in breast
carcinoma cells. Cancer Res 2005, 65:840-849.
28. Menard S, Casalini P, Campiglio M, Pupa SM, Tagliabue E: Role of HER2/neu
in tumor progression and therapy. Cell Mol Life Sci 2004, 61:2965-2978.
doi:10.1186/1756-9966-30-45
Cite this article as: Donatello et al.: An imbalance in progenitor cell
populations reflects tumour progression in breast cancer primary
culture models. Journal of Experimental & Clinical Cancer Research 2011
30:45.
Submit your next manuscript to BioMed Central
and take full advantage of:
• Convenient online submission
• Thorough peer review
• No space constraints or color figure charges
• Immediate publication on acceptance
• Inclusion in PubMed, CAS, Scopus and Google Scholar
• Research which is freely available for redistribution
Submit your manuscript at
www.biomedcentral.com/submit
Donatello et al. Journal of Experimental & Clinical Cancer Research 2011, 30:45
/>Page 10 of 10