báo cáo khoa học: " The health disparities cancer collaborative: a case study of practice registry measurement in a quality improvement collaborative" pot
Bạn đang xem bản rút gọn của tài liệu. Xem và tải ngay bản đầy đủ của tài liệu tại đây (703.01 KB, 15 trang )
Implementation
Science
Haggstrom et al. Implementation Science 2010, 5:42
/>Open Access
RESEARCH ARTICLE
© 2010 Haggstrom et al; licensee BioMed Central Ltd. This is an Open Access article distributed under the terms of the Creative Com-
mons Attribution License ( which permits unrestricted use, distribution, and reproduc-
tion in any medium, provided the original work is properly cited.
Research article
The health disparities cancer collaborative: a case
study of practice registry measurement in a quality
improvement collaborative
David A Haggstrom*
1,2,3
, Steven B Clauser
4
and Stephen H Taplin
4
Abstract
Background: Practice registry measurement provides a foundation for quality improvement, but experiences in
practice are not widely reported. One setting where practice registry measurement has been implemented is the
Health Resources and Services Administration's Health Disparities Cancer Collaborative (HDCC).
Methods: Using practice registry data from 16 community health centers participating in the HDCC, we determined
the completeness of data for screening, follow-up, and treatment measures. We determined the size of the change in
cancer care processes that an aggregation of practices has adequate power to detect. We modeled different ways of
presenting before/after changes in cancer screening, including count and proportion data at both the individual
health center and aggregate collaborative level.
Results: All participating health centers reported data for cancer screening, but less than a third reported data
regarding timely follow-up. For individual cancers, the aggregate HDCC had adequate power to detect a 2 to 3%
change in cancer screening, but only had the power to detect a change of 40% or more in the initiation of treatment.
Almost every health center (98%) improved cancer screening based upon count data, while fewer (77%) improved
cancer screening based upon proportion data. The aggregate collaborative appeared to increase breast, cervical, and
colorectal cancer screening rates by 12%, 15%, and 4%, respectively (p < 0.001 for all before/after comparisons). In
subgroup analyses, significant changes were detectable among individual health centers less than one-half of the time
because of small numbers of events.
Conclusions: The aggregate HDCC registries had both adequate reporting rates and power to detect significant
changes in cancer screening, but not follow-up care. Different measures provided different answers about
improvements in cancer screening; more definitive evaluation would require validation of the registries. Limits to the
implementation and interpretation of practice registry measurement in the HDCC highlight challenges and
opportunities for local and aggregate quality improvement activities.
Background
Concerns about the quality of healthcare delivery have
increased in recent years, reflecting data that suggests a
lack of adherence to evidence-based practice [1,2]. Can-
cer care has not been immune to these concerns as
research has demonstrated gaps in quality throughout the
cancer care continuum [3]. In response, healthcare orga-
nizations have attempted to close these gaps by develop-
ing interventions for quality improvement. Some third-
party payers have developed indirect incentives for qual-
ity improvement by reimbursing providers using pay-for-
performance metrics [4], and pay-for-performance dem-
onstration programs sponsored by Medicare have
addressed cancer screening [5]. Fundamental to quality
improvement and pay-for-performance are valid mea-
sures of quality or performance, but small practices may
be limited by the small number of events relevant to any
single disease and the burden of data collection [6]. Little
has been reported about the implementation challenges
of measurement in smaller practice settings. The Health
Disparities Cancer Collaborative (HDCC) [7] provides an
* Correspondence:
1
VA Health Services Research & Development Center on Implementing
Evidence-based Practice, Roudebush VAMC, Indianapolis, IN, USA
Full list of author information is available at the end of the article
Haggstrom et al. Implementation Science 2010, 5:42
/>Page 2 of 15
example of quality improvement incorporating practice
registry measurement among community health centers.
The HDCC emphasizes plan/do/study/act (PDSA)
cycles [8] that identify deficiencies in quality, deliver
interventions, and measure the resulting change. Rapid
PDSA cycles leverage multiple, small practice-level inter-
ventions that are refined and increased in scale to
improve processes of care. The HDCC builds upon the
Breakthrough Series (BTS) collaborative model, in which
approximately 20 health centers are brought together in
an organized manner to share their experiences with
practice-level interventions, guided by practice-based
measurement. In this manuscript, we use the HDCC as a
case study for the implementation of practice registry
measurement in a multi-center quality improvement col-
laborative.
In the US, approximately one-half of physician organi-
zations have any disease registry; furthermore, one-half
of these registries are not linked to clinical data [9]. The
HDCC encouraged practice registries to track patient
populations eligible for cancer screening and follow up,
commonly independent of an electronic medical record.
Previous evaluations of collaborative activity have used
self-reported practice registry data [10], enhanced prac-
tice registry data [11], or bypassed practice registry data
in favor of chart audit [12].
However, direct knowledge from practice about the
implementation of practice registries, and interpretation
of the data collected, is rare in the medical literature
[6,13]. This paper addresses several key measurement
issues worth consideration by stakeholders participating
in any quality improvement intervention: How complete
are the data across health centers over time? For what
types of care processes is it feasible to detect changes in
care? And what answers do different approaches to pre-
senting practice change provide? The answers to these
questions provide insights into explanations for data
reporting patterns, as well as how practice registry mea-
surement can be interpreted at different levels. This
information may guide quality improvement for cancer
screening and follow up, and assist local and national
decision-makers in using practice registry data collected
for other clinical practices or problems.
Methods
Setting
Sixteen community health centers, supported by the
Health Resources and Services Administration (HRSA),
participated in the HDCC. HRSA directs its resources
toward financially, functionally, and culturally vulnerable
populations [14]. Basic characteristics of the 16 health
centers participating in the HDCC are described in Table
1. The collaborative activities were led and supported by
HRSA, the Centers for Disease Control and Prevention,
and the National Cancer Institute (NCI).
Collaborative intervention
From 2003 to 2004, the HRSA HDCC administered the
BTS, a collaborative model [15] developed by the Insti-
tute for Healthcare Improvement (IHI) [16]. The HDCC
adapted elements from the 'chronic care model' to
improve the quality of cancer screening and follow up.
The chronic care model is defined by six elements:
healthcare organization, community linkages, self-man-
agement support, decision support, delivery system rede-
sign, and clinical information systems [17]. The HDCC's
learning model involved three national, in-person ses-
sions and the expectation that local teams would be orga-
nized at health centers to pursue PDSA cycles relevant to
cancer screening. The 16 centers were selected through
an active process that involved telephone interviews with
health center leaders to assess their enthusiasm and will-
Table 1: Health center characteristics
Patients eligible for screening at health
center level*
Mean (range)
Breast 849 (86 to 3305)
Cervical 1,556 (131 to 5,195)
Colorectal 549 (82 to 3466)
Number of months reporting any registry
data*
17 (12 to 18)
Number of providers (physicians, nurse
practitioners, physician assistants)**
52 (7 to 205)
Number of nurses (registered nurses,
licensed practical nurses)**
34 (1 to 103)
Region of health centers*** Number
(proportion)
Northeast 3 (19%)
Midwest 4 (25%)
South 7 (44%)
West 2 (13%)
*obtained from practice registry software
**obtained from survey of health center financial officers
***per U.S. census region categories
Haggstrom et al. Implementation Science 2010, 5:42
/>Page 3 of 15
ingness to commit the resources necessary for success.
The local teams consisted of employees with multiple
backgrounds and roles, including providers (physicians,
physician assistants, and nurse practitioners), nurses,
appointment staff, and laboratory and information sys-
tems personnel. The effort and staff time allocated aver-
aged four full-time equivalent (FTE) per team with an
aggregate of 950 hours per team. Participating health
centers reported performance measures to each other
and central facilitators, and talked by teleconference
monthly.
Performance measures
HDCC measures of screening and follow up for breast,
cervical, and colorectal cancer were collected over 15
months in the collaborative (See Additional File 1 for full
description of the performance measures). These mea-
sures assessed four critical steps in the cancer care pro-
cess: the proportion of eligible patients screened, the
proportion screened receiving notification of results in a
timely manner, the proportion of abnormal results evalu-
ated in a timely manner, and the proportion of cancer
cases treated in a timely manner [18]. Screening mea-
sures were based upon United States Preventive Services
Task Force (USPSTF) guidelines and finalized through a
process of discussion and group consensus among collab-
orating health centers. These performance measures
were similar to the cancer screening measures developed
by the National Committee for Quality Assurance
(NCQA) [19] and the Physician Consortium for Perfor-
mance Improvement, sponsored by the American Medi-
cal Association (AMA) [20]. In contrast to other
measurement systems, the HDCC did not exclude age-
appropriate individuals due to medical reasons or patient
refusal (as was done by the Physician Consortium for Per-
formance Improvement). Conversely, other systems did
not incorporate timely follow-up (notification, evalua-
tion, or treatment) as part of their indicator sets.
Practice registry data collection
Health centers reported the size of the patient population
who were eligible for screening and follow up and
received screening and follow up every month from Sep-
tember 2003 through November 2004. Information was
reported to HDCC facilitators from HRSA, NCI, and IHI.
We obtained Institutional Review Board approval, as well
as written consent from each participating health center,
to use the self-reported practice registry data.
Community health centers each created a practice reg-
istry of individuals eligible for screening or follow up
among patients who had been seen in the health center at
least one time in the past three years. All health centers
participating in the HDCC used the practice registry data
software provided by the HDCC; nationwide, HRSA
community health centers were encouraged, but not
mandated, to use the software. Data entry varied from the
wholesale transfer of demographic information from bill-
ing data queried for age-appropriate groups to hand
entry.
In 2000, HRSA supported the development and deploy-
ment of electronic registry software. Over the next five
years, HRSA continued to support numerous iterations of
the registry software to address both the increasing scope
of the collaboratives (such as cancer screening) and the
needs of clinicians and other frontline-staff users.
Informing this process was an advisory group of health
center clinicians and technical experts that provided
insight and guidance about critical registry functional-
ities and the needs of measurement to effectively support
practice management. Training in the software was pro-
vided by HRSA at a national level, as an adjunct to collab-
orative learning sessions, and at the regional and local
level by the Information System Specialist (ISS). The
training typically consisted of four- to eight-hour interac-
tive sessions in which participants would have a 'live'
experience on laptops.
The registry software assembled individual patients
seen at the health center into an aggregate population to
share with other HDCC sites. The data were posted on a
secure data repository to be shared with HDCC facilita-
tors and benchmarked against other health centers. A
data manager from the medical records department at
each center who had training in use of the registry
uploaded the data.
The process of entering patients into the practice regis-
try fell into two general categories: a process whereby
patients seen at the center in the previous month were
entered into the practice registry as they were seen, and a
process whereby patients who had been seen at the center
before the previous month were entered into the practice
registry based on the criterion of being seen at least once
in the past three years. The number of patients described
as eligible in any given month represented the number of
patients that the health center had so far been able to
enter into the practice registry. Eligible patients in the
practice registry were then searched on the last work day
of each month to identify who had received screening or
follow up within an appropriate timeframe. The number
of patients who were up-to-date with screening or follow
up was reported and shared among collaborative partici-
pants on a monthly basis; no shared information was
identifiable at the patient level.
Analyses
We anticipated a start-up period of about three months
when the practice registry would be in the process of
being implemented at the health centers. To test this
assumption, we determined the completeness of monthly
Haggstrom et al. Implementation Science 2010, 5:42
/>Page 4 of 15
registry data reported by each health center over the first
three months (September 2003 through November 2003)
and the last 12 months (December 2003 through Novem-
ber 2004). Within each interval, we determined the pro-
portion of months when data were not reported from
each health center (center-months). Preliminary analyses
confirmed our initial assumptions: during the first three
months of the collaborative, 12.5% of the months over
which reporting was possible were absent for screening
mammography. For screening Pap test, 10.4% of months
were absent; and for colorectal cancer screening, 16.7%
were absent. This level of missing data was more than
twice as high as was observed during the last 12 months
of data reporting (see Results); and consequently, we
chose to focus subsequent analyses on the last 12 months
of the collaborative. Analyses were performed across 16
health centers over 12 months, thus, data reporting was
possible for a total of 192 center-months.
We conducted three primary analyses:
1. To determine the completeness of practice registry
data for screening and follow up across health centers
over time, we described the proportion of health centers
who reported or had data available for at least two points
in time (months) for each cancer care process (Table 2).
2. To determine for which cancer care processes it
would be feasible to detect differences in the proportion
of patients who received care, we calculated the detect-
able change statistic for each process (Table 3). For exam-
ple, if 20% of patients received screening, we determined
what additional proportion of patients would have to
receive screening, given the same sample size, to be sig-
nificantly different from 20%. For the two-sided tests, our
assumptions were that the threshold for detecting differ-
ences was 5% (alpha = 0.05) and the power was 80% (beta
= 20%). These calculations were performed using the
power procedure from SAS 9.1 [21]. Based upon power
and completeness, we chose to focus subsequent analyses
on only cancer screening, not timely follow-up or treat-
ment.
3. To describe and test practice change in the health
centers, we used two main approaches: for the aggregate
collaborative, we performed a chi-squared test compar-
ing the proportion of individuals screened at the begin-
ning and end of the collaborative evaluation period; and
for each individual health center, we conducted the same
before/after comparison and then determined the pro-
portion of individual chi-squared tests that were signifi-
cant among all health centers.
4. To generate trend figures for individual health cen-
ters, we charted the number and proportion of individu-
als who were screened as well as the number eligible
for breast, cervical, and colorectal cancer at the beginning
(December 2003) and end (November 2004) of the collab-
orative evaluation period. The three screening tests had
nine potential combinations or patterns of change
among the number of individuals screened, the number
of individuals eligible, and the proportion of individuals
screened.
Results
Practice registry data reporting patterns
During the 12-month period under evaluation, self-
reported practice registry data were available from 16
community health centers for screening mammography
in 95%, or 182/192 of the center-months over which
reporting was possible. For screening Pap test, data were
available for 95% of the center-months, and for colorectal
cancer screening, data were available for 94% of the cen-
ter-months.
All participating health centers reported practice regis-
try data regarding cancer screening (Table 2). The pro-
portion of health centers who reported practice registry
data for other care processes were the following across
different cancers: documented notification of screening
test results (37 to 63%); evaluation of abnormal screening
test results (12 to 32%); and delivery of treatment within
an adequate time frame after cancer diagnosis (6 to 13%).
Detectable change
The HDCC as a whole had large enough numbers of
women and men eligible for screening mammography,
screening Pap test, and colorectal cancer screening to
detect a change of 2% to 3% in cancer screening (Table 3).
Likewise, the numbers of individuals who received breast,
cervical, and colorectal cancer screening tests were large
enough to detect a 3% to 6% change in the documented
notification of each screening test result within 30 days.
The numbers eligible were such that only a 15% to 24%
change could be detected in the additional evaluation of
abnormal screening test results, and only a change of 40%
or more could be detected in the delivery of treatment
within an adequate time frame after cancer diagnosis.
Different approaches to presenting practice change
Individual versus aggregate level
For the aggregate HDCC, the proportion screened at the
beginning and end of the evaluation period increased for
breast, cervical, and colorectal cancer by 12%, 15%, and
4%, respectively (p < 0.001 for all comparisons, Table 4).
For individual health centers, the before/after chi-
squared test of proportions demonstrated a statistically
significant change in screening among less than one-half
of health centers (Table 4).
Counts versus proportions
Across breast, cervical, and colorectal cancer, almost all
health centers had an increase in the number screened
(98%, 47/48). The denominator here (48) is composed of
each screening test (three tests) measured at each health
Haggstrom et al. Implementation Science 2010, 5:42
/>Page 5 of 15
center (16 centers). Most health centers (88%, 42/48) also
had an increase in the number eligible for cancer screen-
ing. Fewer health centers (77%, 37/48) had an increase in
the proportion of individuals screened.
Among health centers participating in the collabora-
tive, three different combinations or patterns of change-
-emerged across the following measures: the number of
individuals screened, the number of individuals eligible,
and the proportion of individuals screened. Table 5 pro-
vides complete data across the sixteen reporting health
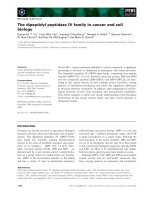
centers. The three patterns (described in Figures 1, 2 and
3 using representative breast cancer screening examples
from an individual health center) were as follows: the
majority of the time (65%, or 31/48), the number
screened, the number eligible, and the proportion
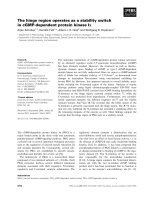
screened all increased (Figure 1); occasionally (23%, 11/
48), both the number screened and number eligible
increased, while the proportion screened decreased (Fig-
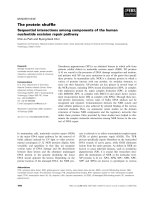
ure 2); and less often (13%, 6/48), the number screened
increased, while the number eligible decreased. Logically,
Table 2: Health centers reporting practice registry data in ≥ two months for each cancer care process
Number of health
centers reporting
Percentage of health centers reporting
Cancer Screening
Women with mammogram in last two years (age ≥42 years) 16 100.0%
Women with pap test within last three years (age ≥21) 16 100.0%
Adults appropriately screened for colorectal cancer (age ≥51) 16 100.0%
Breast cancer follow-up and treatment
Women notified of mammogram results within 30 days 8 50.0%
Women with follow-up evaluation of abnormal mammogram
completed within 60 days
2 12.5%
Women with breast cancer starting treatment within 90 days 1 6.25%
Cervical cancer follow-up and treatment
Women notified of Pap test results within 30 days 10 62.5%
Women requiring colposcopy completing evaluation within
90 days
3 18.75%
Women with CIN 2,3 starting treatment within 90 days 2 12.5%
Colorectal cancer follow-up and treatment
Adults notified of colorectal cancer screening results within
30 days
6 37.5%
Adults with follow-up evaluation of positive FOBT within 8
weeks
5 31.25%
Adults with colon polyps or cancer starting treatment within
90 days
2 12.5%
Haggstrom et al. Implementation Science 2010, 5:42
/>Page 6 of 15
the proportion screened increased in each instance (Fig-
ure 3). At the individual health center level, patterns of
change tended to track together across the three types of
screening. At two centers, the second pattern of change
(Figure 2) occurred across breast, cervical, and colorectal
cancer screening, and at another center, across breast and
cervical cancer screening. At two centers, the third pat-
tern of change (Figure 3) occurred across both breast and
cervical cancer screening.
Discussion
There were challenges in this evaluation that raise issues
relevant to measuring and improving practice. The chal-
lenge of collaborative measurement begins with the ques-
tion of the completeness of the practice registry data and
Table 3: Populations receiving and eligible for cancer care processes at beginning of evaluation period for aggregate collaborative
Cancer care process Eligible population Process received Eligible Detectable change*
Cancer screening
Mammography Women age ≥42 2,373 10,522 2%
Pap test Women age ≥21 8,446 20,114 2%
Colorectal cancer screening Adults age ≥51 1,855 7,760 3%
Breast cancer follow-up and treatment
Documented notification of mammogram
results within 30 days
Women receiving mammogram 674 2,373 6%
Additional evaluation within 60 days of
abnormal mammogram
Women with abnormal mammogram 30 125 24%
Initial treatment within 90 days of diagnosis Women diagnosed with breast cancer 2 31 44%
Cervical cancer follow-up and treatment
Documented notification of Pap test results
within 30 days
Women receiving Pap test 2,325 8,446 3%
Colposcopy evaluation within three months
of abnormal Pap test
Women requiring colposcopy based on
Pap test
73 292 15%
Initial treatment within 90 days of diagnosis Women diagnosed with CIN2,3 8 34 47%
Colorectal cancer follow-up and treatment
Documented notification of colorectal cancer
screening results within 30 days
Adults receiving colorectal screening 575 1,855 6%
Colonoscopy (or sigmoidoscopy and BE)
within eight weeks of positive testing
Adults with abnormal FOBT 29 123 24%
Initial treatment within 90 days of diagnosis Adults diagnosed with colon polyps or
cancer
133 40%
*80% power to detect this amount of change at significance level of 0.05 (two-sided)
Haggstrom et al. Implementation Science 2010, 5:42
/>Page 7 of 15
Table 4: Before/after comparisons at aggregate collaborative and individual health center level
Cancer screening
Women with mammogram in
last two years (age ≥42 years)
Women with pap test within last
three years (age ≥21)
Adults appropriately screened for
colorectal cancer (age ≥51)
Aggregate collaborative Before numerator 2,373 8,446 1,855
Before denominator 10,522 20,114 7,760
After numerator 4,508 13,898 3,307
After denominator 13,003 24,300 11,968
Before proportions 23% 42% 24%
After proportions 35% 57% 28%
Before/after chi-squared test p < 0.001 p < 0.001 p < 0.001
Individual health centers (out of 16
possible health centers)
Increase in before/after counts 15/16 (94%) 16/16 (100%) 16/16 (100%)
Increase in before/after
proportions
12/16 (75%) 11/16 (69%) 14/16 (88%)
Before/after chi-squared test
significant
7/16 (44%) 6/16 (38%) 5/16 (31%)
Haggstrom et al. Implementation Science 2010, 5:42
/>Page 8 of 15
how they were collected, as well as the nature of the per-
formance measures and the populations involved. In the
HDCC, both practice registry data completeness and the
feasibility of detecting change varied by cancer care pro-
cess. For cancer screening, every health center reported
data, and data were reported for most months. Further-
more, enough individuals were eligible for cancer screen-
ing so that relatively small improvements were detectable.
On the other hand, because additional evaluation of
abnormal tests or timely initiation of treatment were
reported infrequently, only relatively large changes were
detectable.
Practice registry data from HDCC community health
centers can be interpreted and guide action on at least
two levels: the individual health center and the aggregate
collaborative. Aggregate measures suggested improve-
ment in the HDCC as a whole across all cancer screening
processes (breast, cervical, and colorectal); however, indi-
vidual health center screening measures captured
improvement among a minority of health centers. Indi-
vidual health centers acting alone may not have adequate
Table 5: Changes from baseline to final measurement in the number of individuals screened, the number eligible, and the proportion
screened across cancer screening tests
Mammography screening Pap test screening Colorectal cancer screening
Screened/Eligible/Proportion Screened/Eligible/Proportion Screened/Eligible/Proportion
CHC 1 13/-1/15.6 16/-9/14.9 20/3/16.6
CHC 2 37/72/28.9 69/113/-9.8 31/66/30.7*
CHC 3 105/226/-18.5 135/323/-25.6* 46/224/-11.8
CHC 4 513/347/24.2* 807/996/3.9 298/214/19.3*
CHC 5 78/258/6.2 746/817/57.0* 58/158/20.4*
CHC 6 110/160/27.7* 427/444/37.5* 28/135/3.9
CHC 7 60/-84/4.3* 1133/710/23.9* 290/58/16.7*
CHC 8 205/252/14.1 296/341/12.0 140/153/7.9
CHC 9 351/730/-3.9 972/1379/-3.9 299/536/-7.7
CHC 10 69/114/10.0 125/153/23.0 34/109/2.8
CHC 11 400/-497/12.5* 759/-2552/24.8* 151/1747/2.6*
CHC 12 215/328/8.7* 220/453/5.2 86/416/0.1
CHC 13 6/51/-2.1 41/90/0.5 51/74/0.9
CHC 14 133/166/14.5* 270/404/7.9 86/146/6.3
CHC 15 27/184/2.0 10/219/-1.5 29/146/3.3
CHC 16 1/251/-18.4* 183/422/-4.7 6/-21/2.8
CHC: community health center; bold italics indicate a decrease in the number or proportion of individuals screened or eligible
*p < 0.05
Haggstrom et al. Implementation Science 2010, 5:42
/>Page 9 of 15
statistical power for traditional research purposes, but
nonetheless, collecting their own practice registry data
can enable practice directors, providers, and staff to func-
tion as learning organizations [22] to understand their
own data, as well as share their local understanding with
other health centers participating in the same type of
quality improvement activities. At the aggregate level,
practice registry data shared among multiple health cen-
ters may inform other large collaborative or quality
improvement efforts, as well as policymakers, akin to a
multi-site clinical trial.
Explanations for practice registry data reporting patterns
As the HDCC progressed to healthcare processes more
distal to the initial screening event, the number of health
centers reporting practice registry data decreased, and
the size of the detectable change increased. In the HDCC,
reporting practice registry data on the follow up of abnor-
mal results and treatment of cancer was voluntary. Both
the small number of events reported, and centers that
reported them, commonly made it infeasible to test for
statistically significant changes in follow up or treatment,
even over the entire collaborative. The small number of
abnormal screening results reported and the even
smaller number of cancer diagnoses have at least three
primary explanations: the frequency of these care pro-
cesses or events was indeed small; the medical informa-
tion was available in a local medical record but the health
centers did not report these events in automated form to
the HDCC program, even when they did occur; and
health centers did not have routine access to the medical
information necessary to report the measures because
the care occurs outside their practice.
Frequency of different care processes
At any single health center, it is possible that no cancers
were detected during the period of time under evaluation
(about 3 in 1,000 screening mammograms detect a breast
cancer [23]), but it seems very unlikely that any given
health center would not have any abnormal results to
report (approximately 1 in 10 screening mammograms
are abnormal [24]). Because all health centers were not
reporting all data describing each cancer care process,
selection bias clearly threatens the validity of general
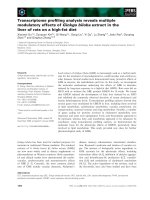
Figure 1 Individual health center wherein number of individuals screened for breast cancer increased, number eligible increased, and pro-
portion screened increased.
0
50
100
150
200
250
300
350
400
Dec-03 Jan-04 Feb-04 Mar-04 Apr-04 May-04 Jun-04 Jul-04 Aug-04 Sep-04 Oct-04 Nov-04
Number of individuals
0.0
5.0
10.0
15.0
20.0
25.0
30.0
35.0
40.0
45.0
50.0
Proportion of individuals
Number screened
Number eligible
Proportion screened
Haggstrom et al. Implementation Science 2010, 5:42
/>Page 10 of 15
inferences drawn from the data collected in the overall
collaborative.
Why information may be available locally, but not reported
to the HDCC
As demonstrated by example in the case of the HDCC, a
larger number of eligible patients allows more precise
measurement of practice performance [6]. A primary
care population usually has enough individuals eligible
for cancer screening so that multiple health centers
joined together by a collaborative have sufficient power
to detect small changes in screening. Of the screening fol-
low-up steps reviewed, the highest percentage of health
centers reported timely notification of Pap test results
(62.5%), most likely because these services were per-
formed onsite at the health centers. Yet overall, the same
level of precision and power possible for screening was
not possible for the measures and comparisons of diag-
nostic follow-up or treatment events. Therefore, health
centers in the HDCC may have felt less accountable for
reporting care processes that occurred infrequently
knowing the limitations of measuring these clinical pro-
cesses [25].
Health centers may have had concerns about how mis-
ascertainment of only a few cases could potentially make
their overall performance appear much worse. Concerns
about negative perceptions have allegedly driven report-
ing behavior in other settings. For example, health main-
tenance organizations were more likely to withdraw from
voluntary Healthcare Effectiveness Data and Information
Set (HEDIS) measure disclosure when their quality per-
formance was low [26]. Reinforced by concerns about the
potential negative perceptions of their employees or
other health centers, participating health centers may
have chosen not to invest their limited time and resources
into reporting voluntary measures with few events.
Why health centers may not have access to the data
necessary to report the measures
The limited ability of the HDCC to detect changes in
additional evaluation or treatment also was a function of
the clinical setting in which HDCC measurement took
place community health centers delivering primary care.
Compared to the number of abnormal tests identified in a
primary care practice, more abnormal tests will be found
in procedural settings (e.g., mammography centers and
Figure 2 Individual health center wherein number of individuals screened for breast cancer increased, number eligible increased, and pro-
portion screened decreased.
0
50
100
150
200
250
300
350
400
Dec-03 Jan-04 Feb-04 Mar-04 Apr-04 May-04 Jun-04 Jul-04 Aug-04 Sep-04 Oct-04 Nov-04
Number of individuals
0.0
10.0
20.0
30.0
40.0
50.0
60.0
70.0
80.0
90.0
Proportion of individuals
Number screened
Eligible
Proportion screened
Haggstrom et al. Implementation Science 2010, 5:42
/>Page 11 of 15
gastroenterology practices) where these tests are per-
formed across multiple, referring primary care practices.
Similarly, more cancer diagnoses will be found where
cancer patients are treated (e.g., oncology and surgery
practices) from multiple, referring practices.
On a practical level, primary care health centers may
simply not have routine access to the medical record data
necessary to report information related to diagnostic fol-
low-up and treatment. There was no uniform workflow
for data from institutions outside the HDCC, and we sus-
pect that the lack of access to data outside the primary
care practices contributes most to the small number of
abnormal screening results and cancer diagnoses
reported. Health policy experts have emphasized that
single-practice data systems are insufficient for effective
care coordination across practices [27]. For example, the
extremely low rate of timely treatment after cancer diag-
noses among reporting health centers (3 to 24%) very
likely represented the lack of a systematic way to collect
feedback from oncology practices rather than quality
gaps; data across practices is very difficult to locate out-
side the context of integrated data and delivery systems.
Health centers appeared to report what little information
was available regarding follow-up and treatment and shift
their focus to cancer screening. In the subsequent HDCC
regional collaborative, substantial emphasis was placed
upon building communities of practice to help address
the lack of coordination between primary care and sub-
specialty practices [28]. Community health centers may
perceive it as unfair to hold primary care practices
accountable for whether or not their referral was evalu-
ated or treated in a timely fashion given that the clinical
delivery (and financial benefit) of these services falls
within the scope of other practices in the healthcare sys-
tem. In the HDCC, this perception may have further con-
tributed to non-reporting of such distal events, even
though on a system level, appropriate and timely follow-
up is essential for a successful cancer screening program.
In assigning accountability for performance, one gen-
eral approach is that any individual provider is held
accountable for those activities directly under his/her
control. This approach is taken in measurement systems
supported by the AMA's Physician Consortium for Per-
formance Improvement for physician office practices. An
alternative approach to assigning accountability would be
the integration of performance measurement across mul-
Figure 3 Individual health center wherein number of individuals screened for breast cancer increased, number eligible decreased, and
proportion screened increased.
0
500
1000
1500
2000
2500
3000
3500
4000
Dec-03 Jan-04 Feb-04 Mar-04 Apr-04 May-04 Jun-04 Jul-04 Aug-04 Sep-04 Oct-04 Nov-04
Number of individuals
0.0
2.0
4.0
6.0
8.0
10.0
12.0
14.0
16.0
Proportion of individuals
Number screened
Number eligible
Proportion screened
Haggstrom et al. Implementation Science 2010, 5:42
/>Page 12 of 15
tiple healthcare settings to capture services across the full
continuum of cancer care. Here the accountability is
placed upon the healthcare system or a network of phy-
sicians as opposed to individual providers. Building
upon our HDCC experience, policymakers may want to
consider new methods to identify and reward the team of
providers responsible for the care of patients with com-
plex medical conditions [29,30], including cancer. Policy-
makers may also want to consider our findings as
reinforcing evidence of the need for patient-centered
medical homes [31], if they make additional resources
available for coordinating care with other providers and
using data systems to track referrals and results.
Practice registry data interpretation
Individual level
Over the course of the collaborative, health centers con-
sistently increased the absolute number of individuals
screened, yet on occasion, both the number of individuals
eligible for screening and the proportion screened
declined. Figures 1, 2 and 3 provide examples of the three
patterns observed at the health center level during the
course of the HDCC. The interpretation of these various
patterns may be helpful to both collaborative group lead-
ers and individual practices trying to understand their
own data.
Two main interpretations are possible when the num-
ber screened increases. Either more screening is occur-
ring at the health center, or the same amount of screening
is occurring at the health center but more complete mea-
surement of screening is occurring. Two parallel interpre-
tations exist when the number eligible for screening
changes. Either the eligible population is changing, or the
eligible population is stable but a different proportion of
the eligible population is being identified or measured.
Informal observations gathered from individuals
involved with the self-report of practice registry data pro-
vide some insight into likely explanations for these pat-
terns. HDCC participants suggested that health centers
struggled to establish a reliable denominator population
eligible for screening. The early, sharp drop in the num-
ber eligible in Figure 3 is likely attributable to the estab-
lishment of a more reliable denominator population in
the first several months of the HDCC, rather than a sud-
den drop in the eligible population. Similarly, the sharp
rise and drop in the number eligible midway through the
HDCC in Figure 2 likely represents a mid-course correc-
tion in how the eligible, denominator population was
ascertained. Finally, the late, rapid increase in the eligible
population in Figure 2 likely represents the inclusion of a
bolus of patients by new automated data collection, as
opposed to rapid growth in the eligible population served
by the health center.
The observation that unique patterns of change tracked
across different cancer screening tests at the same center
further suggests that explanations related to data collec-
tion and entry most likely drive these patterns. Using reg-
istries to track screening is a new organizational process
for many practices [9]. These centers received training,
but training does not replace actual practice experience
in allowing organizations to become proficient. Practices
are likely to encounter problems at first, and thus, there
may be considerable imprecision in the first year of data.
When the danger of an unreliable eligible population
denominator exists, tracking the numerator (number
screened) may be the best way to chart progress, pro-
vided the numerator itself is reliable. Challenges in estab-
lishing the denominator population are not unique to the
HDCC, and, in fact, the HDCC likely represented a best-
case scenario of particularly motivated health centers
with special attention from national organizations. A
minority of clinical practices has any disease registry to
provide guidance in managing the care of their patients
[9]. Furthermore, cancer screening typically involves
many more patients than any other specific disease (for
example, diabetes) because screening takes place among
healthy populations defined largely by age thresholds.
Ultimately, a paradigm shift to population-based infor-
mation systems and healthcare delivery may be necessary
to track and manage the delivery of clinical preventive or
screening services.
The experience of the HDCC suggests that the data
entry burden for large screening populations poses signif-
icant challenges for primary care practices [6], as well as
regional or national policymakers interested in organiz-
ing such practices in larger quality improvement efforts.
Formal assessment of the burden of data entry and track-
ing activities upon health center personnel would inform
estimates of the cost of other collaboratives targeting
large populations. Sudden trend shifts trigger questions
about the quality of the practice registry data when they
occur. Although some centers performed automated data
transfers from billing systems to registries, this process
required advanced data management capabilities that
were not always available [32,33]. Complete registries will
be difficult to implement until community health centers
are equipped with a full electronic medical record system,
accompanied by functionalities designed to manage the
health of populations.
The nature and intensity of practice registry measure-
ment may appropriately change for different purposes.
For example, quality improvement programs like the
HDCC need to focus most upon threats to internal valid-
ity when performing before/after assessment within a
single, or collective group, of health centers. On the other
hand, pay-for-performance activities typically reward
practices differentially based upon their improvement
Haggstrom et al. Implementation Science 2010, 5:42
/>Page 13 of 15
relative to another practice or shared benchmark [4]. In
the case of pay-for-performance, cross-organization
comparisons need to thoroughly address barriers to
external validity.
Aggregate level
The HDCC had an adequate number of targeted individ-
uals to detect a statistically significant change for each
screening test. Yet at the individual health center level,
statistically significant changes were observed less than
one-half of the time for each cancer screening test, in part
due to limited power. The contrast between findings at
the individual and aggregate level illustrate one of the
strengths of the collaborative model its potential to
demonstrate the collective effectiveness of shared quality
improvement efforts that organize individual health cen-
ters together. The limitation of combined health center
data is the difficulty in specifying where to target inter-
ventions based upon aggregate statistics alone. Depend-
ing upon stakeholder needs, different methods may be
considered for different levels of assessment. Less strin-
gent statistical trends may help to more narrowly target
quality improvement resources to the individual health
centers struggling in a joint effort. Analytic methods from
healthcare systems redesign, such as statistical process
control, may be applied to better understand patterns for
clinical processes with a small number of observations
[34].
Based upon practice registry data, the aggregate collab-
orative increased screening for breast, cervical, and col-
orectal cancer. Evidence from other Health Disparities
Collaborative programs also suggests positive changes in
processes of care [7]. However, twelve months was likely
insufficient to distinguish between improvement in clini-
cal performance and improvement in data collection sys-
tems. In quality improvement intervention trials, longer
follow-up periods are commonly advocated for the sake
of better ascertaining sustained improvement [12,35]. In
the setting of clinical practices adopting quality improve-
ment goals that track new types of data, longer follow-up
periods may also be needed to allow time for the develop-
ment of new information systems and accompanying
workflow processes.
The process of entering patient data into the registry
also has potential for selection bias because more active
patients (seen in one of the months of collaborative oper-
ation) would be more likely to be entered into the registry
than patients who had not been seen for some time. The
more active patients would also be more likely to have
screening and follow up because those were issues cov-
ered in the collaborative sessions. There is a reasonable
expectation that the relatively inclusive sampling
approach to the HDCC's eligible denominator population
(seen once in the past three years) underestimates the
screening performance, compared to less inclusive sam-
pling approaches to the eligible screening population (for
example, if patients were included only if they had been
seen in the past year) [36]. Practically speaking, even
though the eligible denominator population was stan-
dardized and health centers were encouraged to enter
that denominator at the beginning of the collaborative,
the burden of data entry was considerable, and not all
health centers likely could establish the full eligible popu-
lation by day one of measurement. Thus, centers may
have initially been including eligible individuals seen in
only the past few months or year. With a less inclusive
sampling approach of this type, these centers likely over-
estimated screening performance. Yet because assess-
ment in the collaborative was primarily done for internal
quality improvement, not external reporting purposes, a
more inclusive definition of the eligible population was
desirable because it can afford centers the opportunity to
identify patient populations that might benefit from more
intensive outreach [36].
Overall, in this current evaluation of the HDCC pro-
gram, the validity of the aggregate findings regarding can-
cer screening is uncertain. Heterogeneous methods of
practice registry data collection across a heterogeneous
group of health centers (different sizes and approaches to
data entry) limit the confidence with which the pooled
data can be interpreted and compared to outside organi-
zations. Before external audiences use this type of data as
an evaluation tool of an overall collaborative's perfor-
mance, standardization in the training and experience
with the registry is necessary, as well as critical thought
about how to consider the various types of heterogeneity
across organizations. Again, the HDCC was focused
upon quality improvement among participating health
centers not a comparison with other organizations
thus reproducibility and internal validity within partici-
pating health centers was the greater priority. Yet, even if
internal validity were adequate, our knowledge of tempo-
ral trends is limited in a before/after evaluation design
with no outside control group. Overall, the findings here
do not represent a definitive evaluation of the HDCC.
Future collaborative evaluations will benefit greatly from
the validation of practice registry data against a 'gold
standard', such as paper or electronic medical records, as
well as the addition of a control group. Such future evalu-
ations may be expensive, but of course, so are unproven
large-scale interventions [37,38].
Summary
By sharing our unvarnished experience with the HDCC,
we have contributed operational knowledge about the
implementation and interpretation of practice registries
from a quality improvement collaborative. Quality
improvement efforts do not routinely perform data vali-
Haggstrom et al. Implementation Science 2010, 5:42
/>Page 14 of 15
dation, although strategic data quality checks would be
worthwhile. We have discussed several evaluation design
issues, including power, selection bias, and level of analy-
sis. Data collected in the course of quality improvement
are commonly imperfect due to their 'real-world' nature;
nonetheless, when quantitative measures are used to
draw conclusions or support changes in practice, princi-
ples of measurement still apply. These principles can pro-
vide insight into the limits and potential for the use of
practice registry data by stakeholders at both the practice
and policy level.
Additional material
Competing interests
The authors declare that they have no competing interests.
Authors' contributions
DH performed the statistical analyses. DH, SC, and ST interpreted the data and
drafted the manuscript. ST and DH conceived of the study and participated in
its design and execution. All authors read and approved the final manuscript.
This work represents the opinion of the authors and cannot be construed to
represent the opinion of the U.S. Federal Government.
Acknowledgements
Dr. Haggstrom is the recipient of VA Award CD207016-2 and a VA/Robert Wood
Johnson Foundation Physician Faculty Scholar. Jason Sutherland, Ph.D., Indiana
University, Department of Medicine, Division of Biostatistics, contributed to the
statistical power analyses. Anne Rodgers, a scientific writer, reviewed and pro-
posed suggestions to a draft of the paper with the support of the Outcomes
Research Branch, National Cancer Institute. Ahmed Calvo, MD, MPH, FAAFP,
Director & CMO for the HRSA Health Disparities Collaboratives, has contributed
his considerable insight and support throughout the evaluation process.
Author Details
1
VA Health Services Research & Development Center on Implementing
Evidence-based Practice, Roudebush VAMC, Indianapolis, IN, USA,
2
Division of
General Internal Medicine and Geriatrics, Department of Medicine, IU School of
Medicine, Indianapolis, IN, USA,
3
Indiana University (IU) Center for Health
Services and Outcomes Research, Regenstrief Institute, Inc., Indianapolis, IN,
USA and
4
Division of Cancer Control and Population Sciences, National Cancer
Institute, Bethesda, MD, USA
References
1. McGlynn EA, Asch SM, Adams J, Keesey J, Hicks J, DeCristofaro A, Kerr EA:
The quality of health care delivered to adults in the United States. N
Engl J Med 2003, 348:2635-2645.
2. Kohn L, Corrigan J, Donaldson M, Eds: To Err Is Human: Building a Safer
Health System. Washington, DC: The National Academy Press; 2000.
3. Hewitt M, Simone J, eds: Ensuring Quality Cancer Care Washington, DC: The
National Academy Press; 1999.
4. Rosenthal MB, Fernandopulle R, Song HR, Landon B: Paying for quality:
providers' incentives for quality improvement.[see comment]. Health
Affairs 2004, 23:127-141.
5. McCarthy D: Case Study: Improving Quality and Efficiency in Response
to Pay-for-Performance Incentives Under the Medicare Physician
Group Practice Demonstration. In Quality Matters: Pay-for-Performance in
Medicare Volume 20. The Commonwealth Fund Digest; 2006.
6. Landon BE, Normand SL: Performance measurement in the small office
practice: challenges and potential solutions. Ann Intern Med 2008,
148:353-357.
7. Landon BE, Hicks LS, O'Malley AJ, et al.: Improving the management of
chronic disease at community health centers.[see comment]. New
England Journal of Medicine 2007, 356:921-934.
8. Langley G, Nolan K, Nolan T, Norman C, Provost L: The Improvement Guide:
A Practical Approach to Enhancing Organizational Performance San
Francisco: Jossey-Bass; 1996.
9. Schmittdiel J, Bodenheimer T, Solomon NA, Gillies RR, Shortell SM: Brief
report: The prevalence and use of chronic disease registries in
physician organizations. A national survey. Journal of General Internal
Medicine 2005, 20:855-858.
10. Horbar JD, Rogowski J, Plsek PE, Delmore P, Edwards WH, Hocker J, Kantak
AD, Lewallen P, Lewis W, Lewit E, et al.: Collaborative quality
improvement for neonatal intensive care. NIC/Q Project Investigators
of the Vermont Oxford Network. Pediatrics 2001, 107:14-22.
11. Asch SM, Baker DW, Keesey JW, Broder M, Schonlau M, Rosen M, Wallace
PL, Keeler EB: Does the collaborative model improve care for chronic
heart failure? Medical Care 2005, 43:667-675.
12. Landon BE, Wilson IB, McInnes K, Landrum MB, Hirschhorn L, Marsden PV,
Gustafson D, Cleary PD: Effects of a quality improvement collaborative
on the outcome of care of patients with HIV infection: the EQHIV study.
Ann Intern Med 2004, 140:887-896.
13. Batalden PB, Davidoff F: What is 'quality improvement' and how can it
transform healthcare? Qual Saf Health Care 2007, 16:2-3.
14. Harmon RG, Carlson RH: HRSA's role in primary care and public health in
the 1990s. Public Health Reports 1991, 106:6-10.
15. Kilo CM: A framework for collaborative improvement: lessons from the
Institute for Healthcare Improvement's Breakthrough Series. Qual
Manag Health Care 1998, 6:1-13.
16. Wagner EH, Glasgow RE, Davis C, Bonomi AE, Provost L, McCulloch D,
Carver P, Sixta C: Quality improvement in chronic illness care: a
collaborative approach. Jt Comm J Qual Improv 2001, 27:63-80.
17. Wagner EH, Austin BT, Von Korff M: Organizing care for patients with
chronic illness. Milbank Q 1996, 74:511-544.
18. Zapka JG, Taplin SH, Solberg LI, Manos MM: A framework for improving
the quality of cancer care: the case of breast and cervical cancer
screening. Cancer Epidemiol Biomarkers Prev 2003, 12:4-13.
19. National Committee for Quality Assurance (NCQA): HEDIS 2006. Health
plan employer data & information set Vol. 2, Technical specifications.
Washington DC. 2005.
20. Physician Consortium for Performance Improvement, clinical
performance measures: Preventive Care and Screening. Chicago:
American Medical Association (AMA); 2005.
21. Bauer DS-S, Lavery R, Ford C: Proc Power in SAS 9.1. SUGI 29 .
22. Etheredge LM: A rapid-learning health system. Health Aff (Millwood)
2007, 26:w107-118.
23. Fletcher SW, Elmore JG: Clinical practice. Mammographic screening for
breast cancer.[see comment]. New England Journal of Medicine 2003,
348:1672-1680.
24. Brown ML, Houn F, Sickles EA, Kessler LG: Screening mammography in
community practice: positive predictive value of abnormal findings
and yield of follow-up diagnostic procedures. AJR Am J Roentgenol
1995, 165:1373-1377.
25. Nolan T, Berwick DM: All-or-none measurement raises the bar on
performance. Jama 2006, 295:1168-1170.
26. McCormick D, Himmelstein DU, Woolhandler S, Wolfe SM, Bor DH:
Relationship between low quality-of-care scores and HMOs'
subsequent public disclosure of quality-of-care scores. Jama 2002,
288:1484-1490.
27. Fisher E: Building a medical neighborhood for the medical home. N
Engl J Med 2008, 359:1202-1205.
28. Taplin SH, Haggstrom D, Jacobs T, Determan A, Granger J, Montalvo W,
Snyder WM, Lockhart S, Calvo A: Implementing colorectal cancer
screening in community health centers: addressing cancer health
disparities through a regional cancer collaborative. Med Care 2008,
46:S74-83.
29. Bynum JP, Bernal-Delgado E, Gottlieb D, Fisher E: Assigning ambulatory
patients and their physicians to hospitals: a method for obtaining
population-based provider performance measurements. Health Serv
Res 2007, 42:45-62.
30. Fisher ES, Staiger DO, Bynum JP, Gottlieb DJ: Creating accountable care
organizations: the extended hospital medical staff. Health Aff
(Millwood) 2007, 26:w44-57.
Additional file 1 Performance measures of cancer care processes
Received: 18 September 2008 Accepted: 4 June 2010
Published: 4 June 2010
This article is available from: 2010 Haggstrom et al; licensee BioMed Central Ltd. This is an Open Access article distributed under the terms of the Creative Commons Attribution License ( ), which permits unrestricted use, distribution, and reproduction in any medium, provided the original work is properly cited.Implementation Science 2010, 5:42
Haggstrom et al. Implementation Science 2010, 5:42
/>Page 15 of 15
31. Fisher ES: Building a medical neighborhood for the medical home. N
Engl J Med 2008, 359:1202-1205.
32. Fiscella K, Geiger HJ: Health information technology and quality
improvement for community health centers. Health Aff (Millwood) 2006,
25:405-412.
33. Miller RH, West CE: The value of electronic health records in community
health centers: policy implications. Health Aff (Millwood) 2007,
26:206-214.
34. Carey RG: Basic and Advanced SPC Methods and Case Studies Milwaukee:
Quality Press; 2003.
35. Chin MH, Cook S, Drum ML, Jin L, Guillen M, Humikowski CA, Koppert J,
Harrison JF, Lippold S, Schaefer CT: Improving diabetes care in midwest
community health centers with the health disparities collaborative.
Diabetes Care 2004, 27:2-8.
36. Landon BE, O'Malley AJ, Keegan T: Can Choice of the Sample Population
Affect Perceived Performance: Implications for Performance
Assessment. J Gen Intern Med 2009, 21:21.
37. Mittman BS: Creating the evidence base for quality improvement
collaboratives. Ann Intern Med 2004, 140:897-901.
38. Auerbach AD, Landefeld CS, Shojania KG: The tension between needing
to improve care and knowing how to do it. N Engl J Med 2007,
357:608-613.
doi: 10.1186/1748-5908-5-42
Cite this article as: Haggstrom et al., The health disparities cancer collabora-
tive: a case study of practice registry measurement in a quality improvement
collaborative Implementation Science 2010, 5:42