báo cáo khoa học: "Understanding the implementation of evidencebased care: A structural network approach" ppsx
Bạn đang xem bản rút gọn của tài liệu. Xem và tải ngay bản đầy đủ của tài liệu tại đây (408.06 KB, 10 trang )
RESEARCH Open Access
Understanding the implementation of evidence-
based care: A structural network approach
Michael L Parchman
1,2*
, Caterina M Scoglio
3
, Phillip Schumm
3
Abstract
Background: Recent study of complex networks has yielded many new insights into phenomenon such as social
networks, the internet, and sexually transmitted infections. The purpose of this analysis is to examine the properties
of a network created by the ‘co-care’ of patients within one region of the Veterans Health Affairs.
Methods: Data were obtained for all outpatient visits from 1 October 2006 to 30 September 2008 within one large
Veterans Integrated Service Network. Types of physician within each clinic were nodes connected by shared
patients, with a weighted link representing the number of shared patients between each connected pair. Network
metrics calculated included edge weights, node degree, node strength, node coreness, and node betweenness.
Log-log plots were used to examine the distribution of these metrics. Sizes of k-core networks were also computed
under multiple conditions of node removal.
Results: There were 4,310,465 encounters by 266,710 shared patients between 722 provider types (nodes) across
41 stations or clinics resulting in 34,390 edges. The number of other nodes to which primary care provider nodes
have a connection (172.7) is 42% greater than that of general surgeons and two and one-half times as high as
cardiology. The log-log plot of the edge weight distribution appears to be linear in nature, revealing a ‘scale-free’
characteristic of the network, while the distributions of node degr ee and node strength are less so. The analysis of
the k-core network sizes under increasing removal of primary care nodes shows that about 10 most connected
primary care nodes play a critical role in keeping the k-core networks connected, because their removal
disintegrates the highest k-core network.
Conclusions: Delivery of healthcare in a large healthcare system such as that of the US Department of Veterans
Affairs (VA) can be represented as a complex network. This network consists of highly connected provider nodes
that serve as ‘hubs’ within the network, and demonstrates some ‘scale-free’ properties. By using currently available
tools to explore its topology, we can explore how the underlying connectivity of such a system affects the
behavior of providers, and perhaps leverage that understanding to improve quality and outcomes of care.
Background
Efforts to date to understand the slowness of physicians
to implement evidence-based guidelines has been hin-
dered by an overreliance on the attributes, knowledge,
decision making, and actions of individual clinicians and
an under-recognition of the network of care within
which they operate [1-5]. For example, in efforts to
understand adoption of guidelines, research to date has
largely focused on individual attributes of the providers
using theories such as the theory of planned behavior
[6]. However, little is known about adoption of guide-
lines from the perspective of the network of providers
within which a single provider is embedded.
One of the earliest examinations of diffusion of infor-
mation and behaviors between physicians is the landmark
study of physician prescribing behavior by Coleman, Katz
and Mentzel in the mid-1950s [7]. They found that t he
properties of relat ionships formed by physicians in a net-
work predict the adoption of a new medication. The
adoption occurs first between community physicians who
have contact with opinion leaders, and then between
physici ans who are social friends. However, re-analysis of
the data raised questions about the findings and how the
* Correspondence:
1
Family & Community Medicine Department, 7703 Floyd Curl Drive,
University of Texas Health Science Center, San Antonio, Texas, 78229-3884,
USA
Full list of author information is available at the end of the article
Parchman et al. Implementation Science 2011, 6:14
/>Implementation
Science
© 2011 Parchman et al; licensee BioMed Central Ltd. This is an Open Access article distributed under the terms of the Creative
Commons Attribution License ( which permits unrestricted use, distribution, and
reproduction in any medium, provided the original work is properly cited.
opinions and behaviors of other physicians affect those
with whom they interact [8].
Physicians may also i nfluence each other as they
observe and compare the care provided to their patients
by other physicians, even if they have no direct commu-
nication with the other physician. As noted by Mittman
and colleagues, healthcare professionals work within
peer groups who share common values, assumptions,
and beliefs, and individual behavior can be strongly
influenced by these factors [3]. Patients often return to
their physician after contact with another physician with
a new diagnostic workup, or taking a new medication
the primary physician may not b e familiar or comforta-
ble with. For example, Keating and colleagues documen-
ted that physicians o btain information from other
physicians who they consider to have more expertise in
the knowledge area [9].
The ‘sharing of care’ between two physicians creates a
link or a connection. Physicians who share the care of
many patients have stronger linkages than with physi-
cians whom they share the care of few patients. Physi-
cians are also connected with many other physicians
through these linkages, a ll of which when taken into
consideration form a ‘ network of healthcare delivery.’
What is not well understood is if this pattern of shared
care influences the awareness, acceptance, and adoption
of new information by physicians across an integrated
network. To examine this issue, it is neces sary to estab-
lish the feasibility of constructing such a network and
examine its properties before testing hypotheses about
how these network metrics or properties might influ-
ence provider behavior and healthcare outcomes.
Over the past 15 years, there has been an explosion of
interest in the study of complex networks [10]. Network
science has advanced our unde rstanding of complex sys-
tems from the internet and worldwide web, social sys-
tems, and organizations [11], all the way down to the
protein communication channels within cells [12]. Most
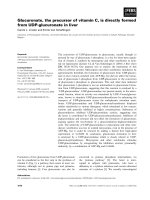
network research is an outgrowth of graph theory, a
field within discrete mathematics [13,14]. A defined set
of entities, designated as ‘nodes, ’ are represented as ver-
tices on the graph. Relationships between the nodes are
represented as links or ‘edges’ (Figure 1). This represen-
tational framework, although on its surface quite basic,
can be remarkably c omplex. For example, edges can be
non-directional, unidirectional, or bidirectional. Edges
can have weights which represent some strength of the
relationship between two nodes. By calculating how
many edges connect a node to the network, the strength
of the connection of a node to the network can be
determined. In the network created in this paper, the
strengths of the edges are calculated as the number of
patients two physicians have in common. Although
node degree and edge weight can tell us about how well
a node is connected to the network, nodes can have
relative positions within the network represented by
measures of centrality. For example, the ‘k-coreness’ of a
node is defined as the presence of the node in a sub-
network obtained by stepwise removal of nodes that are
less well connected to the network as measured by their
node degree for unweighted networks or strength for
weighted ones. The k-core sub-networks are comprised
of nodes with a remaining node degree or strength of k
or higher.
These network metrics or properties also r eflect the
rules governing network formation. The first well-stu-
died network models, namely Erdos-Renyi and Gilbert
random graphs, assumed that the connections between
nodes in a network were generated randomly, with a
given probability. More recent work has established new
network models that are formed by ‘preferential attach-
ment’ of new nodes [15]. Preferential attachment
describes a phenomenon where the probability that a
node is connected to another node is proportional to
the other node’s degree, strength, or other measure o f
connectivity, or more generally the node’ s wealth. This
follows the ‘rich get richer’ cliché. O ne result of a net-
work whose formation is governed by preferential
attachment is that the distribution of network met rics
or properties follows a power-law. Interestingly, it has
been shown that many real world complex networks are
well represented by preferential attachment models [15].
There have been some attempts to examine the deliv-
ery of healthcare from a network perspective [9,16,17].
Iwashyna and colleagues describe a critical care network
comprised of hospitals [17]. Others have described a
relational approach to competition between hospitals
[16], and a social network of physicians within one aca-
demic health center based on who they say they go to
Node
Edge or Link
Weighted: Different
link colors represent
different link weights
Un-Weighted
Figure 1 Undirected network diagrams.
Parchman et al. Implementation Science 2011, 6:14
/>Page 2 of 10
for advice about women’ shealthissues[9].However,
creating a network comprised of clinicians who are con-
nected to each other by the shared care of a patient has,
to our knowledge, not been used to study the complex
network of healthcare delivery. The purpose of this ana-
lysis is to examine the properties of a complex network
formed by the delivery of outpatient care within one
regional Veterans Healthcare System, a ‘Veterans Health
Administration Veterans Integrated Service Network’
(VISN) and explore the implications of these properties
for implementation of new evidence into medical
practice.
Sources of data
The D epartment of Veterans Affairs (VA) is the largest
integrated healthcare delivery sy stem in the US. Because
it has an integrated electroni c health syst em used by all
clinicians, it is an i deal setting to examine the network
properties of outpatient healthcare delivery. The VA
divides its national delivery sys tem into regional systems
called VISNs. Each VISN has two or more VA medical
centers with outlying outpatient clinics. Within each
clinic, physicians may refer to each other or to physi-
cians at another clinic or VA medical center within the
VISN. The VA system has a clear hierarchical structure,
which will be reflected in the network’s structure.
For purposes of this study, we obtained VA adminis-
trative data on all outpatient encounters from one VISN
with three VA medical centers over a 36-month time
period: 1 October 2006 to 30 September 2008. This data
set provides ‘station’ or clinic location of service, ‘provi-
der type’ within each station, and a patient identifier
and date of service along with the diagnoses for each
service delivered. For data security purposes, identifiers
of the clinic and individual patients were scrambled so
they were de-identified. Date of service for each patient
was randomly offset to prevent identification as well. In
addition, the VA would not allow identification of indi-
vidual healthcare providers, only the type of provider
within each clinic or ‘ station’ in this VISN. Therefore,
one node in the network may represent one cardiologist
or many cardiologists within the same clinic location.
Network construction
The network was constructed based on the following
rules: Each node is a physician type within a clinic loca-
tion; an edge between two nodes represents one or
more patients who have visited both clinician types and
is weight ed by the number of shared patients. There are
many possible networks that could be constructed using
the available data. Because the objective of this analysis
is to investigate the spread of information, this ‘co-care’
network was selected based on the work previously
mentioned demonstrating that physicians within a
healthcare setting share information with each other
about patient care and influence each other’ sopinions
[3,9]. The relat ionships among provider nodes can be
estimated by the sharing of patients.
Network measurements
This section summarizes the differe nt mathematical
appr oaches to measure the topological characteri stics of
the network of the VA outpatient care. Many diverse
metrics have been proposed in the literature b y authors
from multiple disciplines such as discrete mathematics,
statistical physics, and networking to assess apriori
strengths and weakness es of networks [13,14]. However,
the specificity of information provided by each metric is
not clear, because the information is partial and interde-
pendent. Fo r the question of diffusion, one migh t exam-
ine degree centrality, betweenness centrality, or a key
actor formulation in an effort to understand how infor-
mation and changes in provider behavior are influenced
by the network in which they are embedded [18,19]. In
the following, we describe four network metrics selected
for the purposes of this analysis.
Node degree
The degree d
v
of a given node v is defined as the number
of links connected to it. The degree also is equal to the
number of nodes that are at distance one from v,also
called neighbors of v. Computing d
v
for each v,wecan
deduce the node degree distribution. Typical node degree
distributions for large real world networks show a heavy
tail. This means that there are a few, but not zero, nodes
with very high node degrees. These nodes are frequently
called hubs, and play a critical role in the network.
Node strength and edge weights
Edges themsel ves can also have weights, which are con-
sidered to be the strength of the link between nodes. So
each link between a pair of physicians can be thought of
as having a weight determined by the number of unique
patients shared between these two physicians over a
given period of time, and this v alue can be determined
for each edge, or across a set of edges within a sub-
network. Using edge weights, the concept of node
degr ee is extended to define the strength of the node as
the total weights of the links connected to it. All metrics
can be extended to the case of weighted networks, and a
thorough definition and discussion of them can be
found in Barrat et al. and Newman [13,14].
Node betweenness
Between every pair of nodes in a conne cted network,
there exists a path on the network among all possible
paths that has the shortest distance between the pair of
nodes. For each node, the number of shortest paths that
Parchman et al. Implementation Science 2011, 6:14
/>Page 3 of 10
transverse a node, normalized by the maximum possible
number of shortest paths that could traverse the node,
is known as node betweenness, and serves as a centrality
measure [13,14]. To compute distance-based paths in
this network, the inverse of the edge weight is used to
represent the ‘ distance’ between one connected pair of
nodes: a higher number of shared patients between two
provider nodes correspo nds to a shorter distance
between them.
Node ‘coreness’
This definition of the coreness or centrality of a node
within a larger networ k is based on the decomposition of
the network in its k-core sub-n etworks. This decomposi-
tion is obtained by pruning iteratively the least connected
nodes, thus detecting the nodes th at progressively belong
to the central core. The k-core sub-network of a network
can be obtained by recursively removing all nodes o f
degree less than k, until all nodes in the remaining net-
work have at least degree k. After the iterative removal of
all nodes of degree less than k, the size of the remaining
k-core sub-network is the number of nodes remaining,
where k is referred to as the threshold of the k-core.
Anodeissaidtohavecorenessk if it belongs to the
k-core but does not belong to the (k+1)-core [13,14].
Analysis
The n etwork was con structed by linking provider types
within and between each station/clinic (nodes) together
with links (edges) that are shared patients. The data set
was limited to provider types that only represent clini-
cians (physicians, physician assistant s, and nurs e practi-
tioners) and excluded encounters such as nurse phone
calls or pharmacy medication pick-ups. Furthermore, we
eliminated reside nt or fellows from the analysis beca use
of their rapid turnover from one year to the n ext. The
network metrics were calculated using C. Visualization
of the resulting network was enabled through the KiNG
software. The distri-
bution of each of the network properties was plotted
because the resulting plots inform us about both how
the network was formed and the topology of the net-
work itself [13].
Results
The initial data set included all outpatient encounters,
including phone calls, pharmacy pick-up, and nurse
entries into the medical record. Using provider type
codes we were able to limit the data set to encounters
with physicians, physician assistants, and nurse practi-
tioners. This reduced data set had 4,310,465 encounters
by 266,710 shared patients between 722 provider nodes
across 41 stations or clinics resulting in 34,390 edges. It
is important to remember that a link between any two
provider nodes can occur with one shared patient or
many shared patients. Thus these links or ‘edges’ have
weights that correspond to the strength of the connec-
tion between any two nodes which repre sent a provider
type within a clinic/station.
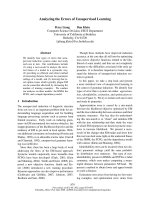
The g raphical description of the resulting network is
showninFigure2.Thisnetworkisorganizedaround
the three VA medical centers within the VISN. Each
‘node’ in the figure represents a provider or clinician
type within a clinic location, e.g., primary care, general
surgery, or cardiology. The only edges or links displayed
in Figure 2 are those where more than 10 patients are
shared between any two provider nodes within a station.
As the colors of t he edges move from greens to reds to
violets, the edges represent higher numbers of shared
patients between two nodes, and thus higher ‘ edge
weights.’ We grouped these provider node types by loca-
tion such that each circle of nodes represents a clinic or
station (See the inset enlarged clinic in Figure 2). These
circles of nodes representing clinics or stations are then
arranged into three larger circles of clinics by their asso-
ciation with the three VA medical center clinics, whic h
arelocatedinthecentersofeachofthethreelargecir-
cles. The orientation of the network in Figure 2 displays
a view of the organizational structure of the VISN.
Results of the calculation of network metrics are
shown in Table 1. These results suggest that primary
care nodes are very well connected ‘central’ nodes in the
network. In fact, some of them with very high node
degrees function as ‘hubs,’ which are very highly con-
nected nodes in the network. In fact, their node degree,
the number of other nodes or provider types to which
they have a connection by sharing a patient (172.7), is
42% greater than that of general surgeon nodes and two
and one-half t imes as high as cardiology nodes. Similar
magnitudes of difference are found with node strength
and edge weight. Of the top 20 nodes a s ranked by
node strength, 10 were primary care, five were surgeon
nodesandthreewerecardiologynodesandtwowere
rehabilitation nodes. As mentioned in the methods, one
might also examine betweeness centrality rather than
degree centrality. We calculated both to compare results
and found similar results with the primary care nodes
having an average value three times greater than that of
general surgeon nodes, who had the second highest
average. Both degree centrality and betweenness central-
ity identify the primary care provider nodes as the most
central set of nodes.
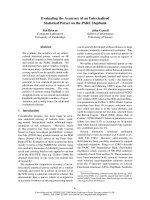
To further investigate the overall properties of these
networks, we constructed log-log plots of the distribu-
tion of each of the above network metrics. (Figure 3)
The log-log plot of the edge weight distribution appears
to be consistent with a scale-free network, while the dis-
tributions of node degree and node strength are less so,
Parchman et al. Implementation Science 2011, 6:14
/>Page 4 of 10
and are similar to a ‘ heavy-tail, droop-head’ distribution,
characteristic of networks that are formed by a combi-
nation of preferential and random attachments. The
implications of these distributions for how the network
forms, and how information flows across the network
are found in the discussion below.
Our analysis identified primary care type nodes hold
important roles in connecting the network because of
their relatively higher averag e node degree, node
strength, and node betweenness compared to other pro-
vider node types. We observed how the sizes of the net-
work cores change as all o f the 80 primary care nodes
in the network ar e removed one at a time from the net-
work by rank order starting with the primary care node
with the highest strength (Figure 4a). The top curve in
Figure 4a corresponds to the original network with all
VA Medical Centers are at the ‘hubs’ of the three circles or wheels above.
Each circle is comprised of smaller circles representing individual VA
outpatient clinics, and within each clinic, each purple node in the circle of
nodes (see enlarged inse
t on right) represents a physician ‘type’ such as
primary care, general surgery, or cardiology within each clinic location.
Figure 2 Network diagram of all physician types across clinics who shared a patient over a 36 month time period, showing only
connections composed of more than 10 patients.
Parchman et al. Implementation Science 2011, 6:14
/>Page 5 of 10
primary care no des, and the bottom curve corresponds
to a second network with all primary care nodes
removed. It can be seen that after 10 to 20 primary care
nodes are removed, there is little change in the network
cores as the remaining primary care nodes are removed.
We repeated this analysis with removing the primary
care node by order of the highest betweenness nodes
first (Figure 4b). We observe that the results are mostly
similar for the two remo val strategies, but the removal
by node strength reduces the core sizes more rapidly.
This indicates that the node strengths are better than
the node betweennesse s for identifying critical central
nodes for holding together the strongest cores of the
network from among the primary care nodes.
Discussion
We have demonstrated that the delivery of healthcare in
a l arge healthcare system such as the VA can be repre-
sented as a complex network whe re provider nodes are
linked by ‘ edges’ formed by delivering care to the same
patient, and that such a network has properties that
reflect both preferential and random attachments. First,
we discuss conceptual models for the spread or diffusion
of a new physician behavior across a network. Next we
discuss how some of the properties of the observed
network are ‘scale -free,’ some are not, and implications
of network structure for how information spreads across
such a network.
One of the basic tenets of a network analysis comprised
of individuals, a ‘social network,’ is that the structure of
the network matters. That is, the outcomes of a node and
its future behavior depend in part on its relative positio n
within the network. There is a burgeoning field of such
analyses in the organizational and social science literature
as we attempt to better understand predictors of organi-
zational performance and outcomes [11,20,21].
While there are many models and behavioral theories
about changing behavior, one that has been widely used
is Everett Rogers’ diffusion of innovation theory, which
postulates a series of steps for an individual: knowledge,
persuasion, decision, trial, and adoption [22]. Although
empirical research has demonstrated the importance of
contacts through a social network in this process, there
remain many unanswered questions about timing of
adoption and the influence of the structure of the net-
work on adoption in healthcare. Outside the field of
healthcare delivery, much of the work on networks and
diffusion was done by observing and measuring personal
contacts and inte ractions. Over the past decade, much
of that interpersonal communication and opinion lea-
dership is mediated by two-way electronic media, s uch
as an EMR [23].
Some may question the construction of a network
based on the co-care of a patient as documented in an
electronic health record (EHR). The question is whether
merely observing behavior through a format such as the
EHR will change physicians’ behavior. The ability of
peop le to influence each other without personal contact
was recently demonstrated by Centola in an online
social experiment [21]. Individuals were merely
informed about the adoption of a health behavior by
their online neighbors but were not allowed direct con-
tact with them. The results showed that adoption of a
new health behavior was much more likely when partici-
pants received social reinforcement as a result of
belonging to a network characterized by many clust ered
ties but a high degree of separation, compared to those
in a network where the connections between nodes are
random. Thus, network structure has a profound effect
on the dynamics of behavioral diffusion.
Structural properties of the VA network
Unlike a binary network where a link is counted as only
present or absent, an examination of the distributions of
node strength and edge weight provides a better descrip-
tion of pr operties of a weighted network t han node
degree distribution. This is because the former properties
reflect true nature of the network with weights on the
links between nodes whereas node degree does not
Table 1 Network metrics
Mean (S.D) Median Range
Node Degree
All Providers 95.3 (93.3) 72.5 1 to 429
Primary Care 172.7 (100.5) 163.5 1 to 429
General Surgery 121.4 (114.0) 108 1 to 400
Cardiology 66.9 (117.1) 14 1 to 353
Pulmonary 75.6 (106.3) 12.5 1 to 318
Node Strength
All Providers 3,885.1 (9,345.9) 432 1 to 103,618
Primary Care 11,121.4 (18,481.8) 4,410.5 1 to 103,618
General Surgery 6,560.1 (11,273.2) 1,175.5 1 to 59,696
Cardiology 5,314.9 (13,090.8) 28 1 to 47,045
Pulmonary 3,726.6 (8,559.4) 15 1 to 33,070
Edge Weight
All Edges 40.8 (199.6) 3 1 to 9,225
All Providers Avg 17.2 (27.8) 5.9 1 to 241.5
Primary Care 40.9 (46.7) 26.5 1 to 241.5
General Surgery 25.8 (33.8) 11.3 1 to 149.2
Cardiology 17.9 (38.7) 1.8 1 to 133.3
Pulmonary 15.1 (28.1) 1.2 1 to 104.0
Node Betweenness
All Providers 0.005565 (0.042951) 0 0 to 0.658426
Primary Care 0.033479 (0.106154) 0.002952 0 to 0.658426
General Surgery 0.011113 (0.061974) 0 0 to 0.493710
Cardiology 0.002786 (0.009301) 0 0 to 0.040531
Pulmonary 0.001038 (0.003479) 0 0 to 0.013820
Parchman et al. Implementation Science 2011, 6:14
/>Page 6 of 10
[13,14]. A close examination of resulting network plots in
Figure 3, especially the edge weight distribution, suggests
that this VA provider type/s tation network may have
‘scale-free’ characteristics. Scale-free networks have been
observed in social, technical, and biologic networks
[12,24,2 5]. For example, the number of sexual contacts
follows a scale-free distribution within a society [24]. In a
scale-free network the distribution of one or more
metrics, in this case the edge weights and nearly the node
strength s, follow a power-law distribution, thus the name
scale-free. The existence of a power law means that edge
weights have a wide distribution; there is no ‘typical’ or
central tendency of the we ight of the link between any
twoprovidernodes.Inascale-free network, new
information spreads rapidly across the network [23]. One
example of this is the rapid spread of computer viruses
through the internet, another scale-free network at the
autonomous system level [25].
What are the implications of the scale-free distribution
of edge weights within this network? If the propagation
or implementation of new information or behaviors
withinahealthcaresystemweresolelydependentonthe
strength of the link, the ‘ edge weight’ between any two
prov ider nodes, then a perfectly scale-free distribution of
node strengths would suggest that the implementation of
new evidence across a healthcare system would spread
rapidly. Unfortunately, evidence suggests that is very
rarely the case [26]. What other properties of the above
Figure
3
a. Figure
3
b.
R
2
linear
= 0.009
R
2
exponential
= 0.37
R
2
p
ower-law
= 0.896
R
2
linear
= 0.217
R
2
exponential
= 0.324
R
2
power-law
= 0.491
Figure 3c.
Figure 3d:
R
2
linear
= 0.020,
R
2
exponential
= 0.257
R
2
power-law
= 0.755
Figure 3 Log-log plots of network metrics.
Parchman et al. Implementation Science 2011, 6:14
/>Page 7 of 10
describednetworkmighthelpusunderstandhownew
evidence is adopted in a healthcare system?
More recent work in network formation reveals that
the ‘heavy-tailed, droop-head’ appearance in Figures 3a
and 3b i s a result of both preferential and random
attachments governing the growthofthenetwork[27].
The terms ‘heavy-tail’ and ‘droop-head’ refer respectively
to the wide portion of the tail of the distribution (The
distribution of node degrees from 20 to 429 diverge
from the power-law model) and the lower values at the
4a. k-Core Sizes while Removing Primary Care Nodes
by Highest Node Strength
4b. k-Core sizes while removing primary care nodes by
hi
g
hest node betweenness
Figure 4 The size of the network k-core versus the core threshold k by node strength as primary care nodes are removed from the
network.
Parchman et al. Implementation Science 2011, 6:14
/>Page 8 of 10
head of the distribution (The distribu tion between node
degrees of 1 and 5 falls below the power-law model).
How might this occur within the delivery of health-
car e? It is fairly obvious that within a health care system
some co nstrained preferential attachments may b e gen-
erated, for example, a primary care physician may be
more likely to refer to a cardiologist that they know or
with whom they have worked in the past within close
geographic proximity. In addition, patients may be more
likely to see another primary care provider they have
heard about from other patients in the same clinic when
their primary care provider is not available. The node
strength serves as a measure of the popularity of the
provider type node and as a significant influence in the
development process of new connections among provi-
der nodes.
Butwhatabout‘ random’ connections formed among
provider nodes for some reason other than the wealth
(node strength) of the other nodes in the network?
There are several possibilities: some patients may move
to another city and re-establish care at a different VA
medical c enter resulting in a link between their former
physician and new physicians at that distant VA medical
center. It is also possible that patients seen by a primary
care provider may become acutely ill and be seen by
other physicians to whom the usual care physicians do
not normally refer for this acute illness.
It has been shown in other network analyses that
when the tail of the distribution is wide, there are physi-
cal limitations, such as geographic proximity o f provi-
ders, that begin to influence the total number of
contacts of a node [27]. The downward curve or ‘ droo-
piness’ at the head of the distribution suggests that, in
general, it is not desirable to be very poorly connecte d
in the network, and thus the nodes at this end of the
distribution form a few more connections to the rest of
the network causing the frequencies of the least con-
nected nodes to d rop. Within a healthcare system such
as the VA, providers are unlikely to be very poorly con-
nected to the network because the patient population
they care for are largely patients with multiple chronic
medical conditions, requiring the service of a diverse
group of specialists and primary care providers [28].
Because there are many factors (other than those that
might be explained by a wealth of a provider-type at a
clinic/station or the clinic/station itself ) that may influ-
ence the decisions of providers in where they refer their
patients, and thus whom they end up sharing patients
with, some ‘ randomness’ or deviations from a near-
perfect power-law distribution is expe cted for the node
degrees and stre ngths. However, f rom the nearness of
Figure 3b to a power-law distribution (R
2
= 0.755), it
appears that whatever the various factors are that
influence the connections, most of them would correlate
with the strengths of the provider nodes.
What are the implications of the node degree and
node strength distributions for the diffusion of informa-
tion across this netwo rk? The flow of information
described above is slower in networks that are not
highly scale-free [13,15]. This finding may partially
explain why the spread or propagation of the use of new
more effective medications or therapies or diagnostic
tests occurs slowly across a healthcare system such as
the VA.
As shown in Figure 4, the overall connectivity of the
networkwouldbemuchlowerifonly10to20specific
primary care nodes we re removed. There are two pos-
sibilities as a result of such a disruption. First, it is
possible that such a disruption might affect the propa-
gation of new information across the network. So
although networks with scale-free properties are robust
to random removal of nodes, targeted removal of 10 to
20 specific primary care n odes could severely restrain
the ability of the network to spread new ideas or
knowledge [29-31]. This finding also suggests that
improving dissemination and implementation of evi-
dence-based practice across the network might be
accelerated by targeting changes in the behaviors o f
these major hubs on the network. Conversely, another
type of information flow in a network is the sharing of
‘normative values’ which might be at odds with innova-
tive practices. Edges convey normative v alues as well as
new evidence-based ideas. Nodes with many connec-
tions might be a barrier to spread of a new behavior
across the network if the normative values conflict
with new evidence, especially if they are the ones who
are the oldest and most resistant to change. Thus,
removal of these nodes or reducing their connective-
ness might actually enhance the adoption of new beha-
viors among clinicians .
Several limitations exist in our analysis. First, and per-
haps most important, was the inability to obtain data
such that nodes represented distinct individual providers
rather than a type of provider within each clin ic/station.
It is possible that the centrality of primar y care provi-
ders is an artifact of this limitation. Second, we were
only able to construct a limited network in one small
region of the US. A larger national data s et would pro-
vide much greater insight into the network structure.
Finally, we do not have outcome measures that would
measure the spread or diffusion of e vidence or change
in behaviors across the network to test formal hypoth-
eses regarding the influence of network properties on
diffusion. Any such under-taking would al so need to
consider other network properties such as academic
affiliation of VA medical centers.
Parchman et al. Implementation Science 2011, 6:14
/>Page 9 of 10
Conclusions
In conclusion, similar to other studies of complex sys-
tems, the delivery of h ealthcare in a large system such as
the VA can be represented as components that interact
to form a complex network. By using currently available
tools to explore its topology, it should be possible to
investigate how the underlying connectivity of such a sys-
tem affects its behavior and develop strategies to improve
its p erformance. For example, one might study diffusion
of a provider behavio r such as adoption of a new feature
in the EHR by targeting initial implementation at key
hubs identified in a network analysis. The Veterans
Health Administrations continues to implement new fea-
tures in their clinical information infrastructure such as
new optional decision-making support or even use of
secure email to communicate with patients. This would
be a v ery rich and observable domain for a network ana-
lysis. In addition , the findings would leverage our under-
standing of how network properties may be used to
improve quality and outcomes of care.
Acknowledgements
Funding for this study provided by the National Academies Keck Futures
Initiative (NAKFI CS15) and the Department of Veterans Affairs, Veterans
Health Administration, Health Services Research and Development Service.
The views expressed in this article are those of the authors and do not
necessarily represent the views of the Department of Veterans Affairs.
Author details
1
Family & Community Medicine Department, 7703 Floyd Curl Drive,
University of Texas Health Science Center, San Antonio, Texas, 78229-3884,
USA.
2
VERDICT Health Services Research Program (11C6), South Texas
Veterans Healthcare System, 7400 Merton Minter Blvd, San Antonio, TX
78229-4404, USA.
3
Electrical and Computer Engineering Department, 2069
Rathbone Hall, Kansas State University, Manhatten, KS 66506, USA.
Authors’ contributions
PS carried out the network analysis and prepared the tables and figures for
the manuscript. CS supervised the work on the network analysis, assisted
with interpreting the network metrics and helped to draft the manuscript.
MP conceived of the analysis, assisted with interpretation of the network
data and drafted the manuscript. All authors read and approved the final
manuscript.
Competing interests
The authors declare that they have no competing interests.
Received: 2 July 2010 Accepted: 24 February 2011
Published: 24 February 2011
References
1. Grimshaw JM, Thomas RE, MacLennan G, Fraser C, Ramsay C, Vale L,
Whitty P, Eccles MP, Matowe l, Shirran L, Wensing M, Dijkstra R,
Donaldson C: Effectiveness and efficiency of guideline dissemination and
implementation strategies. Health Technol Assess 2004, 8:1-72.
2. Grimshaw JM, Eccles MP, Greener J, MacLennan G, Ibbotson T, Kahan JP,
Sullivan P: Is the involve ment of o pin ion le ader s in t he
implementation of research findings a feasible strategy? Implement Sci
2006, 22(1):3.
3. Mittman BS, Tonesk X, Jacobson JD: Implementing clinical practice
guidelines: social influence strategies and practitioner behavior change.
Qual Rev Bull 1992, 413-422.
4. Cabana MD, Rand CS, Powe NR, Wu AW, Wilson MH, Abboud PA, Rubin HR:
Why don’t physicians follow clinical practice guidelines? A framework
for improvement. JAMA 1999, 282:1450-65.
5. Berwick DM: Disseminating innovations in health care. JAMA 2003,
289:1969-75.
6. Perkins MB, Jensen PS, Jaccard J, Gollwitzer P, Oettingen G, et al: Applying
theory-driven approaches to understanding and modifying clinician’s
behavior: what do we know? Psychiatr Serv 2007, 58:342-8.
7. Coleman J, Katz E, Mentzel H: The diffusion of an innovation among
physicians. Sociometry 1957, 20:253-70.
8. Burt RS: Social contagion and innovation: cohesion versus structural
equivalence. Am J Sociology 1987, 92:1287-1335.
9. Keating NL, Ayanian JZ, Cleary PD, Marsden PV: Factors affecting
influential discussions among physicians: a social network analysis of a
primary care practice. JGIM 207(22):794-98.
10. Butts CT: Revisiting the foundations of network analysis. Science 2009,
325:414-416.
11. Borgatti SP: Identifying sets of key players in a social network. Comput
Math Organiz Theory 2006, 12:21-34.
12. Barabasi AL, Oltvai ZN: Network Biology: Understanding the cell’s
functional organization. Nature Reviews Genetics 2004, 5:101-113.
13. Barrat A, Barthelemy M, Vespignani A: Dynamical processes on complex
networks. Cambridge University Press; 2008.
14. Newman MEJ: Networks: An Introduction. USA: Oxford University Press;, 1
2010.
15. Barabasi AL, Albert R: The emergence of scaling in random networks.
Science 1999,
286:509-12.
16. Sohn MW: A relational approach to measuring competition among
hospitals. HSR 2002, 37:457-82.
17. Iwashyna TJ, Christise JS, Moody J, Kahn JM, Asch DA: The structure of
critical care transfer networks. Med Care 2009, 47:787-93.
18. Freeman LC: Centrality in social networks: conceptual clarification. Social
Networks 1978, 79:215-39.
19. Valente TW, Fujimoto K: Bridging: locating critical connectors in a
network. Social Networks 2010, 32:212-20.
20. Borgatti SP, Mehra A, Brass DJ, Labianca G: Network analysis in the social
sciences. Science 2009, 323:892-95.
21. Centola D: The spread of behavior in an online social network
experiment. Science 2010, 329:1194-7.
22. Rogers EM: Diffusion of Innovations. New York: Free Press;, 5 2003.
23. Green LW, Ottson JM, Garcia C, Hiatt RA: Diffusion theory and knowledge
dissemination, utilization and integration in public health. Ann Rev Pub
Health 2009, 30:151-174.
24. Schneeberger A, Mercer CH, Gregson SA, Ferguson NM, Nyamukapa CA,
Anderson RM, Johnson AM, Garnett GP: Scale-Free Networks Sexually
Transmitted Diseases: A Description of Observed Patterns of Sexual
Contacts in Britain and Zimbabwe. Sexually Transmitted Diseases 2004,
31:380-87.
25. Lloyd AL, May RM: How viruses spread among computers and people.
Science 2002, 292:1316-1318.
26. McGlynn EA, Asch SM, Adams J, Keesey J, Hicks J, DeCristofaro A, Kerr EA:
The quality of health care delivered to adults in the United States. NEJM
2003, 348:2635-45.
27. Li C, Chen G: A comprehensive weighted evolving network model.
Physica A 2004.
28. Noel PH, Parchman ML, Williams JW, Cornell JE, Shuko L, Zeber JE, Kazis LE,
Lee AF, Pugh JA: The challenges of multimorbidity from the patient
perspective. Journal of General Internal Medicine 2007, 22(S3):419-424.
29. Kooij R, Schumm P, Scoglio C, Youssef M: A new measure for robustness
with respect to virus spread. Proceedings of IFIP Networking 2009, Aachen,
Germany 2009.
30. Pastor-Satorras R, Vespignani A: Epidemic dynamics and endemic states in
complex networks. Phys Rev E 2001, 63:066117.
31. Albert R, Jeong H, Barabasi AL:
Attack and error tolerance of complex
networks. Nature 2000, 406:378-82.
doi:10.1186/1748-5908-6-14
Cite this article as: Parchman et al.: Understanding the implementation
of evidence-based care: A structural network approach. Implementation
Science 2011 6:14.
Parchman et al. Implementation Science 2011, 6:14
/>Page 10 of 10