báo cáo khoa học: "Design, rationale, and baseline characteristics of a cluster randomized controlled trial of pay for performance for hypertension treatment: study protocol" ppt
Bạn đang xem bản rút gọn của tài liệu. Xem và tải ngay bản đầy đủ của tài liệu tại đây (400.66 KB, 12 trang )
STUDY PROT O C O L Open Access
Design, rationale, and baseline characteristics of a
cluster randomized controlled trial of pay for
performance for hypertension treatment: study
protocol
Laura A Petersen
1*
, Tracy Urech
1
, Kate Simpson
1
, Kenneth Pietz
1
, Sylvia J Hysong
1
, Jochen Profit
1
,
Douglas Conrad
2
, R Adams Dudley
3
, Meghan Z Lutschg
1
, Robert Petzel
4
and LeChauncy D Woodard
1
Abstract
Background: Despite compelling evidence of the benefits of treatment and well-accepted guidelines for
treatment, hypertension is controlled in less than one-half of United States citizens.
Methods/design: This randomized controlled trial tests whether explicit financial incentives promote the translation of
guideline-recommended care for hypertension into clinical practice and improve blood pressure (BP) control in the
primary care setting. Using constrained randomization, we assigned 12 Veterans Affairs hospital outpatient clinics to
four study arms: physician-level incentive; group-level incentive; combination of physician and group incentives; and no
incentives (control). All participants at the hospital (cluster) were assigned to the same study arm. We enrolled 83 full-
time primary care physicians and 42 non-physician personnel. The intervention consisted of an educational session
about guideline-recommended care for hypertension, five audit and feedback reports, and five disbursements of
incentive payments. Incentive payments rewarded participants for chart-documented use of guideline-recommended
antihypertensive medications, BP control, and appropriate responses to uncontrolled BP during a prior four-month
performance period over the 20-month intervention. To identify potential unintended consequences of the incentives,
the study team interviewed study participants, as well as non-participant primary care personnel and leadership at
study sites. Chart reviews included data collection on quality measures not related to hypertension. To evaluate the
persistence of the effect of the incentives, the study design includes a washout period.
Discussion: We briefly describe the rationale for the interventions being studied, as well as the major design
choices. Rigorous research designs such as the one described here are necessary to determine whether
performance-based payment arrangements such as financial incentives result in me aningful quality improvements.
Trial Registration: NCT00302718
Background
Despite compelling evidence of the benefits of treat-
ment, hypertension is controlled in less than one-half of
United States (US) citizens with the disease [1]. Inade-
quate blood pressure (BP) control results in excess mor-
bidity a nd mortality from cardiac, renal, an d peripheral
vascular disea se [2]. While some cases of poor BP con-
trol relate to patients’ compliance with treatment, there
is significant under-treatment of hypertension on the
part of physicians. In one study, hypertension pat ients
received less than 65% of care that was indicated for
this condition [3].
Under-treatment of hypertension is puzzling, because
good evidence exists about the efficacy of antihyperten-
sive medications. Despite widespread dissemination of
guidelines for treatment of hypertension (including the
Seventh Report of the Joint National Committee (JNC
* Correspondence:
1
Health Policy and Quality Program, Michael E. DeBakey VA Medical Center
Health Services Research and Development Center of Excellence, and
Section for Health Services Research, Department of Medicine, Baylor
College of Medicine, Houston, TX, USA
Full list of author information is available at the end of the article
Petersen et al. Implementation Science 2011, 6:114
/>Implementation
Science
© 2011 Petersen et al; licensee BioMed Central Ltd. This is an Open Access article distributed under the terms of the Creative
Commons Attribution License ( which permits unrestrict ed use, distribution, and
reproduction in any medium, provided the original work is properly cited.
7) on Prevention, Detection, Evaluation, and T reatment
of High Blood Pressure), and widespread comparative
effectiveness trials such as the Antihypertensive and
Lipid-Lowering Treatment to Prevent Heart Attack
Trial (ALLHAT) [ 4], translation into clinical practice
has been incomplete [5].
Awareness of barriers to such clinical research transla-
tionhasraisedenthusiasmaboutusingnovelmethods,
such as financial incentive s, to overcome them [6]. A
number of pay-for-performance programs have been
implemented in the United Kingdom (UK) and the US
[7,8]. However, research evidence of effectiveness of
pay-for-performance programs, particularly randomized
trials, is limited [9,10]. Using a cluster randomized con-
trolled trial (RCT), we are testing the effect of explicit
financial incentives to promote the translation of guide-
line-recommend care for hypertension into clinical prac-
tice and thereby improve BP control in the primary care
setting. This trial addresses the needs of p olicy makers,
payers, physician s, administrators, and others for infor-
mation about a clinically relevant intervention in routine
practice. We are not aware of other ongoing randomized
trials of pay for performance directed at physicians and
provider groups [11].
Design of trial
Because our g oal was to evaluate the impact of financial
incentives on individual physicians as well as primary
care provider groups, we implemented a cluster rando-
mized controlled design and clustered at the facility
level [12].
Design of incentives
Should individuals, groups, or some combination receive
financial incentives for their performance? One could
anticipate that with group- or practice-team-level incen-
tives, individual physicians would not capture the full
returns on their individual effort to improve the quality
of their care. Traditional economic theory suggests that
the potential for some physicians to ‘ free-ride ’ on the
efforts of others may lead many to reduce their indivi-
dual efforts [10,13]. Conversely, the problem with
rewarding individuals, but not the individual’steamor
group, is that cooperation among the group is not
necessarily encouraged. Moreover, group incentives may
be important in supporting and rewarding infrastructure
improvements to the healthcare delivery system. Studies
evaluating the chronic care model suggest that multi-
disciplinary teams produce better patient outcomes
[14,15]. Yet, traditional fee-for-ser vice payment models
create disincentives for making organizational changes
in care delivery [15,16]. Thus, theory suggests the poten-
tial for group-level incentiv es to support organizational
and team-based efforts to improve quality, but it is not
yet known how these effects compare to individual-level
incentives.
The design of incentives for quality also raises the
question, what should we reward? Wo uld incentives tar-
geting processes (i.e., what clinicians do) or outcomes (i.
e., what ultimately happens to patients) be expected to
produce the highest quality? Of course, the best pro-
cess-of-care measures a re those for which there is evi-
dence that better performance leads to better outcomes.
But it is important to note that process-of-care mea-
sures may be more sensitive to quality differences than
are measures of outcomes, because a poor outcome
does not necessarily occur every time there is a quality
problem. Furthermore, outcomes are often dependent
upon events that are outside o f the control o f the clini-
cian. For example, one c an prescribe guideline-re com-
mended medications, but if the patient is not able to
adhere to these medications, the BP may not be con-
trolled. One theoretical problem with using incentives
solely based upon process-of-care measures is that phy-
sicians may attempt ‘gaming’ and focus solely on the
measure (i.e., use of a guideline-recommended medica-
tion), while ignoring the intended outcome, which is the
attainment of a target BP.
To avoid the problems associated with the exclusive
use of process-of-care or outcome measures described
above and to dampen the gaming incentive, both a pro-
cess-of-caremeasure(useofguideline-recommended
medications in patients who have no other compelling
indications) and an intermediate outcome measure
(achievement of the JNC 7 BP goal) will be used. This
approach may avoid the pitfalls of process-of-care mea-
sures alone that can encourage gaming, while avoiding
the disadvantage of basing incentives solely on outcomes
thatmayberelativelyrareordifficulttoachieveand
somewhat beyond the control of the provider. Thus, a
combined approach potentially capitalizes upon the
advantages and complementary nature of both types of
quality-of-care measures [9]. The design of our trial
reflects the following logic: other t hings being equal,
process-based incentives will create stronger incentives
for improvement in process (which the physician can
directly control); similarly, process-based incentives may
also produce better outcomes (assumin g that the pro-
cesses being incentivized improve outcomes). We
believe that combining outcome-based with process-
based incentives has the potential to produce even
greater quality improvement than process measures
alone [17].
A third design question is whether the incentive pay-
ments should be distributed according to relative perfor-
mance (i.e., the participant’ s percentile ranking
compared to peers) or absolute performance (i.e., strictly
according to performance relative to the same
Petersen et al. Implementation Science 2011, 6:114
/>Page 2 of 12
standard)? The former approach may be problematic
because participants cannot directly control the behavior
or outcomes of others on whom a relative comparison is
based. The latter approach rewards behavior that the
individual or group can directly control [10,13]. There-
fore, we designed our incentives to reward participants
each time they provided guideline-recommended medi-
cations and/or their patient met the guideline-recom-
mended BP threshold or, in the absence of controlled
BP, the participant appropriately responded to uncon-
trolled BP [17].
In this article, we describe the m ethods used to assess
the effects of physician- and group-level financial incen-
tives on processes and outcomes of care for outpatients
with hypertension.
Methods/design
Study objectives
Thegoalsofthisstudywereto:determinetheeffectof
physician-level financial ince ntives on processes and
outcomes of care for outpatients with hypertension;
assess the impact of group-level financial incentives;
ascertain whether there are additive effects of ph ysician-
plus group-level financial incentives; evaluate the persis-
tence of the effect of financ ial incentives; and identify
any unintended consequences of these explicit financial
incentives.
Study design
This study is a four-arm cluster RCT of individual phy-
sician incentives, group-level financial incentives, and
performance audit and feedback to improve the t ransla-
tion of guideline-recommended care fo r hypertension in
the primary care setting. Participants at study sites ran-
domized to one of the three intervention arms earned
either physician-level, group-level, or physician- and
group-level incentives (combined incentive arm). Both
intervention and control arm (no incentives) participants
received audit and feedback reports.
Study sites and constrained randomization
We partnered with five Veterans Affairs (VA) regional
networks to implement the study. Within these net-
works, hospital-based VA outpatient clinics that could
conduct human subjects’ research an d had eight or
more eligible primary care physicians were potential
study sites. Of the 22 potential study sites, only 12 met
the requirements for study implementation: hospital
director approval; Institutional Review Board (IRB) and
VA Research and Development (R&D) approval; having
a credentialed individual willing to serve as the site’sPI;
and having at least five consented physician participants
at time of randomization. We stratified these 12 study
sites on the following characteristics expected apriori
to be associated with responses to financial incentives
and the study outcomes of interest: teaching status, geo-
graphi c location, participati on in the ALLHAT study [4]
(a very large trial of various medications used to treat
hypertension in both VA and non-VA settings that
included intensive education regarding hypertension
control and use of evidence-based hypertension treat-
ment at participating sites), and the degree of clinic geo-
graphic proximity within the primary care setting at
each study site. We identified a hospital as a teaching
facility if it was listed in the Association of American
Medical College’s (AAMC) Council of Teaching Hospi-
tals (COTH) directory or if the American Me dical Asso-
ciation’ s (AMA) Fellowship and Residency Electronic
Interactive Database (FREIDA) listed the VA facility as
having a ‘major’ affiliation with a medical school. To
determine geographic region, we used US Census
Bureau information to identify the corresponding Cen-
sus Division for each site. Stu dy site investigators pro-
vided clin ic layout informatio n, an d we designa ted sites
as being integrated if the layout was amenable to group
cohesion (e.g.,theprimarycareclinicofficeswere
located on the same floor at the study site).
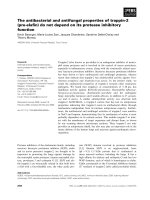
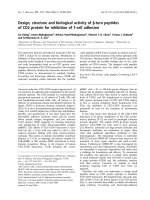
We randomized at the cluster (facility) level. To
ensure that facilities of the same type would not be con-
centrated in the same arm, we employe d the following
constraints: all non-teaching facilities could n ot be in
the same arm; all non-ALLHAT sites could not be in
the same study arm; no arm could have two sites from
the same geographic location; and at least two sites per
arm had to meet the criteria for geographic integration
(Figure 1). Using SAS version 9.1.3 (SAS Institute Inc,
Cary, NC), a data analyst on t he study tea m who was
not involved in the processes of site selection or sub ject
recruitment assigned a uniform random number to each
of the possible allocations and selected the allocation
sequence with the highest random number. Table 1 lists
the characteristics of the study sites.
Power and sample size
The anticipated effect sizes were based upon a systema-
tic review of financial incentives in healthcare [9]. In
that review, the range of increases in performance using
physician-level incentives was 5.9% to 25.3%, most of
which were for preventive services such as immuniza-
tions. Because this study assesses treatment of a chronic
disease requiring multiple types of interventions (i.e.,
medications, counseling, monitoring, lifestyle modifica-
tion), rather than a singl e immunization, the increase in
performance is anticipated to be somewhat less than
those trials at the high end of this range.
The sample size calculation must take into account
several factors. Firs t, this is a cluster design, randomized
at the facility level. Second, there is a measurement
Petersen et al. Implementation Science 2011, 6:114
/>Page 3 of 12
error associated with estimating each physician’s propor-
tion,becausewecanonlysampleafinitenumberof
patients per physician. Finally, there must be a correc-
tion for multiple comparisons because we are testing
two effects and an interaction. The sample size compu-
tation uses the non-central t-distribution and is based
on a SAS
®
program from Donner and Klar [18]. An
iterative solution is required because the number of
degrees of freedom depends on the s ample size. The
variance in measurements is the sum of the variance
between hospitals, the remaining variation between phy-
sicians and the error variance of the measurement.
Physician Incentive
Audit/Feedback
3 hospitals
Physician
participants*
Group Incentive
Audit/Feedback
3 hospitals
Physician participants
Non-
physician
participants†
Physician and Group
Incentives
Audit/Feedback
3 hospitals
Physician participants
Non-physician
participants
No incentive
Audit/Feedback
3 hospitals
Physician participants
12 VA hospitals randomized to
1 of the 4 study arms
Randomization constrained by
:
Hospital teaching status
Geographic location
ALLHAT study site
Primary care geographic integration
Figure 1 Randomizat ion schematic. ALLH AT = Antihypertensive and Lipid-Lowering Treatment to Prevent Heart Attack Trial; VA = Veterans
Administration. *Enrolled up to seven primary care physicians at each study site. †Enrolled up to 15 non-physician participants (e.g., nurses and
pharmacists) at each study site.
Table 1 Study site characteristics
VA hospital City, State Teaching
facility*
US Census
Division
ALLHAT study
site
Primary care geographic
integration†
VA Boston HCS Boston, MA X New England X
Providence VAMC Providence, RI X New England X X
VA Connecticut HCS Newington, CT New England X
Charlie Norwood VAMC Augusta, GA X South Atlantic X X
Ralph H. Johnson VAMC Charleston, SC X South Atlantic X X
Birmingham VAMC Birmingham, AL X E. South Central X
Aleda E. Lutz VAMC Saginaw, MI E. North Central
John D. Dingell VAMC Detroit, MI X E. North Central X X
G.V. (Sonny) Montgomery
VAMC
Jackson, MS X E. South Central X
Michael E. DeBakey VAMC Houston, TX X W. South Central X
Oklahoma City VAMC Oklahoma City,
OK
X W. South Central X X
Minneapolis VAMC Minneapolis, MN X W. North Central X
ALLHAT = Antihypertensive and Lipid-Lowering Tr eatment to Prevent Heart Attack Trial; HCS = healthcare system; US = United States;
VA = Veterans Administration; VAMC = Veterans Affairs Medical Center
*Designated as a teaching facility if the facility was either listed in the Association of American Medical College’s (AAMC) Council of Teaching Hospitals (COTH)
directory or if the American Medical Association’s (AMA) Fellowship and Residency Electronic Interactive Database (FREIDA) database listed the VA facility as
having a ‘major’ affiliation with a medical school.
†Designated as geographically integrated if the primary care clinic layout was amenable to group cohesion (e.g., the primary care clinic offices located on the
same floor at the study site).
Petersen et al. Implementation Science 2011, 6:114
/>Page 4 of 12
Estimates of the variance between hospitals and the var-
iance between physicians were obtained from pilot data.
The error v ariance of measurement of the phys ician’ s
proportion was calculated from the binomial distribu-
tion. Using these data, we estimated values of the intra-
class correlation of 0.39 for appropriate medication and
0.14 for BP control.
We provide power calculations for the process and
outcome measures. We calculated effect sizes for various
values of the difference in percentage use of appropriate
medication and BP control we could detect b etween the
study arms with 80% power using a two-sided t-test
with 95% significanc e. Greater increases in power result
from increasing the number of clusters than by increas-
ing the number of cases within clusters [18]. However,
it is much more difficult and costly to recruit more hos-
pitals. We c hose to use three hospitals per study arm
with five physicians per hos pital and 40 patient charts
per physician. We determined that we could detect a
difference of 1 7 percentage points between the mean
proportions of appropriate medications in the arms, for
an effect size of 1.59. Similarly, for BP control, we deter-
mined we could detect a differenc e of 15 percentage
points between the mean proportions in the study arms
for an effect size of 1.30.
We adjusted the sample size to account for anticipated
physician participant attrition. Using VA physician
workforc e planning data, we estimated 5.8% would leave
VA employment during the study. We adjusted our
initial sample size, five physicians per site, to seven per
site to account for attrition using the formula proposed
by Lachin [19], defined as 1/(1-R)
2
where R is the drop-
out rate.
Baseline characteristics of study participants
Primary care physicians who worked at le ast 0.6 f ull-
time equivalents (approximately three days per week
related to clinical activities) or had a panel size of at
least 500 patients were eligible to participate. Research
assistants on the Houston coordinating center study
team obtained informed consent from at least five eligi-
ble participants (see Power and sample size section) at
each study s ite prior to randomization. We sought to
avoid coercion by informing the individuals that partici-
pation was strictly voluntary, that their decision to parti-
cipate would not impact their employment stat us, and
that their supervisors and other hospital officials would
not have access to their performance data. Following
randomization of study sites to study arms, we contin-
ued to consent eligible physician participants as neces-
sary to meet our recruitme nt goal of seven physicians
per site (see Power and sample size section). We
enrolled a total of 83 physicians from 12 VA hospitals.
At two sites, more than seven eligib le physicians
consented for the study, so we randomly chose seven
among those who consented.
All enrolled physicians in a hospital were placed in the
same study arm. At the six study sites randomized to
the group-level incentive, the physicians invited up to
15 non-physician colleagues, either other clinicians (e.g.,
nurses and pharmacists) or administrative support staff
(e.g., clerks) or both, to participate. Research assistants
on the Houston coordinating center study team
obtained informed consent from 42 non-physician parti-
cipants. Table 2 lists the demographic characteristics of
the physician and non-physician primary care personnel
who were enrolled at the start of the intervention
period.
Interventions
Provider education
Between February and April 2008, we provided all parti-
cipants w ith the current JNC 7 h ypertension guidelines
during live education al webinars presented by a cardiol-
ogist and an internist. At the sessions, participants
learned their study arm assignment. Participants in the
intervention arms received information about the mag-
nitude and criteria for the incentives.
Audit and feedback
All participants (including the control group) received
an audit and feedback report via a secure, password-pro-
tected study website following the end of each of five
data collection periods, approximately four months
apart. Reports were designed to contain features, which
in previous research had improved the effectiveness of
feedback in healthcare settings [20,21]. Reports included
data reflecting individual and group scores, earnings for
the study period, total earnings to date, and future per-
formance goals. Each time we posted the feedback
report for a particular period to the website, we emailed
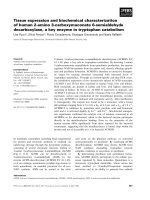
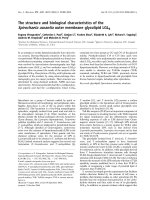
study participants to announce its availability. Figure 2
shows t he layout of the audit and feedback report for a
physician participant in the combined incentive arm.
Financial incentives
The f inancial incentive intervention phase of the study
started in April 2008 and consisted of disbursements of
incentive payments earned over each of five perfor-
mance periods. For each performance period, trained
chart abstractors extracted relevant data from the VA
electronic medical records of 40 randomly selected
patients in each physician’s panel who met eligibility cri-
teria. Only those patients with hypertension who had a
face-to-face healthcare encounter where hypertension
could be addressed during the performance interval
were eligible for inclusion in the sampl ing frame. For
the first performance period, we examined a four-month
period prior to the start of the incentive intervention
phase to assess participants’ baseline performance. We
Petersen et al. Implementation Science 2011, 6:114
/>Page 5 of 12
anchored performance periods two to five from the start
of the incentive intervention phase. Incentive payments
arrived in participants’ VA paychecks approximately
every four months and typically followed the posting of
the feedback report for that performance period. After
each data collection period, we notified participants via
e-mail the date of the paycheck i n which the payment
was to appear.
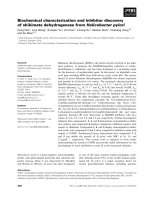
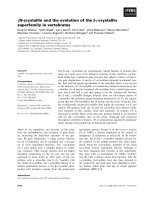
Study outcomes
We rewarded participants for delivering guideline-concor-
dant care for management of hypertension. Incentive earn-
ings for each four-month performance period were based
on the proportion of the physician ’s sampled patients
meeting either or both performance measures: receiving
guideline-recommended antihypertensive medications;
and achieving the guideline-recommended BP threshold
OR having an appropriate response to uncontrolled BP
(Figure 3). According to the guideline in place at the time
of the study, thiazide diuretics should be used either alone
or in combination with other classes of medications to
control BP in most patients with uncomplicated hyperten-
sion. In patients with compelling indications for the use of
other antihypertensive drug classes (e.g., diabetes mellitus
or renal disease), medications appropriate for those high-
risk conditions should be used as initial therapy for con-
trolling BP [2]. JNC 7 guidelines recommend treating BP
to a goal of < 140/90 mm Hg in most patients. In those
with hypertension and co-existing diabetes mellitus and/or
renal disease, the goal was < 130/80 mm Hg. Examples of
appropriate responses to uncontrolled BP included
increasing the dosage of a guideline-recommended antihy-
pertensive medication or recommending a lifestyle modifi-
cation, such as the Dietary Approaches to Stop
Hypertension (DASH) eat ing plan to a patient with Stage
1 hypertension.
Incentive payment structure
ThefiveparticipatingVANetworks’ contributions to
the incentive fund totalled $250,000. Based on this
amount, we then simulated study results using pilot
data and estimat ed rates of improvement to determine
the greatest per-outcome incentive that we could pro-
vide per physician. The results indicated a per-patient
maximum amount of $18.20, one-half from use of
guideline-recommended medications and one-half from
either BP control or appropriate response to uncon-
trolled BP.
Table 2 Characteristics of physicians and non-physician primary care personnel enrolled at the start of the
intervention
Characteristic* Primary care physicians (n = 83) Non-physician personnel
(n = 42)
Male, n (%) 45 (54.2) 6 (14.3)
Age at start of study, mean (SD), y 46.5 (7.8) 48.7 (8.7)
Race/ethnicity, n (%)
White 35 (42.2) 24 (57.1)
Black 6 (7.2) 12 (28.6)
Asian 34 (41.0) 3 (7.1)
Hispanic 4 (4.8) 1 (2.4)
Other† 3 (3.6) 2 (4.8)
Unknown‡ 1 (1.2) 0
Board certified, n (%) 76 (91.6) N/A
Primary specialty internal medicine, n (%) 71 (85.5) N/A
Trained in a subspecialty/secondary specialty, n (%) 18 (21.7) N/A
Years practicing since residency completion, mean (SD) 12.6 (7.8) N/A
Proportion of professional time spent delivering patient care, mean (SD) 0.89 (0.13) 0.86 (0.20)
Role in patient care delivery, n (%) N/A
Licensed practical nurse N/A 10 (23.8)
Medical support assistant N/A 3 (7.1)
Pharmacist N/A 2 (4.8)
Physician assistant or nurse practitioner N/A 5 (11.9)
Registered nurse N/A 16 (38.1)
Registered nurse case manager or care coordinator N/A 6 (14.3)
*Data collected as part of the participant demographic questionnaire conducted following the informed consent discussion.
†Other includes participants that described themselves as Native Hawaiian/Other Pacific Islander, American Indian/Alaska Native, or belonging to more than one
race/ethnicity group.
‡Participant declined to answer.
Petersen et al. Implementation Science 2011, 6:114
/>Page 6 of 12
Table 3 describes the intervention components and
estimated incentive payouts for the study arms. For the
physician-level incentive arm, each physician’ sreward
reflected the number of successful outcomes achieved
among the 40 randomly chosen patients. The group
incentive earnings were based on the aggregated perfor-
mance of the physicians. We allowed participants at the
six group sites to choose how to allocate the group
Your Scores This Period
:
You
Your group
# of pts
(%)
You
earned
# of pts
(%)
Group
earned
Number of eligible hypertensive patients
randomly sampled from your panel/group
40
280
Number of patients who received guideline-
recommended BP medications
36
(90%)
$327.60
201
(72%)
$1,829.10
Congratulations! You are among the top 10% of performers across the entire study
for this period.
Number of patients with
controlled BP
28
(70%)
$254.80
198
(71%)
$1,801.80
Number of patients with
uncontrolled B
P…
12
(30%)
82
(29%)
who received an appropriate clinical
response to uncontrolled BP this period
5
(42%)
$45.50
40
(49%)
$364.00
Total Earnings:
This period - Congratulations! Good work!
$627.90
$3,994.90
Overall
$1,847.30
$11,757.20
Your Goals for the Upcoming Period:
You
Your group
% of
pts.
% of
pts.
Percent of eligible hypertensive patients in your panel/group…
… who will receive guideline-
recommended BP medications
90%
85%
For the next period, your goal is to maintain or exceed your current performance
level. Keep up the great work!
… with controlled BP
85%
85%
… with uncontrolled BP who will receive
an appropriate clinical response to
uncontrolled BP
83%
83%
If you and your group meet or exceed your
goals next peri
od, you and your group
could
earn at least:
$664.30
$3,985.80
Total earnings that you will receive this period: $862.89
Figure 2 Feedback report #3 for a physician participant in the individual and group incentives study arm. BP = blood pressure.
Petersen et al. Implementation Science 2011, 6:114
/>Page 7 of 12
earnings (e.g., divide earnings among themselves as per-
sonal income or use them to provide p atient education
materials or other supplies for the c linic). Each group
chose to divide the earnings evenly amongst themselves.
For the combined incentive arm, the physicians received
a payment that included their individual performance
earnings as well as their share of the group’s aggregated
performance reward. Non-physician participants
received their share of the group ’s aggregated perfor-
mance reward.
Data collection
We developed a data abstract ion tool and electronically
collected data on the physicians’ patients from the VA
Computerized Patient Records System (CPRS). Abstrac-
tors at the Houston coordinating center collected data
on patient demographics, vital signs, diabetes mellitus,
car diovascular condi tions, renal conditions, ter minal ill-
ness, and other relevant co-morbidities, laboratory
values and medications, including dosages, allergies,
contraindications, and patient refusals for all study sites.
Additionally, we collected lifestyle modifications recom-
mended by the provider or other medical staff members
and information on study outcomes addressed at follow-
up visits within a g iven timeframe. We collected hemo-
globin A1c (HbA1c) levels in patients with diabetes,
low-density lipoprotein cholesterol (LDL-C) levels in
patients with hyperlipidemia, and colorectal cancer
Was the patient receiving JNC 7
guideline-recommended
antihypertensive medications?
Blood Pressure
Management
Medication
Management
YES
NO
Did the provider
appropriately
respond† to the
patient’s uncontrolled
blood pressure?
Receives
$9.10
payment
No
payment
Was the patient’s blood
pressure controlled?*
Receives
$9.10
payment
Eligible hypertensive patient
YES
NO
Receives
$9.10
payment
No
payment
YES
NO
Figure 3 Study outcomes assessed to determine incentive payment. JNC 7 = Seventh Report of the Joint National Committee on
Prevention, Detection, Evaluation, and Treatment of High Blood Pressure. *Blood pressure control for patients without co-existing diabetes
defined as < 140/90 mm Hg; with co-existing diabetes < 130/80 mm Hg. †Defined as either adding new or increasing current antihypertensive
medication, prescribing lifestyle modifications, or rechecking the patient’s blood pressure within six weeks to determine if blood pressure
controlled; if not controlled, responding with at least one of above actions.
Petersen et al. Implementation Science 2011, 6:114
/>Page 8 of 12
screening procedures among eligible patients to assess
unintended consequences, i.e., neglect of these condi-
tions o r missed screening opportunities, that may have
resulted from the intervention’ s focus on hypertension
care.
After a training session, chart abstractors were
required to complete 20 practice charts with 95% agree-
ment on key data elements with all other abstractors
and the trainer. During each period of data collection,
the abstraction manager spot-checked charts for accu-
racy in abstracting key variables, addressing problem
areas with abstracters as nec essary. At the end o f each
period of data collection, we randomly selected at least
three charts from each site in order to evaluate abstrac-
ter agreement. Also, we bli nded chart abstractors to the
study’ s objectives and to study arm assignments to
ensure impartiality in the data collection process.
Interviews - team planning, pay-for-performance
perspectives, and unintended consequences of incentives
After participants received their second incentive pay-
ments and audit and feedback reports, the study team,
including an industria l/organizational psychologist,
interviewed 17 physician participants and 11 non-phy-
sician participants across the study sites to collect data
about the strategies that they used to improve hyper-
tension care, including clinic planning and team inter-
action shared mental models. Twelve physician
participants and four non-physicians also completed a
similar interview after the fourth disbursement of
incentive payments and audit and feedback reports.
These distinct interviews were intended to provide
insights on how care strat egies and planning may have
evolved over time, and the drivers behind any observed
changes.
Following the pos ting of t he participants’ final audit
and feedback reports in April 2010, we inte rviewed 28
physicians and 10 non-physician participants across the
study sites to ascertain their perspectives on financial
incentives, the interven tion’ s impact on team dynamics
and care d elivery for hypertens ion and non-related con-
ditions, and organizational changes that occurred at the
study site during the intervention period. Focusing on
similar concept domains, we also int erviewed primary
care personnel, 24 physicians and 25 non-physicians
across the s ites, who did not participate in the interven-
tion and primary care leadership at the 12 sites.
Washout period and post-washout period data collection
The four-month post-washout performance period
began 12 months following the posting of the final audit
and feedback report to the study’swebsite.Toevaluate
the persistence of the intervention, we will subsequently
collect the same data that were collected during the
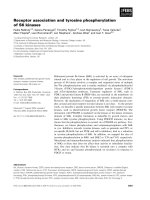
intervention. A timeline of the study’ s activities, from
physician recruitment to post-washout data collection, is
presented in Figure 4.
Data analysis
The unit of analysis will be the physician. We will per-
form a repeated measures longitudinal a nalysis using
mixed models to evaluate the effect of the intervention.
We will evaluate three different predictors for each out-
come: each incentive arm versus the control arm; indivi-
dual-level incentive arms versus arms with no individual
incentives; and group-level incentive arms versus arms
with no group incentives. Models will be developed
independently for each outcome. First, using scientifi-
cally relevant covariate s selected apriori, we will con-
struct a maximal model for each outcome as described
Table 3 Intervention components and incentive payouts
Intervention components Participants Total estimated*
incentive over entire
study period
Study Arm Audit/
feedback
report
Individual
physician
incentive
Group
incentive
Physicians Non-
physicians
Performance
evaluated
Per outcome per patient
incentive award
Individual
Physician
Group†
Physician
incentive
•• • Physician $9.10 $2681 N/A
Group
incentive
••••Physician $9.10 N/A $17206
Physician and
group
incentives
••• • •Physician $9.10 $2696 $18872
No incentives
(control)
••Physician $9.10 N/A N/A
*Estimates based on outcome rates from pilot study and projected improvement rates per period as follows: individual arm - 0.05 for process measures
(guideline-recommendation medication and appropriate response) and 0.03 for blood pressure control; group arm - 0.02 for process measures and 0.01 for blood
pressure control; combined arm - 0.06 for process measures and 0.04 for blood pressure control.
†For a group that includes seven physicians. Group incentive award determined by summing the incentive amounts earned by all seven physicians in the group.
Petersen et al. Implementation Science 2011, 6:114
/>Page 9 of 12
by Cheng et al. [22]. The maximal model provides the
flexibility to evaluate both the covariance structure and
the list of covariates for inclusion in the final model.
The relationship between each co ntinuous covariate and
the outcome will be explored to assess the need for cov-
ariate transformations. We also will determine whether
any site-to-site variation exists and include the facility
(cluster) as a random effect as necessary. We then will
perform b ackward elimination to delete variables of no
value, arriving at our final model.
Discussion
In this paper, we describ e our ratio nale, methods, and
baseline participant characteristics for a cluster-rando-
mized trial to assess the effectiveness of pay for perfor-
mance in improving h ypertension control and use of
guideline-recommended medications in the primary care
setting. The potential impact of this study is great.
Seventy-two m illion Americans have hypertension [23],
but hypertension is controlled in less than one-half of
those who carry this diagnosis [ 1]. A variety of methods,
such as audit and feedback, academic detailing, remin-
ders, guidelines, and combinations of interventions have
not succeeded in e liminating the under-treatment of
hypertension [24]. Given the track record of other inter-
ventions, the effectiveness and cost-effective ness of
financial incentives in o vercoming such barriers to
translation of research into practice must be rigorously
evaluated [25].
Other studies of the use of financial incentives f or
improving healthcare quality have suffered from a dilu-
tion of the incentive due to multiple payers or compet-
ing incentives that make it difficult to assess
effectiveness [9,26]. Relative to these situations, studying
incentives in t he VA healthcare system provides several
advantages. First, the VA is both the insurer and t he
2007
2008
2012
2011
2010
2009
Feb
Dec
Began physician recruitment
Randomization of study sites to study arms; began non-physician recruitment at group sites
Feb Began educational webinars (arm assignment provided to participants)
Apr Started intervention (financial incentives; audit and feedback)
Oct Audit and feedback report #1
Feb Audit and feedback report #2
Jun Audit and feedback report #3
Oct Audit and feedback report #4
Apr
Audit and feedback report #5; began participant debriefing interviews
May
Apr
Sep Began interviews with primary care personnel who did not participate in the
intervention and primary care leadership
Washout (12 months following
final audit and feedback report)
Sep Begin post-washout data collection (anticipated)
May Started post-washout 4-month performance period
Mar Began 1
st
round of participant interviews (hypertension care strategies, clinic planning)
Nov Began 2
nd
round of participant interviews (hypertension care strategies, clinic planning)
Figure 4 Study timeline.
Petersen et al. Implementation Science 2011, 6:114
/>Page 10 of 12
provider, so organizational responses to incentives are
easier to antic ipate and assess. Second, the VA uses a
single payment approach, rather than a diverse mix as
seen elsewhere. The VA employs salaried physicians to
care for its enrollees. The VA healthcare system consists
of 21 networks that operate on a global budget appro-
priated by Congress. Funding is distributed to the net-
works via a form of capitation in which payments are
made per veteran meeting eligibility criteria [27]. The
VA has a common national electro nic medical informa-
tion system, making the collection of common practice
data across widely disparate geo graphic sites and types
of facilities feasible. Thus, carrying out the study in the
VA allows an evaluation of the effectiveness of financial
incentives that is free from some of the limitations
encountered in other settings.
Paying more for healthca re services shown to improve
quality could have a tremendou s impact on care deliv-
ery. However, despite great potential, numerous ques-
tions are unanswered. How effective (and cost- effective)
are financial incentives for quality? Can we expect the
effect of financial incentives to persist after they are
stopped? Will important patient care activities that a re
not rewarded financially be neglected? Thus, despite
enthusiasm about the potential for aligning financial
incentives with high quality healthcare, there are a num-
ber of fundamental unanswered questions about their
optimal design, effectiveness, and implementation that
we will address in this trial [9].
While our study design has numerous strengths, we
must acknowledge some limitations. First, as part of the
VA Healthcare Personnel Enha ncement Act of 2004
(implemented in 2006) [28], the VA healthcare system
instituted a new payment system that includes perfor-
mance pay based on the accomplishment of specific
clinical quality goals and objectives which may be estab-
lished at the local, network, or national level. However,
although this program provides financial incentives for
improvements in quality of care, the spe cific measures
(i.e., hypertension control, diabetes management, color-
ectal cancer screening) for which payments are given
have not been implemented uniformly across VA facil-
ities. In addition, VA performance pay encompasses a
wide array of measures, while our incentive focuses
solely on management of hypertension, thus maximizing
the effect of our intervention. Further, by using a RCT
design, we limit the likelihood of confounding by other
concurrent quality improvement programs. Second, the
VA has an extensive system of clinical reminders (i.e.,
use of thiazide diuretics in patients with hypertension or
use of aspirin in patients with ischemic heart disease)
designed to promote t he provision of guideline-recom-
mended care. However, while the VA has implemented
a variety of quality improvement strategies, our pilot
data indicate that there remains room for further
improvement. Third, although the VA healthcare system
cares for few women patients, the subjects of this study
are physicians. There is little reason to believe that the
effect of a financial incentive to a physician would result
in different treatment of a woman or a man with hyper-
tension. Thus, findings from this study will be relatively
generalizable to bud geted systems and staff-model
health maintenance organizations (HMOs) that serve
many millions of patients, to Centers for Medicare and
Medicaid Services (CMS) with 40.5 million beneficiaries,
and indirectly applicable to other healthcare delivery
models. Finally, it is possible that there may be a ‘volun-
teer effect’ among participants. For example, physicians
with a bias tow ard use of financial incentives may have
been more likely to participate in our study. However,
we expect t hat the randomized control design of our
study will limit the effect of this potential source of bias.
In this paper, we have given a brief description o f the
rational e for the i nterventi ons being studied in this trial
of pay for performance, as well as some of the design
choices. Rigorous research designs s uch as this one are
necessary to determine whether performance-based pay-
ment arrangements result in meaningful quality
improvements. In this large cluster-RCT of pay for per-
formance, we are seeking to provide suc h evidence for
one of the most common chronic conditions affecting
US citizens.
Acknowledgements
We gratefully acknowledge the VA Network Directors who provided the
financial incentives for this study as well as the VA staff who participated.
This work is supported in part by Veteran s Affairs Health Services
Research & Development (HSR&D) Investigator-Ini tiated Research (II R) 04-
349 (PI Laura A. Petersen, MD, MPH), NIH RO1 HL079173-01 (PI Laura A.
Petersen, MD, MPH), the American Recovery and Reinvestment Act of
2010 (NHLBI 1R01HL079173-S2), and the Houston VA HSR&D Center of
Excellence HFP90-020 (PI Laura A. Pe tersen, MD, MPH). Dr . Petersen was a
recipient of the American Hear t Association Established Investigator
Award (Grant number 0540043N) and was a Robert Wood Johnson
Foundation Generalist Physician Faculty Scholar (Grant number 045444 ) at
the time that this study was planned and funded. Dr. Hysong was a
recipient of an NHLBI Investigator Research Supplement to Promote
Diversity in Health-Related Research (1R01 HL079173-S1) during the early
stages of the study and is currently a VA HSR&D Career Development
Awardee (CDA 07-0181). Dr. Profit ’s contribution is suppo rted in pa rt by
the Eunice Kennedy Shriver National Institute of Child Health and Human
Development #1 K23 HD056298-01 (PI: J ochen Prof it, MD, MPH). Dr.
Conrad is an awardee of the Robert Wood Johnson Foundation Health
Care Financing and Organization Program (Gran t number 63214 ). Dr.
Dudley is a Robert Wood Johnson Investigator Awardee in Health Policy.
The views expr essed ar e solely of the authors, and do not necessarily
represent those of the VA.
Author details
1
Health Policy and Quality Program, Michael E. DeBakey VA Medical Center
Health Services Research and Development Center of Excellence, and
Section for Health Services Research, Department of Medicine, Baylor
College of Medicine, Houston, TX, USA.
2
University of Washington,
Magnuson Health Sciences Center, Seattle, WA, USA.
3
Department of Health
Services, Institute for Health Policy Studies, University of California, San
Petersen et al. Implementation Science 2011, 6:114
/>Page 11 of 12
Francisco, San Francisco, CA, USA.
4
Under Secretary for Health, Department
of Veterans Affairs, Washington, D.C., USA.
Authors’ contributions
LAP conceived of the study, obtained funding, supervised the research team,
and drafted the manuscript. All authors participated in designing the study.
TU, KS, KP, MZL, and LDW helped to draft the manuscript. SJH, JP, DC, and
RAD provided critical revision of the manuscript for important intellectual
content. All authors approved the final version of the manuscript.
Competing interests
The authors declare that they have no competing interests.
Received: 29 July 2011 Accepted: 3 October 2011
Published: 3 October 2011
References
1. Wang TJ, Vasan RS: Epidemiology of uncontrolled hypertension in the
United States. Circulation 2005, 112:1651-1662.
2. Chobanian AV, Bakris GL, Black HR, Cushman WC, Green LA, Izzo JL Jr,
Jones DW, Materson BJ, Oparil S, Wright JT Jr, Roccella EJ, National Heart
and Blood Institute Joint National Committee on Prevention, and Treatment
of High Blood Pressure; National High Blood Pressure Education Program
Coordinating Committee: The Seventh Report of the Joint National
Committee on Prevention, Detection, Evaluation, and Treatment of High
Blood Pressure: the JNC 7 report. JAMA 2003, 289:2560-2572.
3. McGlynn EA, Asch SM, Adams J, Keesey J, Hicks J, DeCristofaro A, Kerr EA:
The quality of health care delivered to adults in the United States. N
Engl J Med 2003, 348:2635-2645.
4. The ALLHAT Officers and Coordinators for the ALLHAT Collaborative
Research Group: Major cardiovascular events in hypertensive patients
randomized to doxazosin vs chlorthalidone: the Antihypertensive and
Lipid-Lowering Treatment to Prevent Heart Attack Trial (ALLHAT). JAMA
2000, 283:1967-1975.
5. Cabana MD, Rand CS, Powe NR, Wu AW, Wilson MH, Abboud PA, Rubin HR:
Why don’t physicians follow clinical practice guidelines? A framework
for improvement. JAMA 1999, 282:1458-1465.
6. Berwick DM, DeParle NA, Eddy DM, Ellwood PM, Enthoven AC,
Halvorson GC, Kizer KW, McGlynn EA, Reinhardt UE, Reischauer RD,
Roper WL, Rowe JW, Schaeffer LD, Wennberg JE, Wilensky GR: Paying for
performance: Medicare should lead. Health Aff (Millwood) 2003, 22:8-10.
7. Doran T, Fullwood C, Gravelle H, Reeves D, Kontopantelis E, Hiroeh U,
Roland M: Pay-for-performance programs in family practices in the
United Kingdom. N Engl J Med 2006, 355:375-384.
8. Lindenauer PK, Remus D, Roman S, Rothberg MB, Benjamin EM, Ma A,
Bratzler DW: Public reporting and pay for performance in hospital quality
improvement. N Engl J Med 2007, 356:486-496.
9. Petersen LA, Woodard LD, Urech T, Daw C, Sookanan S: Does pay-for-
performance improve the quality of health care? Ann Intern Med 2006,
145:265-272.
10. Conrad DA, Perry L: Quality-based financial incentives in health care: Can
we improve quality by paying for it? Annu Rev Public Health 2009,
30:357-371.
11. Dudley RA: Pay-for-performance research: how to learn what clinicians
and policy makers need to know. JAMA 2005, 294:1821-1823.
12. Donner A, Klar N: Design and Analysis of Cluster Randomization Trials in
Health Research London: Arnold; 2000.
13. Kuhn M: Quality in primary care: economic approaches to analyzing quality-
related physician behavior London: Office of Health Economics Research;
2003, 92.
14. Bodenheimer T, Wagner EH, Grumbach K: Improving primary care for
patients with chronic illness. JAMA 2002, 288
:1775-1779.
15. Bodenheimer T, Wagner EH, Grumbach K: Improving primary care for
patients with chronic illness: the chronic care model, Part 2. JAMA 2002,
288:1909-1914.
16. Wagner EH, Austin BT, Davis C, Hindmarsh M, Schaefer J, Bonomi A:
Improving chronic illness care: translating evidence into action. Health
Aff (Millwood) 2001, 20:64-78.
17. Petersen LA, Woodard LD, Henderson LM, Urech TH, Pietz K: Will
hypertension performance measures used for pay-for-performance
programs penalize those who care for medically complex patients?
Circulation 2009, 119:2978-85.
18. Donner A, Klar N: Statistical considerations in the design and analysis of
community intervention trials. J Clin Epidemiol 1996, 49:435-439.
19. Lachin JM: Introduction to sample size determination and power analysis
for clinical trials. Control Clin Trials 1981, 2:93-113.
20. Kluger AN, DeNisi A: The effects of feedback interventions on
performance: a historical review, a meta-analysis, and a preliminary
feedback intervention theory. Psychological Bulletin 1996, 119:254-284.
21. Hysong SJ: Meta-analysis: audit and feedback features impact
effectiveness on care quality. Med Care 2009, 47:356-363.
22. Cheng J, Edwards LJ, Maldonado-Molina MM, Komro KA, Muller KE: Real
longitudinal data analysis for real people: building a good enough
mixed model. Stat Med 2010, 29:504-520.
23. Rosamond W, Flegal K, Friday G, Furie K, Go A, Greenlund K, Haase N,
Ho M, Howard V, Kissela B, Kittner S, Lloyd-Jones D, McDermott M, Meigs J,
Moy C, Nichol G, O’Donnell CJ, Roger V, Rumsfeld J, Sorlie P, Steinberger J,
Thom T, Wasserthiel-Smoller S, Hong Y, American Heart Association
Statistics Committee and Stroke Statistics Subcommittee: Heart disease and
stroke statistics–2007 update: a report from the American Heart
Association Statistics Committee and Stroke Statistics Subcommittee.
Circulation 2007, 115:e69-171.
24. Grimshaw JM, Thomas RE, MacLennan G, Fraser C, Ramsay CR, Vale L,
Whitty P, Eccles MP, Matowe L, Shirran L, Wensing M, Dijkstra R,
Donaldson C: Effectiveness and efficiency of guideline dissemination and
implementation strategies. Health Technol Assess 2004, 8:iii-iv, 1-72.
25. Epstein AM, Lee TH, Hamel MB: Paying physicians for high-quality care. N
Engl J Med 2004, 350:406-410.
26. Frolich A, Talavera JA, Broadhead P, Dudley RA: A behavioral model of
clinician responses to incentives to improve quality. Health Policy 2007,
80:179-193.
27. Petersen LA, Urech TH, Byrne MM, Pietz K: Do financial incentives in a
globally budgeted healthcare payment system produce changes in the
way patients are categorized? A five-year study. Am J Manag Care 2007,
13
:513-522.
28. Department of Veterans Affairs Health Care Personnel Enhancement Act
of 2004. Public Law 108-445 [ />getdoc.cgi?dbname=108_cong_public_laws&docid=f:publ445.108].
doi:10.1186/1748-5908-6-114
Cite this article as: Petersen et al.: Design, rationale, and baseline
characteristics of a cluster randomized controlled trial of pay for
performance for hypertension treatment: study protocol. Implementation
Science 2011 6 :114.
Submit your next manuscript to BioMed Central
and take full advantage of:
• Convenient online submission
• Thorough peer review
• No space constraints or color figure charges
• Immediate publication on acceptance
• Inclusion in PubMed, CAS, Scopus and Google Scholar
• Research which is freely available for redistribution
Submit your manuscript at
www.biomedcentral.com/submit
Petersen et al. Implementation Science 2011, 6:114
/>Page 12 of 12