Carbon Materials for Advanced Technologies Part 12 ppsx
Bạn đang xem bản rút gọn của tài liệu. Xem và tải ngay bản đầy đủ của tài liệu tại đây (600.54 KB, 35 trang )
3
65
'Ooo
-
6000
5000
E
4000
8
3000
2000
1000
OXY
samples heated
to
0
10
15
20
25
30
35
SCATTERING
ANGLE
(deg.)
Fig.
11.
Powder X-ray diffraction pattern for the
(002)
peak of samples made from
Phenolic resin (OXY) as indicated. The data sets have been offset sequentially by
0,
500,
1000
and
1900
counts for clarity.
8000
6000
E
4000
v
2000
n
-
10
15
20
25
30
35
SCATTERING
ANGLE
(deg.)
Fig.
12.
Powder X-ray diffraction pattern for
the
002
peak
of
samples
made
from
epoxy
novolac resin
(ENR)
as indicated.
The
data
sets
have been offset sequentially by
0,
500,
1900
and
3200
counts for clarity.
3
66
indicates that the samples contain significant fractions of single layer graphene
sheets, which are stacked more
or
less like a “house of cards”, containing
significant microporosity. Again, the (002) peak of these materials changes
little
as the temperature
is
increased. Figure
13
shows the (100) and
(004)
peak
regions for samples made from each precursor heated to 1000
OC.
The
CR01000,
KSlOOO and PVClOOO samples show some evidence for
an
(004)
peak near 52O while the other samples do not. This is consistent with the
behavior of the
(002)
peak for these samples. The
(100)
peaks do not differ
greatly, indicating lateral layer extents of order
18
to
37~4
for
all
samples (see
Table
2).
Structurally,
the
materials are grouped into
two
main classes, those
(soft
carbons) with predominantly stacked layers
(CRO,
KS and PVC) and those
(hard carbons) which have significant amounts of single layer sheets (OXY and
ENR).
All the samples show similar values of
La
when heated to a given
temperature.
Figure 14 shows the
SAXS
measurements on the
soft
carbon samples
CR0700
and
CR01000,
and
on the hard carbon samples OXY700 and OXYlOOO. All
these samples were measured under the same conditions with about the same
sample mass. Based on Guinier’s formula, materials with large pores have
small angle scattering intensities which fall off rapidly with k
or
with scattering
angle, while those with small pores show a slower decline. Materials
with
significant porosity have higher
SAXS
intensities, while those with less porosity
show
lower intensities.
Figure
14
shows that the hard carbons
OXY700
and OXY1000 show evidence
for significant microporosity, while the
CR0700
and CROlOOO samples contain
substantially less microporosity. The high counts at very low angle
(<
1.5”) in
Fig. 14 are from larger pores which are typically larger
than
30A.
We found
that the hard carbon samples all have significant microporosity, but that the
soft
carbon samples do not. This result
is
consistent with the results of powder
X-
ray dlffraction.
In Table
2,
the
WC
atomic ratio decreases monotonically for each of the
samples
as
they are heated and all the samples approach pure carbon
as
the
heating temperature
is
increased. Figure 15 shows the
WC
atomic ratio plotted
versus heat-treatment temperature for most samples
in
Table
2.
Table
2
also
gives the product yield for
all
the samples
as
a percentage
of
the
starting weight
of the precursor. The yields from the
CRO,
KS
and OXY series are large,
presumably because these precursors have large aromatic content and less
heteroatoms.
ENR
shows intermediate behavior; it has less aromatic content
and
more heteroatoms.
PVC
shows the lowest yield of
all
presumably because
it
has no
initial
aromatic content.
367
ENR100(
n
I
I
I
"
35 40 45
'
50
5
SCATTERING ANGLE
Fig.
13.
Powder X-ray diffraction pattern for the
(100)
peak of all samples made at
1000°C
as
indicated. The data sets have been offset sequentially by
0,
400,
500,
and
1200
counts for clarity.
mnn,
-
.
.
.
.
.
.
.
.
.
.
.
.
.
-"""I
::
(
0
CR0700
1
0
CROlOOO
+
OXY700
0
oxYlooo
-01234567
SCATTERING ANGLE
Fig.
14.
The small angle scattering intensity versus scattering angle for samples
CR0700,
CROl
OOO,OXY700
and OXY
1000.
368
0.5
.I.I.I.I~I'
0
il
0.4
-
.A
*
!$
Q
x
0.1
-
i+
F]
1
0
OXY
SUG
'
0.3
-
h
g
0.2
-
id
fit
0.0'
.
'
'
'
'
,
,"h;
369
2*5*
2.0
0
200 400
600
800
1000
CAPACITY
(mAh/g)
Fig.
16.
Voltage versus capacity for the second
cycle of
the
CRO
pitch
heated at different
temperatures as indicated.
Figures 17 and 18 show the second cycles for the
KS
pitch samples and the
PVC
samples respectively. These materials show a trend with heating temperature
which
is
almost identical to the CRO pitch samples. Again, the large capacity
and hysteresis
in
the voltage profiles are eliminated as
the
samples are heated
above 700°C, even though little structural change to the samples occurs. On the
other hand, the hydrogen content of the samples drops dramatically over this
temperature range. The OXY and
ENR
samples (hard carbons) show behavior
sirmlar to the
CRO,
MS
and PVC samples (soft carbons) when their
WC
ratio
is
large, but strllungly different behavior upon heating above 800°C.
Figures 19 and
20
show the second cycles for the OXY samples and the
ENR
samples respectively. The results for the OXYIOOO, ENR900 and ENRlOOO
samples are more striking. These samples will be discussed in section
5.
Figures 19 and
20
show a long low voltage plateau
on
both discharge and
charge caused by a reversible insertion process. These
two
Figs also show how
the voltage profile changes with heating temperature. At 700°C, where the
H/C
ratio is large, the hard carbon samples show basically an identical capacity and
voltage profile to the soft carbon samples, even though these materials have
very different structures. However, after further heating, the hard carbon
samples evolve into high capacity, low hysteresis materials. We believe that
when substantial hydrogen is present it dominates the reaction with hthium.
But, when the hydrogen is removed the structural differences between the
samples play an important role.
370
I I
I
0
200
400
600
800
CAPACITY
(mAh/g)
Fig.
17.
Voltage versus capacity for the second cycle of the
KS
pitch samples heated at
different temperatures
as
indicated.
0
200
400
600
800
1000
CAPACITY
(mAh/g)
Fig.
18. Voltage versus capacity for the second cycle of the samples made from PVC
heated at different temperatures as indicated.
371
OXY700
1.5
0
200
400
600
800
CAPACITY
(mAh/g)
Fig.
19.
Voltage versus capacity for the second cycle
of
the samples made from
OXY
resin heated at different temperatures as indicated.
2.0
1.5
E
2
w
13
1.0
0
0.5
GI
+
0.0
1
J
0
200
400
600
800
CAPACITY
(mAh/g)
Fig.
20.
Voltage-capacity profiles for the second cycles of lithiudcarbon cells made
from
ENR
resin heated at different temperatures as indicated.
4.3
Effect
of
hydrogen on the insertion
of
lithium
Figure
21
compares the voltage-capacity profiles for the second cycle of
lithdcarbon electrochemical cells made from
OXY,
a representatwe hard
carbon, and those for samples made from
CRO,
a representative
soft
carbon.
372
Significantly, there was a shortening of the one volt plateau during charge as the
samples are heated above 700°C for both the soft and hard carbons. That is, the
portion
of
the voltage profile which displays hysteresis
is
removed as the
samples are heated above 700°C.
The capacity of the one volt plateau (taken
between 0.7 volts and
1.5
volts for all samples) is well correlated to the
hydrogen to carbon atomic ratio of the samples as shown in Fig. 22. Changing
the voltage limits of the one volt plateau to other values (e.g.
0.5
volts and 1.5
volts) does not significantly affect the correlation
in
Fig. 22. The solid line in
Fig. 22 is expected if each lithium atom can bind near a hydrogen atom
in
the
host and if a hydrogen-free carbon heated to higher than 1000°C does not have a
one volt plateau. Mabuchi et al.'s data [29] have also been included and fit the
trend well. The hydrogen contained in carbonaceous materials heated at low
temperatures (below 800°C) is clearly important.
0
200
400
600
800
1000
CAPACITY (mAh/g)
Fig.
21.
Voltage-capacity profiles for the second cycles
of
lithiudcaxbon cells made
from
a)
OXY
resin and
b)
CRO pitch heated at
different
temperatures
as
indicated.
Hydrogen can affect lithium insertion in carbons.
As
an example, charge
transfer from alkalis to hydrogen in carbons has been observed in ternary
graphite-alkali-hydrogen materials [36]. In
our
hydrogen-containing samples, it
is
believed that the lithium atoms may bind on hydrogen-termmated edges of
hexagonal carbon fragments, with local geometries analogous to the
organolithium molecule C2H,Li2 [37].
If
this is true, then the capacity for the
373
n
blD
$
700
E
-
600
5
4
500
4
4
400
PI
300
R
0
200
*
u
rl
E
100
1
+
$*
30
2
0.0
0.1
0.2
1
A
+
CROpitch
0
KS
pitch
0.3
0.4
0.5
u
WC
ATOMIC
Fig.
22. The capacity
of
the one volt plateau measured during the second cycle
of
several
series
of
samples versus the
H/C
atomic ratio
in
the samples. The solid line suggests
that
each lithium atom binds quasi-reversibly to one hydrogen atom.
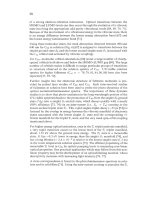
insertion of lithium should strongly depend on the hydrogen content of the
carbon materials as has been experimentally shown above. If the inserted
lithium binds to a carbon atom which also binds a hydrogen atom, a
corresponding change to the carbon-carbon bond from sp2 to sp3 occurs
[37].
That is, the insertion and removal of the lithium atoms in carbons involves
changes to the bonding in the host as shown schematically in Fig.
23
(obtained
from reference
37).
Bonding changes in the host have been previously shown to
cause hysteresis in such electrochemical measurements. For example, hysteresis
in lithium electrochemical cells was observed when
Mo-S
bonds in LiMoS,
were broken due to the formation of Li-S bonds upon further insertion of
lithium
[38].
We do not believe that oxygen and nitrogen in the samples are important. When
any precursor is heated near
700°C,
the heteroatoms ldce oxygen and nitrogen
are predominantly eliminated.
Here we also point out that
PVC
contains no
nitrogen
or
oxygen, nor does its pyrolyzed product. Since pyrolyzed
PVC
shows the same behavior in Fig. 22
as
the other samples, we believe the effects
of oxygen and nitrogen in these materials to be negligible. The presence
of
hydrogen is the only common factor in all these samples with a variety of
microstructures prepared from a variety of precursors.
374
Although the hydrogen-containing carbons show higher capacities, they all
display a large hysteresis with lithium insertion in these carbons near zero volts
and removal at one volt. The hysteresis will affect the efficiency of a real
lithium-ion cell during charge and discharge. For example, the cell may charge
at four volts and discharge at three volts. The origin of the hysteresis has been
explained in ref.
10
and will not be discussed here.
The cycle life of the hydrogen-containing samples also appears to be limited as
shown in ref.
8.
This is unacceptable for a practical application. The capacity
loss is mostly due
to
the elimination of the excess capacity which exhibits
hysteresis. Since this portion of the capacity appears related to the incorporated
hydrogen, its elimination with cycling may not be unexpected. We do not
understand this point fully yet, and further work would appear to be warranted.
Fig.
23.
When lithium inserts in hydrogen-containing carbon, some lithium atoms bind
on the hydrogen-terminated edges of hexagonal carbon fragments. This causes
a
change
from
sp’
to
sp’
bonding
[37].
375
5
Microporous Carbons
from
Pyrolyzed Hard-Carbon Precursors
There have been a number of reports of carbons with voltage profiles similar to
that of the region 3 material, microporous hard carbon, shown in Fig. 2. Omaru
et al.
[39], using pyrolyzed polyfurfuryl alchohol, Takahashi
et al.
[40], using
unspecified precursors, Sonobe
et al.
[41], using pyrolyzed petroleum pitch and
Liu
et al.
[
121 using pyrolyzed epoxy novolac resin, have all prepared materials
that show a low voltage plateau with a capacity of several hundred mAhfg, and
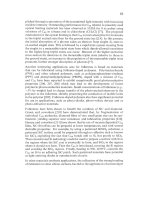
little hysteresis. We believe that lithium can be adsorbed onto internal surfaces
of nanopores formed by single, bi, and trilayer graphene sheets which are
arranged like a “house of cards” [8,11,12] in the hard carbons (schematically
shown in Fig. 24). Such hard carbons show promise for lithium-ion battery
applications [8,11,12,39,40,40].
0
Graphene layer
Lithium
Fig.
24.
Adsorption
of
lithium on the internal surfaces
of
micropores formed by single,
bi, and trilayers of graphene sheets in hard carbon.
In lithium-ion battery applications, it is important to reduce the cost of electrode
materials as much as possible. In this section, we will discuss hard carbons with
high capacity for lithium, prepared from phenolic resins. It is also
our
goal, to
collect further evidence supporting the model in Fig. 24.
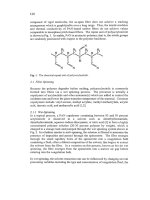
5.1
Preparation
of
microporous carbons and their electrochemical testing
A
hard carbon with high capacity can be made from epoxy novolac resin [12].
The epoxy resins used cost about US$2.50 per pound and give pyrolysis yields
between 20 and
30%.
However, it is well known that phenolic (or phenol-
formaldehyde) resins can be pyrolyzed to give hard carbons with a yield of over
50%
[42]. In addition, these resins cost about US$l.OO per pound. Phenolic
resins therefore offer significant cost advantages over epoxy resins,
so
we
376
undertook a study
of
the electrochemical characteristics
of
hard carbons
prepared by pyrolyzing both acid (novolac) and base-catalyzed (resole) phenolic
resins
[I
13.
The samples are described in Table
4.
Two electrochemical lithidcarbon cells were made for each
of
the pyrolyzed
materials. We used currents of
18.5
mA/g
(20-hour rate) for the first three
charge-discharge cycles and
37
dig (10-hour rate) for the extended cycling
test.
Table
4.
Summary
of
the samples produced.
Sample Heating Weight HIC Yield Rev. Irrev.
temp Percentages
Atomic
(“A)
Capacity Capacity
(“C)
(%I
Ratio
(i
2%)
(mAh/g)
(mAhig)
(*0.03) (i20) (520)
CHN
Ar700 700 91.2 1.5 1.2 0.19 57 550 440
Ar800 800
A1900 900
ArlOOO 1000
Ar1100 1100
Br700
700
Br800 800
Br900 900
BrlOOO 1000
BrllOO 1100
Cr800 800
Cr900 900
CrlOOO
1000
CrllOO 1100
ArvlOOO 1000
Brvl000 1000
CrvlOOO
1000
93.1 1.0
92.3 0.6
94.2 0.4
96.7 0.3
94.7 1.8
95.8 0.9
94.8 0.5
95.6 0.3
97.4 0.4
95.7 0.9
95.1 0.4
96.5
0.3
97.0 0.3
1.3 0.13
1.2 0.07
1.9 0.05
0.8
0.04
0.4 0.22
0.7
0.11
0.5 0.06
0.6 0.04
1.4 0.05
0.6 0.11
0.7 0.05
0.8 0.04
1.3 0.03
55 510
55 510
54 450
52 330
58 630
57 540
57 410
56 540
56 340
64 530
57 450
58 450
56 330
58
520
55 550
57 550
280
210
160
70
260
210
300
200
110
210
180
130
120
270
250
220
Figure
25
shows the second cycle
for
the Br-series carbonaceous materials. The
voltage profiles
of
the Ar and Cr-series samples were similar
to
those
of
the Br-
3
77
series samples [11,43].
The reversible capacity from the second cycle and
irreversible capacities from the first cycle for all the samples are given in Table
4.
1
0
200
400
600
800
CAPACITY (mAWg)
Fig.
25.
Voltage versus capacity for the second discharge and charge
of
cells
with
lithium anodes and with cathodes made of Br-series samples. The curves have been
sequentially offset for clarity. The shifts are: Br700, 4.0V; Br800,
3
OV; Br900,
2
OV;
Br1000, l.OV, and Brl100, 0.OV.
All samples heated at 700 and
800°C
show significant hysteresis; that
IS,
lithium
is
inserted in the materials near zero volts and removed at about one volt. We
have shown that the amount of lithium which can be inserted
in
700°C materials
is directly proportional to their hydrogen
(H)
content. Table
4
shows that
materials heated to 700 and
800°C
retain substantial hydrogen. Upon heating to
900°C,
the hydrogen is predominantly eliminated and
so
is the hysteresis. The
samples then show substantial recharge capacity at low voltages.
The cell made from BrlOOO appears most promising. Its reversible capacity is
about 540 mAWg and it has a long low voltage plateau. Similar results were
found for the second cycles of samples made from
Ar
and Cr resins, except that
the capacities were smaller.
The cycling behavior of sample BrlOOO was tested. Figure
26
shows the
capacity versus cycle number for one BrlOOO cell. This cell was cycled with a
current corresponding
to
37
mA/g
(IO-hour rate) after the first three cycles.
378
h
\
rn
pa
800
4
E
700-
G
*
c l
2
600-
4
u
w
3
500-
u
2
400
Fig.
26.
Capacity versus cycle number
for
a cell contaming
BrlOOO
as
the
electrode
material.
The
test
was made
at
30°C.
I
1
I
I
8
1.
I
1
I
I
'7
BrlOOO
cycling
at
30°C
cycling
at
20
hr
rate
cycling
at
10
hr
rate
-
000
0
m~u~pn~gmlUu0~-
I
a
%
I
*
I
I
'
I
I
I
I
5.2
Sample
Microporosity
Powder X-ray diffkaction and
SAXS
were employed here to explore the
microstructure
of
hard carbon samples with high capacities. Powder X-ray
diffraction measurements were made
on
all
the samples listed
in
Table
4.
We
concentrate here
on
sample Br1000, shown
in
Fig.
27.
A
weak and broad
(002)
Bragg peak (near
22")
is observed.
Well formed
(100)
(at about
43.3')
and
(1
10)
(near
80")
peaks are also seen. The sample is predominantly made up
of
graphene sheets with a lateral extension of about
20-30A
(referring to Table
2,
applying the Schemer equation to the
(100)
peaks). These layers are not stacked
in a parallel fashion,
and
therefore, there
must
be small pores or
voids
between
them. We used
SAXS
to
probe these pores.
379
'1'1'1'l'1'1'1'
BrlOOO
002
peak
r2
30001
,
,
,k,
,
0
10
20
30
40
50
60
70
80
90
SCATTERING ANGLE
(deg.)
Fig.
27.
Powder X-ray diffraction
profile
of
the
Brl
000
sample.
Figure 28a shows the result
of
SAXS on sample Br1000.
We used Guinier's
formula (see eq.
6)
for the small angle scattering intensity,
I(k),
from randomly
located voids with radius of gyration,
Rg.
Although Guinier's equation assumes
a random distribution
of
pores with a homogeneous pore size, it
fits
our
experimental data well. The slope of the solid line in Fig. 28b gives
%
=
5.5
A
and this value has been used for the calculated curve in Fig. 28a. This suggests
a relatively narrow pore-size distribution with an equivalent spherical pore
diameter of about 14A.
Sdar
results were found for the other heated resin
samples, except
that
the mean pore diameter changed from about
12
8,
for
samples made at 700°C to about 15
A
for samples made at 1100°C.
From Figs 27 and 28, we see a correlation between weak and broad X-ray (002)
peak and large microporosity in the hard carbon samples.
In
our
previous work
[12], we showed that the amount of single graphene layers
in
hard carbon
samples can be quantified by the empirical parameter,
R,
of the X-ray (002)
peak. Figure 29 shows how we measure the parameter,
R,
defined to be the
ratio
of
the peak count rate at the (002) peak divided by the background level
(estimated by linear extrapolation) at the same angle. We now show the
meaning and importance
of
R.
380
2000
lorn
0
0
4
8
12
16
SCATTERING
ANGLE
(deg.)
C
k2
(k2
)
Fig.
28.
(a) Small angle scattering intensity versus scattering angle for Br1000. The
solid line
IS
a fit using equation
(6)
with
RE
=
5.5
A.
(b)
Natural log
of
the scattered
intensity versus
k2.
The straight-line fit allows
R,
to be extracted from eq.
(6).
The large
intensity at very small
k
is
caused by the scattering from macropores or mesopores in the
sample
381
R=B,
/A,
10
20
30
40
SCATTERING
ANGLE
(deg.)
Fig. 29.
Schematic graph showing the definition
ofthe
parameter,
R,
used
to
empirically
estimate the fraction
of
single graphene layers
in
hard carbon
samples.
Figure
30
shows a series of calculated patterns for carbon samples with a
fraction,
f,
of
carbon atoms in randomly oriented single layers, a fraction
2/3(
1-
f)
in
bilayers and a fraction
1/3(1-f)
in trilayers
[12].
These curves can be used
to
estimate the dependence of the ratio,
€2,
defined by Fig.
29,
on the single layer
fraction. Figure
31
shows the dependence
of
R
on
single layer fraction for the
calculated patterns
in
Fig.
30,
and for another set
of
calculated patterns (not
shown)
where the fraction
of
carbon
atoms
in bilayers and trilayers was taken
to
be
%(l-f)
[12].
Both curves in
Fig.
31 clearly
show
that
R
decreases as the
single layer content
of
the sample increases and
is
fairly insensitive
to
how the
carbon is distributed
in
bilayers and trilayers.
3
82
Fig.
30.
Calculated
(002)
Bragg peaks for various single layer fractions
of
the sample
from reference 12.
The
calculations assumed that a fraction, f, of the carbon was in
single layers and that fractions 2/3(1-f) and
1/3(1-f)
were included
in
bilayers and
trilayers respectively.
3.5
2
Layer,
0.67(1-f);
3 Layer, 0.33(1-f)
3.0
PL
0
F
2.5
-
a
w
0
>
4
2.0
-
4
x
e
e
0
1.5
-
I
0.2
0.3
0.4
0.5
0.6
0.7
SINGLE LAYER FRACTION
Fig.
31.
The dependence
of
R
on
single-layer fraction for the calculated patterns
of
Fig.
30
,
and for a second set
of
calculations where the fraction of carbon atoms
rn
bilayers
and trilayers
is
equal
[12].
3
83
5.3
Mechanism
of
lithium insertion
The materials made near
1000°C
from the three resins have little hydrogen
content. These materials show bgh capacity (up to
550
mAh/g), little charge-
discharge hysteresis, and appear well-suited for application
in
lithium-ion
batteries. The mechanism for lithium insertion on the low voltage plateau is
believed to be the adsorption of lithium onto internal surfaces of nanopores
formed by single, bi, and bilayer graphene sheets which are arranged like
a
"house of cards" as shown in Fig.
24.
Additional samples were prepared from the three resins and were heated at
temperatures between
940"
and
IIOO",
under different inert gas flow rate and
with different heatmg rates. The samples have different microporosities and
show different capacities for lithium insertion. The results for all the carbons
prepared
from
resins are shown in Fig.
32,
which shows the reversible capacity
plotted as a function
of
R.
The reversible capacity for Li insertion increases
as
R
decreases. This result
is
consistent with the result reported in reference
12,
0
0
0
I-
0.
O
4
p1
500
e.
0
0
0
0
0.
1.3 1.4 1.5 1.6 1.7 1.8
R
Fig.
32.
Reversible capacity of microporous carbon prepared from phenollc resins
heated between
940
to
1100°C
plotted as a function
of
the X-ray ratio
R.
R
is
a
parameter which
is
empirically correlated to the fraction
of
single-layer graphene sheets
in the samples.
3
84
which suggusts that Li atoms can be adsorbed onto the internal surface of
micropores in the hard carbon samples as shown
in
Fig. 24. If there are more
micropores (or small
R
for the sample), then the capacity is larger.
A
lithium cluster in the micropores
of
the carbon sample has a very similar
environment as lithium atoms in metallic lithium. Hence, we observe long low-
voltage plateaus on both discharge and charge for lithium insertion in the
microporous carbon.
Since these materials have significant microporosity, we expect their bulk
densities to be low.
For example, the tap density (100 taps) of BrlOOO was
measured to be 0.81 glcc, compared to 1.34 glcc for the synthetic graphitic
carbon powder, MCMl32700, measured by the same method.
6
Carbons
Used
in Commercial Applications
Most commercial lithium-ion cells maufactured today use graphitic carbons
from region 1 of Fig. 2. These are of several forms, with mesocarbon
microspheres and natural graphites being the most commonly used. The
specific capacity of these carbons is near 350 mAWg.
Sony Energytec uses a disordered hard carbon of the type described
in
region 3
of
Fig.
2.
These carbons have been produced by a number of Japanese
manufacturers including Kureha [4 11 and Mitsubishi Gas [40]. Our recent work
[44], and other work
in
the patent literature shows how such carbons can be
produced from natural precursors like sugar and wood. This suggests that it
should ultimately be possible to prepare such carbons very cheaply. The
specific capacity
of
region-3 carbons which are in commercial production are
around 500 mAWg.
There are numerous alternatives to pure carbons for use in Li-ion batteries,
Wilson et al. 1451 have
shown
how disordered carbons containmg silicon
nanoclusters can use the large alloying capacity of silicon for
Li,
in addition to
the insertion capacity
of
the carbon itself. These materials can have reversible
capacities up to 500mAWg. They are prepared by chemical vapor deposioon
methods and hence are a lab curiosity at the moment. In an effort to make these
materials more practical, Wilson et al.
[46]
examined the products of the
pyrolysis of siloxane polymers and found they could have reversible capacihes
near
600
&g.
A
recent patent filing by Selko [47] showed that Si0 (a
mixture of nanometer sized amorphous Si and amorphous SiO, regions within
particles) has a voltage of about 0.3V versus Li metal and a capacity for lithium
near
11
OOmAWg. Our preliminary experiments have confiied this result, but
385
do not show good cycle life. In another recent patent filing, researchers at Fuji
[48]
have shown that SnO, SnO, and amorphous SiSnO, all have large
reversible capacities
(>
500
mAh/g)
for lithium below about
0.8V. Fuji
has
even announced plans to commercialize a cell with one of the anodes described
in ref.
48.
It is clear that there is enormous activity
in
the the search for better and cheaper
anode materials
for
Li-ion batteries. In fact, it is not certain at this time whether
carbon will remain the material of choice for this application.
Nevertheless,
large strides toward the opfimization and understanding of carbons for Li-ion
batteries have been made in the last
5
to
10
years.
If continued progress
is
made, we can expect to see carbon materials in Li-ion batteries for a long time
to come.
7
1.
2.
3.
4.
5.
6.
7.
8.
9.
10.
11.
12.
13.
14.
15.
16
17.
18.
19
References
T. Nagaura and
K.
Tozawa, Prog. Batt. Solar Cells 9,209 (1990).
J.R. Dahn, A.K. Sleigh, Hang Shi, B.W. Way, W.J. Weydanz, J.N. Reimers,
Q.
Zhong, and
U.
von Sacken, “Carbons and Graphites as Substitutes for the
Lithium Anode”, in
Lithium Batteries,
G.
Pistoia, Elsevier, North Holland
S.
Hossain, “Rechargeable Lithium Batteries (Ambient temperature)”, in
Handbook
of
Batteries,
2nd edition, D. Linden, McGraw-Hill Inc.
(1
995).
J.R. Dahn,
U.
von Sacken, M.W. Juzkow, and
H.
Al-Janaby, J. Electrochem.
Soc. 138, 2207
(I
991).
J.R Dahn, Tao Zheng, Yinghu Liu, J.S. Xue, Science 270, 590 (1995).
Tao Zheng, J.N. Reimers, and J.R. Dahn, Phys. Rev. B 51, 734-741 (1995).
Tao Zheng and J.R. Dahn, Phys. Rev. B53,3061-3071 (1996)
Tao Zheng, Yinghu
Liu,
E.W. Fuller, Sheilla Tseng,
U.
von Sacken, and J.R.
Dah, J. Electrochem. SOC. 142,258
1
(1995).
Tao Zheng, J.S. Xue, and J.R. Dahn, Chemistry
of Materials,
8,
389 (1996)
Tao Zheng, W.R. McKinnon, and J.R. Dahn,
J.
Electrochem SOC., 143 (71,
Tao Zheng,
Q.
Zhong, and J.R. Dahn, J Electrochem. SOC. 142, L21l (1995).
Yinghu Liu,
J.S
Xue, Tao Zheng,
and
J.R. Dahn, Carbon 34, 193
(1
996).
Tao Zheng,
W.
Xing and J.R. Dahn,
Carbons
Prepared from
Coals
for Anodes
oflithiurn-Ion
Cells,
Carbon, 34(12), pp. 1501-1507 (1996).
Hang
Shi, Ph.D. Thesis, Simon Fraser University (1993).
Hang Shi, J.N. Reimers, and J.R. Dahn, J. Appl. Cryst.
26,
827 (1993).
P. Scherrer, Nachr Gottinger Gesell., 98 (191
8).
B.E.
Warren, Phys. Rev. 9,693 (1941).
B.E.
Warren,X-RayDiSfraction,
p. 254, Dover, N.Y. (1990).
A. Guinier,
G.
Fournet,
Smalldngle
Scatterzng
of
X-Rays
Sons,
N.
Y.,
1955).
(1993).
pp. 2137-2145 (1996).
(John Wiley
&
20.
21.
22
23.
24.
25.
26.
27.
28
29.
30.
31.
32.
33.
34.
35.
36.
37.
38.
39.
40.
41.
42.
43.
M. Kalliat, C.Y. Kwak and P.W. Schmidt,
in
“New Approaches in Coal
Chemisty”,
edited by B.D. B laustein, B.C. Bockrath and
S.
Friedman,
American Chemical Society, Washington,
D.C.,
p. 3, (1981).
R.E. Franklin,
J.
Chem. Phys. 47,573 (1950).
For examples, see paper in volumes
1
and 2 in
Chemisty and Physics
of
Carbon,
edited by P.L. Walker, Jr., Marcel Dekker Inc., N.Y. (1965, 1966).
B.E. Warren,Phys. Rev. 9,693 (1941).
E.
Peled,
J.
Electrochem. SOC. 126, 2047 (1979).
R. Fong, U. von Sacken, and J.R. Dahn,
J.
Electrochem. SOC. 137, 2009
(1
990).
R.C. Boehm, and
A.
Banerjee,
J.
Chem. Phys. 96, 1150 (1992).
Tao Zheng, and J.R. Dahn, Synth. Met. 73,
1
(1995).
S.
Yata, H. Kinoshita, M. Komori,
N.
Ando, T. Kashiwamura, T. Harada, K.
Tanaka, and T. Yamabe, Synth. Met. 62, 153 (1994).
A. Mabuchi, K. Tokumitsu, H. Fujimoto, and T. Kasuh, In Proc. 7th Int.
Meeting on Lithium Batteries, May 15-20 (1994), Boston,
USA,
paper I-A-10,
p. 207 of ext. abs.; also see
H.
Fujimoto, A. Mabuchi, K. Tokumtsu, and T
Kasuh, ibid, paper 11-B-12, p. 540.
K.
Sato, M. Noguchi, A. Demachi,
N.
Oki,
and
M.
Endo, Science 264, 556
(1994).
J.S.
Xue, A.M. Wilson, and J.R. Dahn, Canadian patent application, filed May
20 (1995).
B.R. Puri, “Surface Complexes on Carbons”, in
Chemisty and Physics
of
Carbons,
edited by P.L. Walker, Jr.,
Vol.
6, Marcel Dekker Inc., N.Y. (1970)
For example, see Tao Zheng’s Ph.D. Thesis, Simon Fraser University, Canada
(1
996).
R.E. Franklin, Acta Cryst. 4,253 (1951).
R. Diamond, in
Proc. Third Con$
on
Carbon,
p. 367, Buffalo, New York
(1957), published by Pregammon Press, New York (1959).
T. Enoki, S. Miyajima, M. Sano, and H. Inokuchi,
J.
Mater. Res. 5,435 (1990).
P. Papanek, M. Radosavljievic, and
J.E.
Fischer,
Chem. Mater.,
8(7), pp. 1519-
1526 (1996).
L.S.
Selwyn, W.R. McKinnon,
U.
von Sacken, and C.A. Jones, Solid State
Ionics 22, 337 (1987).
A
Omaru,
H.
Azuma,
M.
Aoki, A. Kita, and Y. Nishi, paper #25, 182”d
meeting
of
the Electrochemical Society, Toronto, Canada. Extended Abstracts
of
Battery Division, p. 34 (1992).
Y.
Takahashi,
J.
Oishi,
Y
Miki,
M.
Yoshimura,
K.
Shibahara, and H.
Sakamoto, 35“ Battery Symposium in Japan, Nov. 14-16, Nagoya, Japan,
paper
2B05,
extended abstracts, page 39 (1994).
N.
Sonobe,
M.
Ishikawa, and
T.
Iwasaki, 35” Battery Symposium in Japan,
Nov. 14-16, Nagoya, Japan, paper 2B09, extended abstracts, page 47 (1994).
E. Fitzer, W. Schaefer, and
S.
Yamada, Carbon 7, 643 (1969).
U.
von Sacken, Q. Zhong, Tao Zheng, and J.R.
Dahn,
PhenoZic Resin
Precursor Pregraphitic Carbonaceous Insertion Compounds and Use as
Anodes in Rechargeable Batteries,
Canadian Patent Application #2,146,426
(1995).
387
44.
Weibing Xing, J.S. Xue and J.R. Dah,
Optimizing Pyrolysis
of
Sugar Carbons
for Use as Anode Materials in Lithium-Ion Batteries,
J.
Electrochem SOC.,
143, 3046 (1996);
Weibing Xing, J.S. Xue, Tao Zheng, A. Gibaud and J.R.
Dahn,
Correlation between Lithium Intercalation Capacity and Microstructure
in Hard Carbons,
J.
Electrochem. SOC.,
143,3482 (1996).
A.M. Wilson and J.R. Dahn,
J.
Electrochem. SOC.
142,326 (1995).
A.M. Wilson, J.N. Reimers, E.W. Fuller and J.R. Dahn, Solid State Ionics,
74,
249 (1 994).
K.
Tahara,
H.
Ishikawa,
F.
Iwasaki,
S.
Yahagi, A. Sakata, and
T.
Sakai,
European Patent Application
#93 11 1938.2, (1993).
Y.
Idota,
M.
Mishima,
Y.
Miyaki,
T.
Kubota and
T.
Miyasaka, Canadian
Patent Application
2,134,052 (1994).
45.
46.
47.
48.
389
CHAPTER
12
Fusion Energy Applications
LANCE
L.
SNEAD
Oak Ridge National Laboratory
P.Q. Box
2008
Oak Ridge, Tennessee
37831-6087,
U.S.A.
1
Introduction
1.
I
Background
When
two
light elements collide with sufficient energy they may "fuse" and
form
a krd, heavier, element.
A
simple mass balance would show that there is a small
mass
loss
in
this process, correspondmg to a significant energy release. Many light
elements can undergo exothermic fusion reactions, but fusion of the isotopes
of
hydrogen and helium are the easiest reactions to induce. The most probable fusion
reactions
and
their released energies are:
1H'
+
1H'
+
1D2
f
positron
=
1.4
MeV
1H'
+
ID2
+
2~e3
=
5.5MeV
IH'
+
1~3
+
2~4
=
19.9MeV
1D2
+
1D2
+
2He3
+
neutron
=
3.3
MeV
ID2
+
ID2
+
1~3
+
IH'
=
4.0MeV
1D2
+
1T'
+
2He4
+
neutron
=
17.6MeV
ID^
+
2~~3
+
2~~4
+
H
=
18.2MeV
Fusion requires high temperature (energies) to cause the atoms to bind together.
The likelihood of atoms fusing together is hghly dependent on the individual
isotopes and their temperature. It can be shown that the D+T reaction
is
the easiest
reaction to drive. However, the inherent rahoactivity and expense of tritium has
restricted its use, while the lighter hydrogen isotopes have been extensively used.
The gaseous temperatures required for
D+T
reaction are related to the kinetic
energy
of
the ions, and are in excess
of
50 million degrees Kelvin. While
significant power has been produced from fusion systems, the total amount of
power produced in any reactor is much less than the power added to the system to
drive the fusion process. The cvent goal of fusion programs worldwide is to
achieve "ignition," where the plasma begins a self-sustaining burn
from
which
more power
is
generated than consumed in the fusion process.