Conductive Polymers and Plastics in Industrial Applications Part 3 ppsx
Bạn đang xem bản rút gọn của tài liệu. Xem và tải ngay bản đầy đủ của tài liệu tại đây (736.65 KB, 20 trang )
EXPERIMENTAL
SAMPLE PREPARATION
Neat s-PS resin with an average molecular weight of 400,000 was kindly donated by the Dow
Chemical Company. The raw material was dried in a vacuum oven at 85
o
C for 12 hours before
molding. sPS disks with a diameter of 20 mm and thickness of 0.8 mm were made by a Carver
compression molding machine. Mold temperature was set at 280
o
C. To ensure smooth sur-
faces of the samples, two glass plates and a template made of copper were used to mold the
samples.
IMPLANT PROCEDURE
Ion implantation experiments were performed at the Acadiana Research Laboratory with a
National Electrostatics Corporation 5SDH-2 1.7 MV Tandem Pelletron Accelerator. The ac-
celerator system has two ion sources: the Source of Negative Ions by Cesium Sputtering
(SNICS) to produce heavy ions, and the Radio Frequency (RF) sources to produce helium
ions. Carbon ions were produced from a graphite pellet inside the SNICS source of the accel-
erator. The pressure in the system was maintained at 10
-7
Torr. A PPT Residual Gas Analyzer
(RGA) was attached to the chamber to monitor the gas emission from the sPS samples during
the implantation. In the first part of this research, the carbon ions were kept at a constant en-
ergy of 1.0 MeV but the dose was varied from 10
11
ions/cm
2
to 10
15
ions/cm
2
. In the second
part of this research, the implanted dose was kept to be 10
13
ions/cm
2
but the energy changed
from 0.5 MeV to 4.0 MeV. Low current densities (around 25 nA/cm
2
) were used in both cases
to minimize the effects of beam heating.
CHARACTERIZATION OF SURFACE STRUCTURE AND PROPERTIES
Surface composition was analyzed by a Residual Gas Analyzer (RGA) and a Elastic Recoil
Detection Analysis (ERD). Surface morphology and roughness were measured by Atomic
Force Microscopy (AFM). Surface hardness was studied by a Nanoindenter. Wear resistance
and friction coefficient were investigated by a Tribometer. Surface wettability and contact an-
gles were characterized by a Kruess Processor Tensiometer. Solvent resistance was measured
by the weight change of samples immersed in toluene and chloroform. Surface electrical con-
ductivity was measured by a Keithley Electrometer.
RESULTS
COMPOSITIONAL AND MORPHOLOGY ANALYSIS
The RGA results showed that during ion implantation of sPS samples volatile species includ-
ing H
2
and C
2
H
2
were released. This is caused by the irreversible cleavage of covalent bonds
36 Conductive Polymers and Plastics
within the polymer chains. The results from ERD study confirm that the hydrogen content in
the surface of implanted sPS is reduced by increasing dose but implantation energy seems to
cause little change (Figure 1).
Figure 2 shows the surface morphology of untreated sPS samples in two magnifications.
In these AFM pictures spherulitical structure can be seen very clearly and the average size of
these spherulites are about5~10
µ
m. Figure 3 shows the AFM pictures of implanted sPS
Ion Implanted Syndiotactic Polystyrene 37
Figure 1. (left) Effect of dose on the hydrogen content in implanted sPS samples. (right) Effects of energy on the hydrogen
content in implanted sPS samples.
Figure 2. AFM pictures of sPS before treatment.
samples. At lower dose of 10
11
ions/cm
2
, there seems to be only minor visual changes. But the
surface structure shows melted regions at the highest dose of 10
15
ions/cm
2
.
SOLVENT RESISTANCE AND WETTABILITY
The solvent resistance of the im-
planted sPS samples were studied by
monitoring the amount of solvent ab-
sorbed when these samples were im-
mersed in various solvents. The higher
the amount of solvent absorbed means
the poorer the solvent resistance. In
general, if the dose is not too high, ions
bombardment can cause crosslinking
of polymer chains on the surfaces and
this can improve the solvent
resistance. Figure 4 shows that ion im-
plantation can improve the solvent re-
sistance. However, this effect
saturated at dose of 10
13
ions/cm
2
. Fur-
ther increase in doses beyond that will
38 Conductive Polymers and Plastics
Figure 3. AFM pictures of sPS after treatment with different dose of ion beam. (left) dose = 10
11
ions/cm
2
, (right) dose = 10
15
ions/cm
2
.
Figure 4. Effects of ion implantation on the solvent resistance of sPS
samples.
not improve the solvent resistance.
Similar trend was found on the effect
of implantation energy but to a less
extent.
The wettability of ion im-
planted sPS samples were studied by
measuring the contact angles with
respect to distilled water. The lower
these numbers means the better the
wettability. Figure 5 shows that
wettability improves slightly with
increasing dose. The effect of energy
was also studied but it shows no in-
fluence.
MECHANICAL AND ELECTRICAL PROPERTIES
Hardness is ultimately a manifesta-
tion of three-dimensional bond
strength, which can be altered by ion
implantation. During ion implanta-
tion, rapture of C-H bonds occurred
and gaseous elements lost, leaving
dangling C bonds, which then might
link together forming a rigid three
dimensional carbon structure. The
hardness of sPS samples treated with
ion implantation is shown in Figure
6. Compared to the untreated sam-
ple, ion implantation can dramati-
cally improve the surface hardness
by more than 10 times. Samples im-
planted at dose of 10
15
ions/cm
2
are
even harder than stainless steel which typically has a hardness of 7 GPa.
In general, surfaces with smaller coefficient of friction have better wear resistance. Fig-
ure 7 shows the coefficient of friction of both untreated and ion implanted sPS samples. It
seems that implantation dose of 10
15
ions/cm
2
is needed to improve the wear resistance dra-
matically while implantation with 10
13
ions/cm
2
and below have little effect. Friction and
wear are very complex phenomena, which depend upon load, speed, humidity, mechanical in-
Ion Implanted Syndiotactic Polystyrene 39
Figure 5. Effect of dose on thecontactangle of ion implanted sPS samples.
Figure 6. Effects of dose on the hardness of implanted sPS samples.
terlocking, molecular interactions, heat generation, and electrostatic force.
7
The reasons for
the enhancement of wear resistance of implanted polymers might be:
• Change in the structure and composition of the near surface region produced a
tough new surface that forms a long lasting barrier to wear.
• High concentration of carbon ions in the near-surface region produces compressive
stress that close up the microcracks inherent in the implanted surface.
• The formation of lubricate graphite-like structure on the implanted surface.
When ions bombard on
the polymer, they lose energy,
release hydrogen, and form a
carbon-enriched structure. This
carbon-enriched cluster is more
conductive than the untreated
polymer region. When the dose
increases, many of these clus-
ters will start to contact each
other and finally overlap to
form a continues carbon rich
conductive surface, which con-
tributes to the measurable
electrical conductivity. Ion im-
plantation typically increases
surface electrical conductivity
of polymers. However, due to
the fact that the neat sPS polymer has a very high resistivity, the measurement and analysis is
comparatively difficult. In this study, the electrical conductivity of samples implanted with
40 Conductive Polymers and Plastics
Figure 7. Coefficient of friction of sPS samples showing the effect of dose.
Table 1. Electrical conductivity of ion implanted sPS samples
Dose, ion/cm
2
V, V I, Ax10
-12
R, Wx10
12
R
ð
, W/sqx10
12
Resistivity,
r, W-cm
Conductivity,
s, s/cm
untreated 92.4 - - - >10
16
<10
-16
10
11
92.4 - - - - -
10
12
92.4 - - - - -
10
13
92.4 - - - - -
10
14
92.4 0.48 193.0 2600 6.1x10
11
1.64x10
-12
10
15
92.4 550 0.168 2.35 5.2x10
8
1.92x10
-9
different doses was studied and the conductivity enhancement of the sPS samples as a result
of high dose implantation is remarkable (Table 1). Electrical conductivity caused by the ion
implantation with doses lower than 10
14
ions/cm
2
could not be measured. The conductivity of
the sample with dose of 10
15
ions/cm
2
is several orders higher than the sample with dose of
10
14
ions/cm
2
.
CONCLUSIONS
1 It was found that C-H bonds broke and several volatile species (especially hydrogen)
were released during the ion implantation process.
2 Ion implantation improved the solvent resistance of sPS samples. Especially,
increased dose had a definite effect on the improvement of solvent resistance.
However, ion implantation performed at different energy levels showed less effect.
3 The wettability of sPS samples was improved slightly by ion implantation.
4 Increased dose of ion implantation will improve the surface hardness of the sPS
samples. The sPS surface as hard as stainless has been created by the implantation at
a highest dose of 10
15
ions/cm
2
.
5 Implantation dose up to 10
15
ions/cm
2
was needed to improve the wear resistance of
these sPS samples.
6 Implantation dose up to 10
14
ions/cm
2
was required to show increases in electrical
conductivity. Further increase in ion dose should improve the electrical conductivity.
ACKNOWLEDGMENTS
This work was supported by Louisiana Education Quality Support Fund (Grant #
LEQSF(1997-00)-RD-B-15 and LEQSF(1995-98)-RD-B-99) and the Department of En-
ergy/Louisiana Education Quality Support Fund in Cooperative Agreement Number
DE-FC02-91ER75669. sPS material donation and financial support from the Dow Chemical
Company is highly appreciated.
REFERENCES
1 J. H. Schut, Plastics Technology, 2, 26 (1993).
2 D. Bank and R. Brentin, Plastics Technology, 43(6), 52 (1997).
3 C. M. Hsiung, J. Miao, Y. Ulcer, and M. Cakmak, SPE Annual Technical Papers, 1788, 1798 (1995).
4 Y. Ulcer, M. Cakmak, J. Miao, and C. M. Hsiung, Journal of Applied Polymer Science, 60, 669 (1996).
5 X. Zhang, C. M. Hsiung, and D. Bank, SPE Annual Technical Papers, 2339 (1997).
6 H. Ryssel and I. Ruge, Ion Implantation, 1986, John Wiley & Sons.
7 E. H. Lee, M. B. Lewis, P. J. Blau, and L. K. Mansur, J. Mater. Res., 6(3), 610 (1991).
Ion Implanted Syndiotactic Polystyrene 41
Carbon Black Filled Immiscible Blend of
Poly(Vinylidene Fluoride) and High Density
Polyethylene: Electrical Properties and Morphology
Jiyun Feng and Chi-Ming Chan
Department of Chemical Engineering, The Hong Kong University of Science and
Technology, Clear Water Bay, Kowloon, Hong Kong
INTRODUCTION
In recent years, conductive polymer composites with a low percolation threshold have re-
ceived increasing attention.
1-7
One important approach to prepare the composites is to selec-
tively localize a conductive filler in one polymer phase or at the interface of an immiscible
polymer blend. The advantage of this approach is that the composite may achieve a high elec-
trical conductivity at very low CB contents and retain reasonable mechanical properties. In
addition, they can be manufactured at lower costs and with simpler processing procedures.
The reason for the high electrical conductivity of the composites at low CB contents is an
uneven distribution of CB in immiscible polymer blends. Several examples have been
found.
1-7
Narkis et al. studied CB-filled immiscible blends of polypropylene(PP)/Nylon and
PP/polycarbonate(PC) and found that CB has stronger affinity to Nylon and PC than to PP, re-
sulting in its preferential localization in the former phases.
3,4
These results are due to the
higher surface tension and high polarity of Nylon and PC in comparison to PP. Sumita et al.
investigated CB filled HDPE/PP blends and discovered that CB is in the HDPE phase.
6,7
It is known that past research on the composites is focused on the CB distribution and the
relationships between their electrical conductivity and morphology. Double percolation
model is used to predict the electrical behaviors of the composites. However, the effect of
morphology on the PTC and NTC effects of the composites is absent in the literature.
In the present work, the electrical conductivity, PTC, and NTC effects of CB filled
PVDF/HDPE composites were studied. Morphology of the composites was observed. The re-
lationships between electrical behaviors and morphology are also discussed.
EXPERIMENTAL
The polymers used in this study were PVDF (Hylar 460 from Ausimount Co. USA) and
HDPE (HMM 5502 from Philips International Petroleum Inc.). The CB used was V-XC72
from, Cabot. The CB-filled PVDF/HDPE composites were prepared using a Haake mixer at
200
o
C and 30 rpm for 15 min. The materials obtained were further compressed into 2 mm
thick sheets using a hot press at 200
o
C. Two group of samples were prepared. One group of
samples contains a fixed PVDF/HDPE ratio (1/1) but different CB contents. Another group of
samples contains a fixed CB content (10 wt%) but different PVDF/HDPE volume ratios.
The resistivity of the composites were measured with a multimeter. Before measure-
ments, the sample surfaces were coated with silver paint to eliminate the contact resistance.
The resistivity of the composites as a function of temperature was measured using a comput-
erized system, which comprises a multimeter, a computer, and a programmable oven. The
heating rate was 2
o
C/min. The morphology of the composites was determined using optical
microscopy and the transmission mode was used. Thin sections of 1
µ
m in thickness were ob-
tained by a cryomicrotome at -100
o
C.
RESULTS AND DISCUSSION
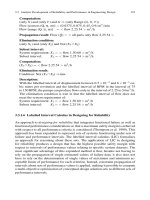
ELECTRICAL CONDUCTIVITY
The electrical conductivity of CB-filled PVDF/HDPE composites with a fixed PVDF/HDPE
volume ratio versus CB volume fraction is illustrated in Figure 1. Apparently, the electrical
conductivity of the composites increases dramatically when the CB content attains the perco-
lation threshold approximately at 0.035 volume fraction of CB. According to the percolation
theory, the electrical conductivity can be correlated with the volume fraction of the conduc-
tive filler by the scaling law as follows.
()
σσ=−
oc
t
ΦΦ
[1]
By using a log-log plot of the electrical conductivity versus the excess of conductive filler
volume fraction of (
ΦΦ−
c
), as shown in Figure 2, the best fit was obtained with
Φ
c
= 0.037
from the slope and the intercept of the straight line, the values of t and
σ
o
were determined to
be 2.75 and 93.3, respectively. The linear correlation coefficient was 0.998.
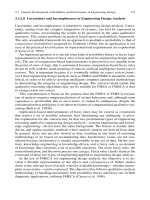
In addition to the CB content, the PVDF/HDPE volume ratio also affects the electrical
conductivity of the composites. Figure 3 displays the electrical conductivity versus
PVDF/HDPE volume ratio. Clearly, the electrical conductivity of the composites increases
rapidly after the PVDF/HDPE volume ratio is greater than 0.17. The increase becomes more
44 Conductive Polymers and Plastics
Carbon Black Filled Immiscible Blend 45
Figure 4. CB volume fraction vs. PVDF/HDPE volume ratio.Figure 3. Plot of log conductivity vs. PVDF/HDPE volume
ratio.
Figure 1. Plot of log conductivity vs. CB volume fraction. Figure 2. Plot of log conductivity vs. (
φφ−
c
).
gradual when the PVDF/HDPE volume ratio is greater than 0.43. The results suggest that a
decrease in HDPE content significantly increases the conductivity of the composites. Hence,
it can be concluded that the distribution of CB in the PVDF/HDPE composite is uneven and
CB is just located in the HDPE phase. Figure 4 shows the CB volume fraction versus
PVDF/HDPE volume ratio in two different situations. If the CB is evenly distributed in the
PVDF/HDPE matrix, the CB volume fractions at different PVDF/HDPE volume ratios do not
show any significant differences as shown in Figure 4. Obviously, this is not a correct model
when compared with the experimental results depicted in Figure 3. However, if we assume
that the CB is totally localized in the HDPE phase, the CB volume fraction in the HDPE phase
increases when the PVDF/HDPE volume ratio increases, resulting in a large increase in elec-
trical conductivity. There is no doubt that this model is consistent with the experimental data
in Figure 3.
PTC AND NTC EFFECTS
Figure 5 depicts the resistivity of the CB-filled PVDF/HDPE composites versus temperature.
The resistivity peak of the composites is observed at about 145
o
C which is a little higher than
that of the melting point of HDPE. However, at the melting point of PVDF, no resistivity in-
crease is observed. These results reveal two important facts. First, the PTC effect of the com-
posites is caused by the thermal expansion by the melting of the HDPE phase in the
46 Conductive Polymers and Plastics
Figure 5. Plot of log resistivity vs. temperature. Figure 6. Plot of log resistivity vs. temperature.
composites. Second, the CB is only located in the HDPE
phase in the composite, indicating that the distribution of
the CB is uneven. This result provides a strong support
for the conclusion that the CB is mainly located in the
HDPE phase. In addition, the PTC intensity and room
temperature resistivity decrease as the CB content in-
crease.
It should be noted that in the case of 7.5 and 10 wt%
CB composites, the NTC effect is observed when the
temperature is over the melting point of HDPE which is
very similar to that of CB-filled neat HDPE composite.
However, in the case of 20 wt% CB composite, the mate-
rial shows a PTC effect first, then a zero temperature
coefficient (ZTC) effect but not a NTC effect until the
temperature attains the melting point of PVDF, indicat-
ing that a delayed NTC effect occurs.
In order to detect the cause for the delayed NTC ef-
fect, a comparison between a CB-filled neat HDPE and
the composite was made as shown in Figure 6. The CB
content in the neat HDPE and in the HDPE phase of the
composite is the same. The CB filled neat HDPE com-
posite show an obvious NTC effect when the
temperature is above the melting point of HDPE, indi-
cating that the delayed NTC effect is caused by the
PVDF phase but not the CB concentration in the HDPE
phase. The local restriction provided by the PVDF phase
on the CB filled HDPE phase delays the NTC effect to
higher temperature. When the temperature reaches the
melting point of PVDF phase, the PVDF phase melts
and the restriction is suddenly released resulting in a
sharp decrease in resistivity. This is a new physical phe-
nomenon and it can be used to develop new polymer
thermistors without crosslinking.
MORPHOLOGY
Figures 7(a), (b), and (c) show the optical micrographs of the cryomicrotomed sections of the
composites with different CB contents. It is very clear that a two-phase structure is present
and the CB is just located in one phase. Based on the forgoing conclusions, the light areas are
Carbon Black Filled Immiscible Blend 47
Figure 7. Optical micrographs of CB filled
PVDF/HDPE composites (PVDF/HDPE 1/1).
(a) 7.5, (b) 10, (c) 20 wt% CB.
identified as the PVDF phase, while the dark areas are the CB-filled HDPE phase. At a fixed
PVDF/HDPE volume ratio (1/1), an increase in the CB content leads to an significant de-
crease in the domain size of the PVDF phase, possibly due to the increase in the viscosity of
the CB-filled HDPE phase as a result of the increase in CB content. In the case of 7.5 and 10
wt% CB, the CB-filled HDPE phase forms a continuous phase and the PVDF phase is the dis-
persed phase. However, when the CB content reaches 20 wt%, the composite exhibits an in-
terlocking structure which is significantly different from those of lower CB content
composites. These difference in morphology is the reason for the observed difference in the
NTC effect.
In the case of lower CB content composites, the CB-filled HDPE phase forms a continu-
ous phase, the composites show a PTC effect first, then a NTC behavior, indicating that the
PTC and NTC effects of the composites are very similar to those of a CB-filled neat HDPE.
For the 20 wt% CB composite, its morphology is an interlocking structure and it shows a nor-
mal PTC effect then a delayed NTC effect. It is the interlocking structure that makes the NTC
effect delay to a higher temperature. This is a new physical observation and has some impor-
tant potential applications in industry. This material can be used as polymer thermistors
without crosslinking. Hence it is important to understand the mechanism of the delayed NTC
effect.
Consider the CB filled HDPE phase in an interlocking structure, when the temperature is
above the T
m
of the HDPE and further increases, the viscosity of the CB-filled HDPE phase is
basically controlled by the two factors: the temperature and local pressure provided by the
surrounding PVDF phase. It is known that when the temperature increases, the viscosity of
the CB-filled HDPE phase decreases. On the other hand, when the temperature increases, the
HDPE phase expands, because the structure is an interlocking structure and the PVDF phase
is still hard, the PVDF phase restricts the expansion of the HDPE phase. In fact, this restric-
tion produces a pressure on the local CB filled HDPE phase and this pressure greatly affects
the viscosity of the HDPE phase. It is also known that for the CB filled HDPE phase, when the
temperature is above the viscous flow temperature of the polymer, if a pressure is applied to
the polymer, the free volume of the polymer decreases, and molecular interaction increases,
resulting in an increase in viscosity. In the case of CB-filled HDPE phase, it is believed that
the viscosity increases by the local pressure due to the surrounding PVDF phase is larger than
or almost equals the viscosity decrease caused by the temperature increase. The viscosity of
the CB-filled HDPE phase is high and the movements of the CB particles is greatly restricted.
Hence, a flocculated structures can not form, resulting in a delayed NTC effect. But when the
temperature attains the T
m
of the PVDF phase, the PVDF phase melts, the local pressure on
the CB filled HDPE phase is suddenly released. In this case, the viscosity of the CB-filled
HDPE phase suddenly decreases, leading to a formation of the flocculated structures immedi-
48 Conductive Polymers and Plastics
ately, producing a sharp NTC effect occurs. This mechanism successfully explains the
delayed NTC effect observed in this research.
CONCLUSIONS
CB is selectively localized in the HDPE phase due to the stronger affinity to HDPE than to
PVDF. For the composites with a fixed PVDF/HDPE volume ratio of 1/1, a percolation
threshold of 0.037 volume fraction of CB is observed. At a fixed CB content (10 wt%), the
electrical conductivity increases when the PVDF/HDPE volume ratio increases, indicating
that the CB is mainly located in the HDPE phase. In addition, only the PTC effect that is asso-
ciated with the melting of HDPE phase is observed, confirming that the CB is localized in the
HDPE phase. An increase in the CB content can greatly decrease the domain size of the
PVDF phase due to the viscosity increase of the CB-filled HDPE phase. When the CB-filled
HDPE forms a continuous phase and the PVDF forms the dispersed phase, the PTC and NTC
behaviors of the composites are very similar to those of a CB-filled neat HDPE composite.
But when the composite exhibits an interlocking structure, a delayed NTC effect is observed
and the delayed NTC effect is caused by the local restriction provided by the PVDF phase.
ACKNOWLEDGMENT
This work was supported by UPGC Research Infrastructure Grant under Grant No.
RI93/94EG.
REFERENCES
1 G. Genskens, E. De Kezel, S. Blacher and F. Brouers, Eur. Polym. J., 27,1261 (1991).
2 B. Wessling, Kunststoffe, 76, 930 (1986).
3 F. Gubbels, R. Jermore, Ph. Tessie, E. Vanlathem, R. Deltour, A. Calderone, V. Parente, and J. L. Breads, Macromolecules,
27, 1972(1994).
4 M. Narkis, R. Tchoudakov, and O. Breuer, ANTEC’95, P1343-1346.
5 R. Tchoudakov, O. Breuer, M. Narkis and A. Siegman, Polym. Eng. Sci., 36, 1336(1996).
6 M. Sumita, K. Sakata, S. Asai, K. Miyasaka, and H. Nakagawa, Polym. Bull., 25, 265(1991).
7 M. Sumita, K. Sakata, H. Nakagawa, S. Asai, K. Miyasaka and M. Tanemura, Colloid Polym Sci., 270, 134(1992).
Carbon Black Filled Immiscible Blend 49
Conductivity/Morphology Relationships in
Immiscible Polymer Blends: HIPS/SIS/Carbon Black
R. Tchoudakov, O. Breuer, M. Narkis and A. Siegmann
Department of Chemical Engineering, Haifa 32000, Israel
INTRODUCTION
It is generally known, that CB-loaded polymer blends often exhibit a higher conductivity
level than either of the component polymers at the same low CB content. This phenomenon is
due to the preferential CB location within one of the phases and/or at the interfaces, resulting
in segregated phase structures of the blend leading to the double percolation concept.
1,2
Usually, block copolymers are added to immiscible polymer blends to function as alloying
agents or surfactants which contribute to the stabilization of the multiphase structure.
3
There
are numerous publications concerning the morphology and properties of blends such as poly-
styrene (PS) with its copolymers. However, almost nothing is reported on such blends loaded
with carbon black (CB), especially the conductive CBs. In addition, utilization of a block co-
polymer as the dispersed phase within a PS matrix is also uncommon. Various publications
concerning conductive elastomer/CB compositions reveal fundamental parameters determin-
ing their conductivity level, among them the CB-polymer interaction.
4,5
A thermoplastic elas-
tomer mixed with CB, being a part of the multiphase conductive systems, shows a blend
conductivity affected by the thermoplastic elastomer intrinsic microstructure.
6,7
The subject
of this study is the correlation between the morphology and resistivity of CB-loaded compo-
sitions of a high impact PS (HIPS) and a tri-block copolymer, styrene-isoprene-styrene,
(SIS).
EXPERIMENTAL
The polymers used in this study were HIPS, Galirene HT 88-5, MFI - 4,5; Carmel Olefins, Is-
rael and SIS, Quintac 3421, MFI - 11, 14% PS, Japan. The carbon blacks were CB-EC,
Ketjenblack EC-300 Akzo, Netherlands and CB-MT, Thermal black N990, Vanderbilt, char-
acterized by surface area (BET) 950 and 9 m
2
/g and particle diameters ~ 30 and (285-500) nm
correspondingly.
HIPS/SIS/CB blends containing 5-45 wt% SIS and 0-4 phr CB were produced by melt
mixing in a Brabender plastograph at 190
o
C and subsequently compression molding. Their
volume resistivity was measured as previously reported.
8
The blend morphology was studied
using a SEM Jeol 5400. Freeze-fractured and microtomed surfaces (both prepared in liquid
nitrogen) were investigated.
RESULTS AND DISCUSSION
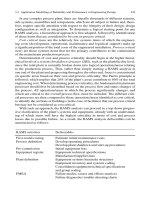
The resistivity of polymer/CB-EC compounds as a function of the CB content is presented in
Figure 1a. It is clearly seen that the SIS/CB percolation occurs at a rather high critical CB con-
centration, about 10 phr. This value is much higher than the corresponding value for HIPS/CB
compounds, about 2 phr. Figure 1b depicts the effect of SIS content on the blend resistivity at
a constant CB concentration in the blend. Interestingly, blends with 2 phr CB depict a stronger
change in resistivity with blend composition compared to the blends containing 4 phr CB. It
should be noted, however, that the resistivity of HIPS containing 4 phr CB is 9 orders of mag-
nitude lower than that of HIPS containing just 2 phr CB. The resistivity of the former is practi-
cally unaffected by the addition of SIS up to 45 wt%, while the 2 phr CB containing blends
exhibit a large resistivity reduction for SIS content of 20-30 wt%. It is well established that
the critical concentration of a given CB at the percolation threshold in different polymers de-
pends on the polymer/CB interaction.
9
Such interactions are related to some polymer charac-
52 Conductive Polymers and Plastics
Figure 1. Resistivity vs. composition. (a) individual polymers, (b) blends.
Conductivity/Morphology Relationships 53
Figure 2. SEM micrographs of the individual polymers with CB-EC. (a) HIPS + 2phr CB, microtomed surface; (b) SIS + 15 phr
CB, freeze-fractured surface.
Figure 3. SEM micrographs of HIPS/SIS blends. (a) 80/20, without CB; (b) 70/30, 2 phr CB-EC; (c) 85/15, 4 phr CB-EC; (d)
70/30, 4 phr CB-MT; (a), (b), (d) - freeze-fractured surfaces; (c) microtomed surfaces.
teristics, such as surface tension, polarity, crystallinity and viscosity, where surface tension
often seems to be the dominant parameter. SEM micrographs of the HIPS/CB compounds en-
able to observe the distribution of CB EC-300 only of microtomed surfaces. Their micro-
graphs clearly show that the rubber inclusions 1-3
µ
m in diameter, do not contain CB. Carbon
black addition to SIS is manifested by the appearance of bright particles increasing in quan-
tity when CB concentration increases. It may be noted that appearance of the CB dispersion
within SIS after the percolation threshold resembles a chain-like particles distribution.
The morphology of neat and CB-containing blends is shown in Figure 2. The structure of
HIPS/SIS blends without CB consists of very fine SIS dispersion at 5 wt% content (particle
size 0.2 to 1
µ
m) up to the co-continuous morphology obtained at about 20 wt% SIS in the
blend. The two components are strongly inter-connected as there are no visible gaps at the in-
terface between the phases, characteristic of low interacting components in immiscible
polymer blends. It is important to point out again that the bright tiny details present in HIPS
are also visible in SIS. Therefore to determine the genuine location of CB particles within the
blend is not an easy task. Rubber inclusions are clearly seen in the HIPS without any traces of
CB-EC present. A clear phase structure, together with a well-defined CB-EC location, are
seen only in a microtomed surfaces of the blends. The SIS component appears smooth, with-
out an evident presence of CB-EC agglomerates, whilst HIPS contains numerous
well-distinguished CB agglomerates (Figure 3c). Hence, preferential CB-EC location in
HIPS occurs, contrary to the case of CB-MT addition, which does not demonstrate a prefer-
ence to either phase. The CB-MT large size particles added to these polymers are clearly seen
penetrated in both phases (Figure 3d).
Returning to Figure 1b, the conductivity of the CB-filled HIPS/SIS blends is determined
by the conductivity of the CB-rich HIPS component and its continuity. SIS addition to
HIPS/CB-EC blends increases the CB effective concentration in HIPS, transforming the
insulative HIPS/2phr CB compound, in the absence of SIS, to relatively conductive upon
about 30 wt% SIS addition. When the continuity of the CB-rich conductive HIPS is disrupted,
the blend reverts insulative. HIPS compounds with 4 phr CB-EC are conductive in the ab-
sence of SIS, therefore no significant change in resistivity with SIS addition is observed.
The presently reported finding that CB-EC is preferentially located in the polymer of
lower percolation threshold is exceptional since the opposite is true for most known immisci-
ble polymer blends.
8
It is assumed that the particular SIS structure, where PS domains are
dispersed in the rubber matrix,
10
may cause the unusually high CB percolation found in SIS.
Taking into account the dimensions of CB-EC particles and PS domains within SIS, a model
of CB-EC dispersion in SIS is suggested (Figure 4). The model is based on the preferential lo-
cation of CB-EC in PS rather than in polyisoprene which is described by the engulfing of the
CB particles by the PS blocks until their “saturation”. This engulfing of CB-EC with the PS
blocks isolates the CB particles and therefore does not contribute to the material's conductiv-
54 Conductive Polymers and Plastics
ity. Only when the engulfing
process is completed, the ex-
cess CB starts its distribution
within the polyisoprene phase.
Therefore SIS becomes con-
ductive when CB-EC
percolation the polyisoprene
phase has been achieved. This
explains the relatively high
CB-EC content, necessary for
percolation in SIS and con-
verting it into a conductive
form. Thus for HIPS/SIS
blends, the added CB is first
located in the PS phase of
HIPS, abundant in PS, and
only thereafter it may be dis-
tributed in the SIS component
as well. Considering the sug-
gested model, the absence of
preference of CB-MT location
within the studied blends is
understandable. The large size of CB-MT particles hinders its mobility and selective interac-
tion with either the plastic or the rubber phase of the thermoplastic elastomer. Thus, CB-MT
particles are immobilized within the phase in which they have been initially incorporated dur-
ing the mixing procedure.
CONCLUSIONS
Low concentration of CB-loaded HIPS/SIS blends demonstrates interesting conductive prop-
erties and unexpected morphology. The preferred CB-EC location in HIPS occurs in spite of
the fact that the percolation threshold of HIPS/CB is much lower than that of SIS/CB. The
blends are conductive as long as the HIPS component is continuous and the CB contained in it
exceeds its percolation value. A difference in the distribution of CB-EC and CB-MT within
the blends was observed, depicting the significance of both CB size and properties and
CB/polymer interaction. A physical model of CB-EC distribution within the SIS triblock co-
polymer has been proposed, explaining the observed unique morphology and conductivity as
a function of composition.
Conductivity/Morphology Relationships 55
Scheme of CB-EC distribution in SIS. (a) neat SIS; (b) CB encapsulation in the PS
blocks; (c) PS blocks "saturated" with CB, excess CB starts to appear in the rubber
phase; (d) CB percolation within rubber is realized.
ACKNOWLEDGMENT
The authors wish to thank the US-Israel CDR Program, Agency for International Develop-
ment, Washington D. C., for supporting the work presented in this publication, Grant No.
HRN-5544-G-00-2-66-00. R. Tchoudakov is also grateful to the Giladi Fund and Israel Min-
istry of Science for supporting her work.
REFERENCES
1 M. Sumita, K. Sakata, S. Asai and K. Miysaka, The Sixth Annual Meeting, PPS, Nice 1990, France.
2 F. Gubbels, E. Vanlathem, R. Lerome, R. Deltour and Ph. Teyssie, The Second International Conference on Carbon Black,
Mulhouse (F), 1993.
3 M. J. Folkes, Processing, Structure and Properties of Block Copolymer, Elsevier Eds., London - New York, 1985, p.14.
4 A. Medalia, Rubber Chem. Technol., 59, 432 (1986).
5 N. K. Dutta, N. Roy Choudhury, B. Haidar, A. Vidal, J B. Donner, L. Delmotte and J. M. Chezear, Polymer, 35, 4293
(1994).
6 S. Radhakrishnan and D. R. Saini, Polymer International, 34, 1, 111 (1994).
7 J. Sakamoto, S. Sakurai, K. Doi and S. Nomura, Polymer, 34, 4837 (1993).
8 R. Tchoudakov, O. Breuer, M. Narkis andA. Siegmann, Polym. Polym. Networks Blends, 6, 1-8 (1996); Polym. Eng. Sci.,
36, 1336 (1996).
9 K. Miasaka, K. Watanabe, E. Jojima, H. Aida, M. Sumita and K. Ishikawa, J. Mater. Sci., 17, 1610 (1982).
10 J. A. Manson and L. H. Sperling, Polymer Blends and Composites, Plenum Press, New York, 1981, p. 132.
56 Conductive Polymers and Plastics
Rheological Characterization of an Electrically
Conductive Composite
Allen C. Nixon
Raychem Corporation, 300 Constitution Drive, Menlo Park, CA 94025, USA
INTRODUCTION
Dynamic mechanical properties of carbon black composites based on rubber or elastomers
have been studied for many years. An extensive review was written by A.I. Medalia.
1
Earlier
work by Payne
2
studied the strain dependence of the moduli. A more recent review by
Gerspacher
3
summarizes the dynamic viscoelastic properties of carbon black filled elasto-
mers. In comparison, very little research has been done on the dynamic mechanical properties
of carbon black filled polyethylene composites. Below the melt, crystallinity dominates the
mechanical properties. Above the melt, however, the behavior is not unlike that of
elastomeric composites.
EXPERIMENTAL
We tested composites based on two types of carbon black. One was a commercial grade as re-
ceived. The other was heat treated at 1100
o
C to modify its surface composition. Loadings of
2.5 to 40v% of the modified and unmodified carbon black were compounded into a commer-
cial high density polyethylene (HDPE) using a Brabender mixer. Samples were then granu-
lated, pressed into 1 mm thick slabs in a hot press, and quenched in a cold press. 25 mm
diameter disks were punched out of the slab using an arbor punch.
Rheological testing was conducted on a Bohlin VORM controlled rate rheometer,
Bohlin CSM controlled stress rheometer, and a Rheometrics Mechanical Spectrometer
RMS-705. The 25 mm disks were loaded into a preheated rheometer using parallel plate ge-
ometry and held for 10 minutes before testing. All isothermal testing was done at 190
o
C.
Oscillatory measurements were made at a frequency of 10 radians/second.