Handbook of Plastics Technologies Part 1 ppt
Bạn đang xem bản rút gọn của tài liệu. Xem và tải ngay bản đầy đủ của tài liệu tại đây (1.23 MB, 40 trang )
1.1
CHAPTER 1
INTRODUCTION TO
POLYMERS AND PLASTICS
Carol M. F. Barry, Anne-Marie Baker, Joey L. Mead
University of Massachusetts
Lowell, Massachusetts
1.1 INTRODUCTION
Plastics are an important part of everyday life; products made from plastics range from so-
phisticated products, such as prosthetic hip and knee joints, to disposable food utensils.
One of the reasons for the great popularity of plastics in a wide variety of industrial appli-
cations is the tremendous range of properties exhibited by plastics and their ease of pro-
cessing. Plastic properties can be tailored to meet specific needs by varying the atomic
composition of the repeat structure, by varying molecular weight and molecular weight
distribution. The flexibility can also be varied through the presence of side chain branch-
ing, via the lengths and polarities of the side chains. The degree of crystallinity can be con-
trolled through the amount of orientation imparted to the plastic during processing,
through copolymerization, blending with other plastics, and through the incorporation of
an enormous range of additives (fillers, fibers, plasticizers, stabilizers). Given all of the av-
enues available for tailoring any given polymer, it is not surprising that the variety of
choices available to us today exist.
Polymeric materials have been used since early times even though their exact nature
was unknown. In the 1400s, Christopher Columbus found natives of Haiti playing with
balls made from material obtained from a tree. This was natural rubber, which became an
important product after Charles Goodyear discovered that the addition of sulfur dramati-
cally improved the properties; however, the use of polymeric materials was still limited to
natural-based materials. The first true synthetic polymers were prepared in the early 1900s
using phenol and formaldehyde to form resins—Baekeland’s Bakelite. Even with the de-
velopment of synthetic polymers, scientists were still unaware of the true nature of the ma-
terials they had prepared. For many years, scientists believed they were colloids—a
substance that is an aggregate of molecules. It was not until the 1920s that Herman
Staudinger showed that polymers were giant molecules or macromolecules. In 1928,
Carothers developed linear polyesters and then polyamides, now known as nylon. In the
1950s, Ziegler and Natta’s work on anionic coordination catalysts led to the development
of polypropylene, high-density, linear polyethylene, and other stereospecific polymers.
More recent developments include Metallocene catalysts for preparation of stereospecific
polymers and the use of polymers in nanotechnology applications.
Downloaded from Digital Engineering Library @ McGraw-Hill (www.digitalengineeringlibrary.com)
Copyright © 2006 The McGraw-Hill Companies. All rights reserved.
Any use is subject to the Terms of Use as given at the website.
Source: Handbook of Plastics Technologies
1.2
CHAPTER 1
Materials are often classified as either metals, ceramics, or polymers. Polymers differ
from the other materials in a variety of ways but generally exhibit lower densities, thermal
conductivities, and moduli. Table 1.1 compares the properties of polymers to some repre-
sentative ceramic and metallic materials. The lower densities of polymeric materials offer
an advantage in applications where lighter weight is desired. The use of additives allows
the compounder to develop a host of materials for specific application. For example, the
addition of conducting fillers generates materials from insulating to conducting. As a re-
sult, polymers may find application in EMI shielding and antistatic protection.
Polymeric materials are used in a vast array of products. In the automotive area, they
are used for interior parts and in under-the-hood applications. Packaging applications are a
large area for thermoplastics, from carbonated beverage bottles to plastic wrap. Applica-
tion requirements vary widely but, luckily, plastic materials can be synthesized to meet
these varied service conditions. It remains the job of the part designer to select from the ar-
ray of thermoplastic materials available to meet the required demands.
1.2 POLYMER STRUCTURE AND SYNTHESIS
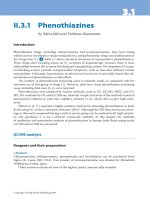
A polymer is prepared by stringing together a low molecular weight species (monomer;
e.g., ethylene) into an extremely long chain (polymer; in the case of ethylene, the polymer
is polyethylene) much as one would string together a series of bead to make a necklace
(see Fig. 1.1). The chemical characteristics of the starting low molecular weight species
will determine the properties of the final polymer. When two low different molecular
TABLE 1.1 Properties of Selected Materials
48
Material
Specific
gravity
Thermal
conductivity,
Joule cm/(°C cm
2
s)
Electrical
resistivity,
µΩ cm
Modulus,
MPa
Aluminum 2.7 2.2 2.9 70,000
Brass 8.5 1.2 6.2 110,000
Copper 8.9 4.0 1.7 110,000
Steel (1040) 7.85 0.48 17.1 205,000
Al
2
O
3
3.8 0.29 >10
14
350,000
Concrete 2.4 0.01 – 14,000
Borosilicate glass 2.4 0.01 >10
17
70,000
MgO 3.6 – 10
5
(2000° F) 205,000
Polyethylene (H.D.) 0.96 0.0052 10
14
–10
18
350–1,250
Polystyrene 1.05 0.0008 10
18
2,800
Polymethyl methacry-
late
1.2 0.002 10
16
3,500
Nylon 1.15 0.0025 10
14
2,800
Downloaded from Digital Engineering Library @ McGraw-Hill (www.digitalengineeringlibrary.com)
Copyright © 2006 The McGraw-Hill Companies. All rights reserved.
Any use is subject to the Terms of Use as given at the website.
INTRODUCTION TO POLYMERS AND PLASTICS
INTRODUCTION TO POLYMERS AND PLASTICS
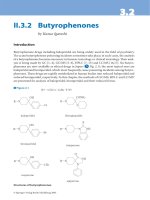
1.3
weight species are polymerized, the resulting polymer is termed a copolymer—for exam-
ple, ethylene vinylacetate. This is depicted in Fig. 1.2. Plastics can also be classified as ei-
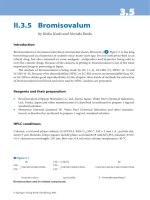
ther thermoplastics or thermosets. A thermoplastic material is a high molecular weight
polymer that is not crosslinked. It can exist in either a linear or branched structure. Upon
heating, thermoplastics soften and melt, allowing them to be shaped using plastics pro-
cessing equipment. A thermoset has all of the chains tied together with covalent bonds in a
three-dimensional network (crosslinked). Thermoset materials will not flow once
crosslinked, but a thermoplastic material can be reprocessed simply by heating it to the ap-
propriate temperature. The different types of structures are shown in Fig. 1.3. The proper-
ties of different polymers can vary widely; for example, the modulus can vary from 1 MN/
m
2
to 50 GN/m
2
. For a given polymer, it is also possible to vary the properties simply by
varying the microstructure of the material.
There are two primary polymerization approaches: step-reaction polymerization and
chain-reaction polymerization.
1
In step-reaction (also referred to as condensation poly-
merization), reaction occurs between two polyfunctional monomers, often liberating a
small molecule such as water. As the reaction proceeds higher molecular weight species
are produced as longer and longer groups react together. For example, two monomers can
react to form a dimer then react with another monomer to form a trimer. The reaction can
be described as n-mer + m-mer → (n + m)mer, where n and m refer to the number of
monomer units for each reactant. Molecular weight of the polymer builds up gradually
with time, and high conversions are usually required to produce high molecular weight
FIGURE 1.1 Polymerization.
FIGURE 1.2 Copolymer structure.
FIGURE 1.3 Linear, branched, and cross-linked polymer struc-
tures.
Downloaded from Digital Engineering Library @ McGraw-Hill (www.digitalengineeringlibrary.com)
Copyright © 2006 The McGraw-Hill Companies. All rights reserved.
Any use is subject to the Terms of Use as given at the website.
INTRODUCTION TO POLYMERS AND PLASTICS
1.4
CHAPTER 1
polymers. Polymers synthesized by this method typically have atoms other than carbon in
the backbone. Examples include polyesters and polyamides.
Chain-reaction polymerizations (also referred to as addition polymerizations) require
an initiator for polymerization to occur. Initiation can occur by a free radical, an anionic,
or a cationic species. These initiators open the double bond of a vinyl monomer, and the
reaction proceeds as shown above in Fig. 1.1. Chain-reaction polymers typically contain
only carbon in their backbone and include such polymers as polystyrene and polyvinyl
chloride.
Unlike low molecular weight species, polymeric materials do not possess one unique
molecular weight but rather a distribution of weights as depicted in Fig. 1.4. Molecular
weights for polymers are usually described by two different average molecular weights,
the number average molecular weight, , and the weight average molecular weight,
. These averages are calculated using the equations below:
(1.1)
(1.2)
where ni is the number of moles of species i, and Mi is the molecular weight of species i.
The processing and properties of polymeric materials are dependent on the molecular
weights of the polymer as well as the molecular weight distribution. The molecular weight
of a polymer can be determined by a number of techniques including light scattering, solu-
tion viscosity, osmotic pressure, and gel permeation chromatography.
1.3 SOLID PROPERTIES OF POLYMERS
1.3.1 Glass Transition Temperature (T
g
)
Polymers come in many forms, including plastics, rubber, and fibers. Plastics are stiffer
than rubber yet have reduced low-temperature properties. Generally, a plastic differs from
a rubbery material due to the location of its glass transition temperature (T
g
). A plastic has
M
n
M
w
M
n
n
i
M
i
n
i
i 1=
∞
∑
=
M
w
n
i
M
i
2
n
i
M
i
i 1=
∞
∑
=
FIGURE 1.4 Molecular weight distribution.
Downloaded from Digital Engineering Library @ McGraw-Hill (www.digitalengineeringlibrary.com)
Copyright © 2006 The McGraw-Hill Companies. All rights reserved.
Any use is subject to the Terms of Use as given at the website.
INTRODUCTION TO POLYMERS AND PLASTICS
INTRODUCTION TO POLYMERS AND PLASTICS
1.5
a T
g
above room temperature, while a rubber has a T
g
below room temperature. T
g
is most
clearly defined by evaluating the classic relationship of elastic modulus to temperature for
polymers as presented in Fig. 1.5.
At low temperatures, the material can best be described as a glassy solid. It has a high
modulus, and behavior in this state is characterized ideally as a purely elastic solid. In this
temperature regime, materials most closely obey Hooke’s law:
(1.3)
where σ is the stress being applied, and ε is the strain. Young’s modulus, E, is the propor-
tionality constant relating stress and strain.
In the leathery region, the modulus is reduced by up to three orders of magnitude from
the glassy modulus for amorphous polymers. The temperature at which the polymer be-
havior changes from glassy to leathery is known as the glass transition temperature, T
g
.
The rubbery plateau has a relatively stable modulus until further temperature increases in-
duce rubbery flow. Motion at this point does not involve entire molecules but, in this re-
gion, deformations begin to become nonrecoverable as permanent set takes place. As
temperature is further increased, the onset of liquid flow eventually takes place. There is
little elastic recovery in this region, and the flow involves entire molecules slipping past
each other. This region models ideal viscous materials, which obey Newton’s law:
(1.4)
In the case of a thermosetting material, the rubbery plateau is extended until degradation
and no liquid flow will occur.
1.3.2 Crystallization and Melting Behavior (T
m
)
In its solid form, a polymer can exhibit different morphologies, depending on the structure
of the polymer chain as well as the processing conditions. The polymer may exist in a ran-
FIGURE 1.5 Relationship between elastic modulus and temperature.
σ Eε=
σηε
˙
=
Downloaded from Digital Engineering Library @ McGraw-Hill (www.digitalengineeringlibrary.com)
Copyright © 2006 The McGraw-Hill Companies. All rights reserved.
Any use is subject to the Terms of Use as given at the website.
INTRODUCTION TO POLYMERS AND PLASTICS
1.6
CHAPTER 1
dom unordered structure termed amorphous. An example of an amorphous polymer is
polystyrene. If the structure of the polymer backbone is a regular, ordered structure, then
the polymer can tightly pack into an ordered crystalline structure, although the material
will generally be only semicrystalline. Examples are polyethylene and polypropylene. The
exact makeup and architecture of the polymer backbone will determine whether the poly-
mer is capable of crystallizing. This microstructure can be controlled by different syn-
thetic methods. As mentioned above, the Ziegler-Natta catalysts are capable of controlling
the microstructure to produce stereospecific polymers. The types of microstructure that
can be obtained for a vinyl polymer are shown in Fig. 1.6. The isotactic and syndiotactic
structures are capable of crystallizing because of their highly regular backbone, while the
atactic form would produce an amorphous material. The amount of crystallinity actually
present in the polymer depends on a number of factors, including the rate of cooling, crys-
tallization kinetics, and the crystallization temperature. Thus, the extent of crystallization
can vary greatly for a given polymer and can be controlled through processing conditions.
1.4 MECHANICAL PROPERTIES
The mechanical behavior of polymers is dependent on many factors, including polymer
type, molecular weight, and test procedure. Modulus values are obtained from a standard
tensile test with a given rate of crosshead separation. In the linear region, the slope of a
stress-strain curve will give the elastic or Young’s modulus, E. Typical values for Young’s
modulus are given in Table 1.2. Polymeric material behavior may be affected by other fac-
FIGURE 1.6 Isotactic, syndiotactic, and atactic polymer chains.
Downloaded from Digital Engineering Library @ McGraw-Hill (www.digitalengineeringlibrary.com)
Copyright © 2006 The McGraw-Hill Companies. All rights reserved.
Any use is subject to the Terms of Use as given at the website.
INTRODUCTION TO POLYMERS AND PLASTICS
1.7
TABLE 1.2 Comparative Properties of Thermoplastics
49,50
Material
Heat deflection
temperature
@ 1.82 MPa (°C)
Tensile
strength, MPa
Tensile
modulus, GPa
Impact
strength, J/m
Density.
g/cm
3
Dielectric
strength, MV/m
Dielectric
constant @ 60 Hz
ABS 99 41 2.3 347 1.18 15.7 3.0
CA 68 37.6 1.26 210 1.30 16.7 5.5
CAB 69 34 .88 346 1.19 12.8 4.8
PTFE 17.1 .36 173 2.2 17.7 2.1
PCTFE 50.9 1.3 187 2.12 22.2 2.6
PVDF 90 49.2 2.5 202 1.77 10.2 10.0
PB 102 25.9 0.18 NB 0.91 2.25
LDPE 43 11.6 0.17 NB 0.92 18.9 2.3
HDPE 74 38.2 373 0.95 18.9 2.3
PMP 23.6 1.10 128 0.83 27.6
PI 42.7 3.7 320 1.43 12.2 4.1
PP 102 35.8 1.6 43 0.90 25.6 2.2
PUR 68 59.4 1.24 346 1.18 18.1 6.5
PS 93 45.1 3.1 59 1.05 19.7 2.5
PVC—rigid 68 44.4 2.75 181 1.4 34.0 3.4
PVC—flexible 9.6 293 1.4 25.6 5.5
Downloaded from Digital Engineering Library @ McGraw-Hill (www.digitalengineeringlibrary.com)
Copyright © 2006 The McGraw-Hill Companies. All rights reserved.
Any use is subject to the Terms of Use as given at the website.
INTRODUCTION TO POLYMERS AND PLASTICS
1.8
POM 136 69 3.2 133 1.42 19.7 3.7
PMMA 92 72.4 3 21 1.19 19.7 3.7
Polyarylate 155 68 2.1 288 1.19 15.2 3.1
LCP 311 110 11 101 1.70 20.1 4.6
Nylon 6 65 81.4 2.76 59 1.13 16.5 3.8
Nylon 6,6 90 82.7 2.83 53 1.14 23.6 4.0
PBT 54 52 2.3 53 1.31 15.7 3.3
PC 129 69 2.3 694 1.20 15 3.2
PEEK 160 93.8 3.5 59 1.32
PEI 210 105 3 53 1.27 28 3.2
PES 203 84.1 2.6 75 1.37 16.1 3.5
PET 224 159 8.96 101 1.56 21.3 3.6
PPO (modified) 100 54 2.5 267 1.09 15.7 3.9
PPS 260 138 11.7 69 1.67 17.7 3.1
PSU 174 73.8 2.5 64 1.24 16.7 3.5
TABLE 1.2 Comparative Properties of Thermoplastics (Continued)
49,50
Material
Heat deflection
temperature
@ 1.82 MPa (°C)
Tensile
strength, MPa
Tensile
modulus, GPa
Impact
strength, J/m
Density.
g/cm
3
Dielectric
strength, MV/m
Dielectric
constant @ 60 Hz
Downloaded from Digital Engineering Library @ McGraw-Hill (www.digitalengineeringlibrary.com)
Copyright © 2006 The McGraw-Hill Companies. All rights reserved.
Any use is subject to the Terms of Use as given at the website.
INTRODUCTION TO POLYMERS AND PLASTICS
INTRODUCTION TO POLYMERS AND PLASTICS
1.9
tors such as test temperature and rates. This can be especially important to the designer
when the product is used or tested at temperatures near the glass transition temperature,
where dramatic changes in properties occur as depicted in Fig. 1.5. The time-dependent
behavior of these materials is discussed below.
1.4.1 Viscoelasticity
Polymer properties exhibit time-dependent behavior, meaning that the measured proper-
ties are dependent on the test conditions and polymer type. Figure 1.7 shows a typical vis-
coelastic response of a polymer to changes in testing rate or temperature. Increases in
testing rate or decreases in temperature cause the material to appear more rigid, while an
increase in temperature or decrease in rate will cause the material to appear softer. This
time-dependent behavior can also result in long-term effects such as stress-relaxation or
creep.
2
These two time-dependent behaviors are shown in Fig. 1.8. Under a fixed displace-
ment, the stress on the material will decrease over time, termed stress relaxation. This be-
havior can be modeled using a spring and dashpot in series as depicted in Fig. 1.9. The
equation for the time dependent stress using this model is
(1.5)
FIGURE 1.7 Effect of strain rate or tempera-
ture on mechanical behavior.
FIGURE 1.8 Creep and stress relaxation behavior.
σ t() σ
o
e
t– τ⁄
=
Downloaded from Digital Engineering Library @ McGraw-Hill (www.digitalengineeringlibrary.com)
Copyright © 2006 The McGraw-Hill Companies. All rights reserved.
Any use is subject to the Terms of Use as given at the website.
INTRODUCTION TO POLYMERS AND PLASTICS
1.10
CHAPTER 1
where τ is the characteristic relaxation time (η/k). Under a fixed load, the specimen will
continue to elongate with time, a phenomenon termed creep, which can be modeling using
a spring and dashpot in parallel as seen in Fig. 1.9. This model predicts the time-dependent
strain as
(1.6)
For more accurate prediction of the time-dependent behavior, other models with more
elements are often employed. In the design of polymeric products for long-term applica-
tions, the designer must consider the time-dependent behavior of the material.
If a series of stress relaxation curves is obtained at varying temperatures, it is found
that these curves can be superimposed by horizontal shifts to produce a master curve.
3
This demonstrates an important feature in polymer behavior: the concept of time-tempera-
ture equivalence. In essence, a polymer at temperatures below room temperature will be-
have as if it were tested at a higher rate at room temperature. This principle can be applied
to predict material behavior under testing rates or times that are not experimentally acces-
sible through the use of shift factors (aT) and the equation below:
(1.7)
where T
g
is the glass transition temperature of the polymer.
1.4.2 Failure Behavior
The design of plastic parts requires the avoidance of failure without overdesign of the part,
leading to increased part weight. The type of failure can depend on temperatures, rates,
and materials. Some information on material strength can be obtained from simple tensile
stress-strain behavior. Materials that fail at rather low elongations (1 percent strain or less)
can be considered to have undergone brittle failure.
4
Polymers that produce this type of
FIGURE 1.9 Spring and dashpot models.
ε t() ε
o
e
t– τ⁄
=
a
T
ln
t
t
o
⎝⎠
⎛⎞
ln
17.44 TT
g
–()
51.6 TT
g
–+
–==
Downloaded from Digital Engineering Library @ McGraw-Hill (www.digitalengineeringlibrary.com)
Copyright © 2006 The McGraw-Hill Companies. All rights reserved.
Any use is subject to the Terms of Use as given at the website.
INTRODUCTION TO POLYMERS AND PLASTICS
INTRODUCTION TO POLYMERS AND PLASTICS 1.11
failure include general purpose polystyrene and acrylics. Failure typically starts at a defect
where stresses are concentrated. Once a crack is formed, it will grow as a result of stress
concentrations at the crack tip. Many amorphous polymers will also exhibit what are
called crazes. Crazes appear to look like cracks, but they are load bearing, with fibrils of
material bridging the two surfaces as shown in Fig. 1.10. Crazing is a form of yielding
and, when present, can enhance the toughness of a material.
Ductile failure of polymers is exhibited by yielding of the polymer or slip of the molec-
ular chains past one another. This is most often indicated by a maximum in the tensile
stress-strain test or what is termed the yield point. Above this point, the material may ex-
hibit lateral contraction upon further extension, termed necking.
5
Molecules in the necked
region become oriented and result in increased local stiffness. Material in regions adjacent
to the neck are thus preferentially deformed, and the neck region propagates. This process
is known as cold-drawing (see Fig. 1.11). Cold drawing results in elongations of several
hundred percent.
Under repeated cyclic loading, a material may fail at stresses well below the single-cy-
cle failure stress found in a typical tensile test.
6
This process is called fatigue and is usu-
ally depicted by plotting the maximum stress versus the number of cycles to failure.
FIGURE 1.10 Cracks and crazes.
FIGURE 1.11 Ductile behavior.
Downloaded from Digital Engineering Library @ McGraw-Hill (www.digitalengineeringlibrary.com)
Copyright © 2006 The McGraw-Hill Companies. All rights reserved.
Any use is subject to the Terms of Use as given at the website.
INTRODUCTION TO POLYMERS AND PLASTICS
1.12 CHAPTER 1
Fatigue tests can be performed under a variety of loading conditions as specified by the
service requirements. Thermal effects and the presence or absence of cracks are other vari-
ables to be considered when the fatigue life of a material is to be evaluated.
1.4.3 Effect of Fillers
The term fillers refers to solid additives, which are incorporated into the plastic matrix.
7
They are generally inorganic materials and can be classified according to their effect on
the mechanical properties of the resulting mixture. Inert or extender fillers are added
mainly to reduce the cost of the compound, whereas reinforcing fillers are added to im-
prove certain mechanical properties such as modulus or tensile strength. Although termed
inert, inert fillers can nonetheless affect other properties of the compound besides cost. In
particular, they may increase the density of the compound, reduce the shrinkage, increase
the hardness, and increase the heat deflection temperature. Reinforcing fillers typically
will increase the tensile, compressive, and shear strengths, increase the heat deflection
temperature, reduce shrinkage, increase the modulus, and improve the creep behavior. Re-
inforcing fillers improve the properties via several mechanisms. In some cases, a chemical
bond is formed between the filler and the polymer; in other cases, the volume occupied by
the filler affects the properties of the thermoplastic. As a result, the surface properties and
interaction between the filler and the thermoplastic are of great importance. A number of
filler properties govern their behavior, including the particle shape, the particle size and
distribution of sizes, and the surface chemistry of the particle. In general, the smaller the
particle, the greater the improvement in the mechanical property of interest (such as ten-
sile strength).
8
Larger particles may give reduced properties compared to the pure thermo-
plastic. Particle shape can also influence the properties. For example, plate-like particles or
fibrous particles may be oriented during processing, resulting in anisotropic properties.
The surface chemistry of the particle is also important to promote interaction with the
polymer and to allow for good interfacial adhesion. The polymer should wet the particle
surface and have good interfacial bonding so as to obtain the best property enhancement.
Examples of inert or extender fillers include: china clay (kaolin), talc, and calcium car-
bonate. Calcium carbonate is an important filler, with a particle size of about 1 µm.
9
It is a
natural product from sedimentary rocks and is separated into chalk, limestone, and marble.
In some cases, the calcium carbonate may be treated to improve interaction with the ther-
moplastic. Glass spheres are also used as thermoplastic fillers. They may be either solid or
hollow, depending on the particular application. Talc is a filler with a lamellar particle
shape.
10
It is a natural, hydrated magnesium silicate with good slip properties. Kaolin and
mica are also natural materials with lamellar structures. Other fillers include wollastonite,
silica, barium sulfate, and metal powders. Carbon black is used as a filler primarily in the
rubber industry, but it also finds application in thermoplastics for conductivity, for UV
protection, and as a pigment. Fillers in fiber form are often used in thermoplastics. Types
of fibers include cotton, wood flour, fiberglass, and carbon. Table 1.3 shows the fillers and
their forms. An overview of some typical fillers and their effect on properties is shown in
Table 1.4. Considerable research interest exists for the incorporation of nanoscale fillers
into polymers. This aspect will be discussed in later chapters.
1.5 Rheological Properties
Viscosity is the resistance to flow. As shown in Table 1.5, polymer melts have viscosities
of 100 to 1,000,000 Pa-s, whereas water has a viscosity of 0.001 Pa-s.
11
These high vis-
cosities result from the long polymer chains and cause the polymer melt to exhibit laminar
Downloaded from Digital Engineering Library @ McGraw-Hill (www.digitalengineeringlibrary.com)
Copyright © 2006 The McGraw-Hill Companies. All rights reserved.
Any use is subject to the Terms of Use as given at the website.
INTRODUCTION TO POLYMERS AND PLASTICS
INTRODUCTION TO POLYMERS AND PLASTICS 1.13
flow; that is, the melt moves in layers. Although, these melt layers may move at the same
velocity, thereby producing plug flow, the melt layers typically flow at different the differ-
ent velocities to provide shear. Changes in the cross-sectional area of the melt channel or
drawing processes stretch or allow relaxation of the polymer chains, giving rise to elonga-
tion or extension.
The shear viscosity of polymer melts generally decreases with increasing shear rate.
This pseudoplastic behavior contrasts with the shear-rate independent viscosity of fluids,
such as water, solvents, and oligomers. The decrease in the viscosity of pseudoplastic flu-
ids, however, does not occur immediately. At low shear rates, the polymer molecules flow
as random coils, and the constant viscosity is called the zero-shear rate viscosity (η
o
).
With increasing shear rate, the polymer chains align in the direction of flow, and the vis-
cosity decreases (Fig. 1.12). The shear rate corresponding to the onset of chain alignment
or shear thinning increases with decreasing polymer molecular weight. When the viscosity
decreases is proportional to the increase in shear rate, the viscosity can be modeled us-
ing:
12
(1.8)
where k is the consistency index and n is the power law index. The power law index is an
indicator of a material’s sensitivity to shear (rate), or the degree of non-Newtonian behav-
ior. For Newtonian fluids n = 1, and for pseudoplastic fluids n < 1, with smaller values in-
dicating greater shear sensitivity. Since shear rate varies considerably with the processing
method (Table 1.6),
13
the degree of alignment, shear thinning, and material relaxation var-
ies considerably with the process. Compression and rotational molding typically induce
very little alignment of the polymer chains and thus produce low levels of orientation and
retained stress. In contrast, the polymer chains are highly oriented during injection
molded, and such parts exhibit high levels of residual stress.
As illustrated in Fig. 1.12, shear viscosity also decreases with temperature, since the
polymer chains are more mobile. This temperature dependence of viscosity can be ex-
pressed using an Arrhenius equation:
(1.9)
where A is a material constant, E
a
is the activation energy (which varies with polymer and
shear rate), R is a constant, and T is the absolute temperature. Since the activation energy
depends on the difference between a polymer’s processing and glass transition tempera-
TABLE 1.3 Forms of Various Fillers
Spherical Lamellar Fibrous
Sand/quartz powder
Silica
Glass spheres
Calcium carbonate
Carbon black
Metallic Oxides
Mica
Talc
Graphite
Kaolin
Glass fibers
Asbestos
Wollastonite
Carbon fibers
Whiskers
Cellulose
Synthetic fibers
η kγ
˙
n 1–
=
η A
E
a
RT
⎝⎠
⎛⎞
exp=
Downloaded from Digital Engineering Library @ McGraw-Hill (www.digitalengineeringlibrary.com)
Copyright © 2006 The McGraw-Hill Companies. All rights reserved.
Any use is subject to the Terms of Use as given at the website.
INTRODUCTION TO POLYMERS AND PLASTICS
1.14
TABLE 1.4 Effect of Filler Type on Properties
51
Glass fiber
Asbestos
Wollastonite
Carbon fiber
Whiskers
Synthetic fibers
Cellulose
Mica
Talc
Graphite
Sand/quartz powder
Silica
Kaolin
Glass spheres
Calcium carbonate
Metallic oxides
Carbon black
Tensile strength ++ + + –+ + O +
Compressive strength + + + + +
Modulus of elasticity ++ ++ ++ ++ + ++ + + + + + + +
Impact strength –+ – – – – ++ + –+ – – – – – –+ – +
Reduced thermal expansion + + + + + + + + +
Reduced shrinkage + + + + + + + + + + + + + +
Better thermal conductivity + + + + + + + + +
Higher heat deflection temperature ++ + + ++ + + + + +
Electrical conductivity + + +
Electrical resistance + ++ + + ++ +
Thermal stability + + + + + + + +
Chemical resistance + + + O + + +
Better abrasion behavior
+ + + + +
Extrusion rate –+ + + + +
Machine abrasion – O O O O O O – O O O
Price reduction + + + + + + + ++ + + + ++
++ large influence, + influence, O no influence, – negative influence.
Downloaded from Digital Engineering Library @ McGraw-Hill (www.digitalengineeringlibrary.com)
Copyright © 2006 The McGraw-Hill Companies. All rights reserved.
Any use is subject to the Terms of Use as given at the website.
INTRODUCTION TO POLYMERS AND PLASTICS
INTRODUCTION TO POLYMERS AND PLASTICS 1.15
tures, materials such as polyethylene have activation energies less than 20 kJ/mol, whereas
higher-temperature polymers, such as polycarbonate, exhibit activation energies that are
greater than 50 kJ/mol. Pressure increases viscosity, but the effects are relatively insignifi-
cant when the processing pressures are less than 35 MPa (5,000 psi).
14
At higher pres-
sures, the increase in viscosity is given by
15
TABLE 1.5 Typical Viscosities
Material Viscosity (Pa-s)
Air
Water
Polymer latexes
Olive oil
Glycerin
Polymer melts
Pitch
Plastics
Glass
10
–5
10
–3
10
–2
10
–1
1
10
2
– 10
6
10
9
10
12
10
21
TABLE 1.6 Typical Shear Rates for Selected
Processes
52
Process Shear rate (s-1)
Compression molding
Calendering
Extrusion
Injection molding
1–10
10–100
100–1,000
1,000–10,000
FIGURE 1.12 The effect of shear rate and temperature on viscosity, where T
1
> T
2
>
T
3
.
Downloaded from Digital Engineering Library @ McGraw-Hill (www.digitalengineeringlibrary.com)
Copyright © 2006 The McGraw-Hill Companies. All rights reserved.
Any use is subject to the Terms of Use as given at the website.
INTRODUCTION TO POLYMERS AND PLASTICS
1.16 CHAPTER 1
(1.10)
where η
r
is the viscosity at a reference P
r
, and α
p
is an empirical constant with values of
200 to 600 MPa
–1
.
Shear viscosity increases with more rigid polymer structures, higher molecular
weights, and additives such as fillers and fibers. Long chain branching and broader molec-
ular weight distributions increase the shear sensitivity of viscosity. Blending two polymers
can significantly alter polymer viscosity, but the effect depends on the two polymers. Ad-
ditives such as lubricants typically decrease viscosity, whereas the effect of colorants and
impact modifiers varies with type of additive.
In contrast, the effect of strain rate on extensional viscosity varies with the polymer
structure. Branched polymers generally exhibit extensional thickening and a correspond-
ing increase in viscosity. Linear polymers, such as LLDPE, undergo extensional thinning
in which the viscosity decreases as the polymer sample necks. Generally, extensional vis-
cosity is greater than shear viscosity and depends primarily on the molecular weight of the
polymer
1.6 PROCESSING OF THERMOPLASTICS
Processing involves the conversion of the solid polymer into a desirable size and shape.
There are a number of methods to shape the polymer, including injection molding, extru-
sion, thermoforming, blow molding, and rotational molding. The plastic material is heated
to the appropriate temperature for it to flow, the material is shaped, and then it is cooled so
as to preserve the desired shape.
1.6.1 Extrusion
In extrusion operations, a solid thermoplastic material is melted, forced through an orifice
(die) of the desired cross section, and cooled. This method was adapted from metallurgists
who use a similar form of extrusion to process molten aluminum and was first adapted in
1845 by Bewley and Brooman to extrude rubber around cable as a coating.
16
Extrusion
processes are used to continuously produce film and sheet; shapes with uniform cross-sec-
tions, such as PVC pipe, tubes, and garden hose; profile with nonuniform cross-sections,
such as PVC window moldings and gutters; synthetic fibers; polymer coatings for insulat-
ing wire and sealing paper, plastic, and metal packaging.
Although there are many types of extruders, the most common is the single-screw ex-
truder (shown in Fig. 1.13).
17
This extruder consists of a screw in a metal cylinder or bar-
rel. Electrical heater bands and fans that surround the barrel help bring the extruder to
operating temperature during start-up and maintain barrel temperature during operation.
One end of the screw is connected through a thrust bearing and gear box to a drive motor
that rotates the screw in the barrel. The other end is free floating in the barrel. The barrel is
connected to the feed throat, a separate “barrel section,” with an opening called a feed
port, and is connected to the feed hopper. A die adaptor is usually connected to the oppo-
site end of the extruder. A breaker plate and a screen pack are sandwiched between the ex-
truder and die adaptor. The breaker plate provides a seal between the extruder and die,
converts the rotational motion of the melt (in the extruder) to linear motion (for the die),
and supports the screen pack. The screen pack filters the melt, thereby prevent unmelted
resin, degraded polymer, or other contaminants from producing defects in the extruded
products and/or damaging the die.
ηη
r
α
p
PP
r
–()[]exp=
Downloaded from Digital Engineering Library @ McGraw-Hill (www.digitalengineeringlibrary.com)
Copyright © 2006 The McGraw-Hill Companies. All rights reserved.
Any use is subject to the Terms of Use as given at the website.
INTRODUCTION TO POLYMERS AND PLASTICS
INTRODUCTION TO POLYMERS AND PLASTICS 1.17
During extrusion, solid resin in the form of pellets or powder is fed from the hopper,
through the feed port, and into the feed throat of the extruder. The solid resin falls onto the
rotating screw and is packed into a solid bed in the first section of the screw (called the
feed zone). The solid bed is melted as it travels through the middle section (transition
zone) of the screw. The melt is mixed, and pressure is generated in the final section (meter-
ing zone) of the screw. Although the heater bands and cooling fans maintain the barrel at a
set temperature profile, conduction from the barrel walls provides only 10 to 30 percent of
the energy required to melt the resin. The remainder of the energy is generated from the
frictional heat generated by the mechanical motion of the screw; this mechanism is called
viscous dissipation.
Extruder screws are design to accommodate this pattern of packing, melting, and pres-
sure generation. As illustrated in Fig. 1.14, the outside diameter of the screw, which is
measured at the tops of the screw flights, remains constant.
18
The root diameter of the
screw, however, changes. In the feed zone, the root diameter is small so that the large
channel depth (i.e., distance between the outside and root diameters) can accommodate the
packed solid resin particles. The root diameter of the transition or compression zone in-
creases with the distance from the feed zone. This change in channel depth forces the solid
FIGURE 1.13 A single-screw extruder.
FIGURE 1.14 General-purpose extruder screw.
57
Downloaded from Digital Engineering Library @ McGraw-Hill (www.digitalengineeringlibrary.com)
Copyright © 2006 The McGraw-Hill Companies. All rights reserved.
Any use is subject to the Terms of Use as given at the website.
INTRODUCTION TO POLYMERS AND PLASTICS