High Temperature Strain of Metals and Alloys Part 3 pdf
Bạn đang xem bản rút gọn của tài liệu. Xem và tải ngay bản đầy đủ của tài liệu tại đây (409.92 KB, 15 trang )
26 3 Structural Parameters in High-Temperature Deformed Metals
Fig. 3.2 As in Fig. 3.1 at the end of the
steady-state stage.
subgrain sizes D (upper curves) and in their misorientations η are presented
on the same graph. Here and in all following figures each type of symbol
corresponds to one crystallite of the same specimen.
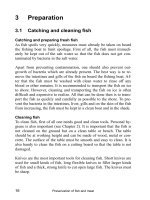
The initial mean size of the subgrains, D, is equal to 3.0µm, in the primary
stage of deformation it decreases to 0.8µm and then is almost unchanged
during the steady-state creep.
Fig. 3.3 Structural parameters versus time and creep curve
for nickel. Tests at temperature T = 673K (0.39 T
m
),
σ = 130MPa (1.7 × 10
−3
µ).
3.1 Evolution of Structural Parameters 27
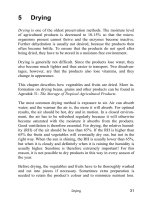
Fig. 3.4 Structural parameters versus time and creep curve
for copper. Tests at temperature T = 610K (0.45 T
m
);
σ =19.6 MPa (4.0 × 10
−4
µ).
The misorientation angle, η, increases from 2 to 5–7mrad. The change in
η is observed during the primary stage. The smaller changes occur in the
crystallite with the larger initial value of η (open circles).
Estimation of the dislocation density in sub-boundaries in conformity with
Eq. (2.16) gives a quantity of the order of 10
13
m
−2
.
Subgrains and sub-boundaries are formed easily in copper, Fig. 3.4 and
Fig. 3.5. The same result is observed under σ =(1.2–2.7) × 10
−4
µ at all
temperatures: the crystallites are reduced to fine cells and sub-boundaries
are formed during the primary stage of creep. The value D decreases and the
angle of misorientation increases. The steady-state strain occurs at almost
constant mean values of both parameters. D and η depend strongly upon
stress; the greater the applied stress the greater the misorientation angles
and the smaller the sub-boundaries’ dimensions.
Thus, the substructure is formed inside crystallites during the primary,
transitive stage of creep. The origin of the steady-state strain coincides with
the end of the substructure formation. These peculiarities are seen well in
Figs. 3.4 and 3.5.
28 3 Structural Parameters in High-Temperature Deformed Metals
Fig. 3.5 Structural parameters versus time and creep curve
for copper. Tests at temperature T = 610K (0.45 T
m
);
σ =29.4 MPa (6.1 × 10
−4
µ).
Processes naturally occur differently in different crystallites. Equilibrium
values of D and η are somewhat distinct. There is a distribution in the size
of these values, however, one may consider the mean values.
The accuracy of the method is of concern. We have used the t-distribution
for evaluation of the relative error of the average values. Accepting a confi-
dence factor of0.9 we find theminimum number of necessary measurements,
n =12. Under these conditions we obtain a mean relative error of 12% for
D and 8% for η. In accordance with this result we usually investigated in situ
at least 3 to 5 crystallites of 3 or 4 specimens of each material under each set
of external conditions (temperature and stress).
The substructure formation during high-temperature strain in vanadium
is shown in Figs. 3.6 and 3.7. The data are obtained at the same temperature
0.6 T
m
, but under different stresses. The rate of steady strain increases from
9 × 10
−7
to 5 × 10
−6
s
−1
.
The change in stress leads to a sharper increase in η and decrease in D.
The values of the structural parameters in this metal are also dependent upon
stress.
3.1 Evolution of Structural Parameters 29
Fig. 3.6 Structural parame-
ters and strain as a function
of time for vanadium. Tests
at temperature T = 1318K
(0.60 T
m
); σ =5.9 MPa
(1.3 × 10
−4
µ).
Fig. 3.7 Structural parame-
ters and strain as a function
of time for vanadium. Tests
at temperature T = 1318K
(0.60 T
m
); σ =9.8 MPa
(2.1 × 10
−4
µ).
The average values of the subgrain size and the subgrain misorientation at
the beginning of the steady-state stage for face-centered metals are listed in
Table 3.1.
30 3 Structural Parameters in High-Temperature Deformed Metals
Tab. 3.1 Average substructure parameters in nickel and copper
at steady-state creep.
Metal T/T
m
T ,K σ/µ, 10
−4
σ, MPa D,µm¯η, mrad
11.0 85 1.9 4.4
0.39 673 17.0 130 1.1 6.0
20.0 152 0.7 5.3
6.7 50 1.4 4.5
Ni 0.51 873 8.9 66 0.9 4.8
9.7 72 0.7 4.5
1.3 10 2.0 5.3
0.62 1073 2.0 14 1.7 6.3
2.7 20 1.0 7.5
3.0 14.7 1.5 3.1
0.45 610 5.1 24.5 1.0 3.8
6.1 29.4 0.6 4.8
1.8 8.8 1.8 3.1
Cu 0.50 678 3.4 16.7 1.2 4.2
4.2 20.6 0.9 4.7
1.2 5.8 1.8 3.5
0.55 746 2.0 9.8 1.7 3.5
2.8 13.7 0.8 5.4
In Table 3.2 the average values of the parameters at the steady-state creep
are presented for three body-centered metals. D and η have the same order in
various metals. D tends to increase with temperature. The value of η increases
when the applied stress rises.
In Fig. 3.8 one can see the effect of stress on the average subgrain size in
nickel. The dependence is almost linear.
Investigations of single-phase two-component alloys Ni–9.5Cr (at.%),
Ni–9.9Al, Ni–10.1 Co, Ni–9.5W do not show any qualitative differences in
the structure evolution from that in the pure metals. The formation of sub-
structure inside crystallites also occurs in the substitutional solid solutions
at the primary stage. However, solid solutions differ in having greater initial
values of η. In solid solutions one observes, at the stationary deformation,
greater values of η than in pure metals.
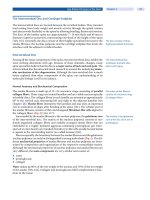
3.2
Dislocation Structure
Some regularities are revealed as the result of systematic examination of
the bright- and dark-field image pictures and diffraction patterns of a large
number of specimens. Most of the dislocations in specimens after high-
temperature testsareassociated in sub-boundaries. Theparallel sub-boundary
3.2 Dislocation Structure 31
Tab. 3.2 Average substructure parameters in niobium, vanadium and α-iron at the
steady-state creep.
Metal T/T
m
T ,K σ/µ, 10
−4
σ, MPa D,µm¯η, mrad
7.8 29.4 1.3 2.9
0.50 1370 9.4 35.3 1.3 3.3
12.0 44.1 1.2 3.3
4.6 17.2 1.5 2.4
Nb 0.55 1508 7.2 27.0 1.3 2.5
7.6 28.4 1.1 3.4
2.1 7.8 1.6 2.2
0.60 1645 2.6 9.8 1.3 2.7
3.1 11.8 1.1 3.2
5.3 24.5 1.9 3.6
0.50 1096 6.3 29.4 1.5 4.1
7.4 34.3 0.8 4.4
2.6 12.8 2.2 4.3
V 0.55 1206 3.7 17.2 1.6 4.5
4.2 19.6 1.4 4.6
1.3 5.9 1.8 4.1
0.60 1318 1.7 7.8 1.5 5.6
2.1 9.8 1.2 5.1
0.7 6.0 1.5 3.8
0.51 923 1.3 11.0 1.6 4.4
Fe 1.7 14.0 0.8 4.5
0.4 3.0 1.5 3.5
0.54 973 0.7 6.0 1.4 3.8
1.2 10.0 1.2 3.9
dislocations are situated at an equal distance from each other. It follows
from the results of the Burgers vector determinations and from the repeat-
ing structural configurations that the parallel sub-boundary dislocations have
the same sign. Two intersected dislocation systems are often observed inside
sub-boundaries. These systems form the small-angle boundary.
The electron micrographs of typical subgrains and sub-boundaries in nio-
bium are presented in Fig. 3.9. Creep tests were carried out until the second
stage of creep was reached. In Fig. 3.9(a) the Burgers vector of the dislocations
is
b = a[
¯
100], i.e. it is directed along the rib of the elementary cell of the cubic
body-centered crystal lattice. The plane of the foil is the face (100).
Figure 3.10 illustrates the dislocation sub-boundary in α-iron. Two systems
of dislocations, which intersect each other at right angles, are observed. Dislo-
cation lines are parallel to face diagonals, i.e. they are directed along crystalline
directions [110] and [1
¯
10]. One of the systems is inclined noticeably to the foil
plane. This is the cause of an oscillating contrast in the dislocation images.
32 3 Structural Parameters in High-Temperature Deformed Metals
Fig. 3.8 Subgrain dimensions versus applied stress. Nickel
tested at 673K, steady-state stage. Errors of measurements
are shown with vertical bars.
The Burgers vectors were determined to be
b
1
= a/2[111] and
b
2
= a/2[1
¯
11].
Atomic displacements are directed along the body diagonals of the elementary
cubic cell.
The typical small-angle boundary in α-iron, which consists of pure screw
dislocations, is shown in Fig. 3.11. Dislocations form a network with cells
Fig. 3.9 Transmission electron micrographs showing
dislocation sub-boundaries in niobium, which are formed in
the steady-state creep. (a) T = 1370K, σ =44.1MPa;
(b) T = 1233K, σ =39.2MPa. ×39 000.
3.2 Dislocation Structure 33
Fig. 3.10 Transmission electron micrograph showing the
dislocation sub-boundary in α-iron, which is formed in
the steady-state creep. T = 813K and σ =49.0MPa.
The first dislocation system is directed along [110] with
b
1
= a/2[111], the second along [1
¯
10] with
b
2
= a/2[1
¯
11].
The plane of the foil is (2
¯
10). ×84 000.
of hexagonal shape. The dislocation lines are located along directions [1
¯
11],
[
¯
111] and [001]. The Burgers vectors are
b
1
= a/2[1
¯
11] and
b
2
= a/2[
¯
111].
The third side of the network with
b
3
= a[001] appears to be formed as a
result of reaction
b
3
=
b
1
+
b
2
. Hexagonal cells of the other sub-boundary in
iron are seen in pattern (b).
The regular dislocation networks as low-angle sub-boundaries are found to
be typical for the high-temperature tested metals.
Fig. 3.11 Sub-boundaries in α-iron tested at T = 923K and
σ =12.0MPa. (a) The pure screw sub-boundary formed by
dislocations along [1
¯
11], [
¯
111], [001] directions. (b) Network
with hexagonal cells. Plane of foil is (110). ×66 000.
34 3 Structural Parameters in High-Temperature Deformed Metals
3.3
Distances between Dislocations in Sub-boundaries
The distance λ between parallel dislocations of the same sign in a small-angle
boundary can be represented (when η 1, tan η η) by an expression of
the form:
λ =
b
η
(3.1)
where b is the modulus of the Burgers vector.
Two methods were used in this work in order to measure the average
spacing between sub-boundary dislocations. Note the satisfactory fit between
the electron microscopy results and the X-ray data (Table 3.3).
Tab. 3.3 Distances between dislocations in sub-boundaries.
Metal T ,K σ, MPa TEM data X-ray data
λ,nm λ,nm
Ni 1073 14.0 42 ± 545± 3
20.0 34 ± 438± 3
773 50.0 36 ± 234± 3
Fe 813 49.0 59 ± 573± 5
973 11.0 41 ± 269± 7
Nb 1233 39.2 67 ± 13 74 ± 6
1370 29.4 109 ± 14 107 ± 10
44.1 60 ± 394± 6
Cu 746 7.8 87 ± 683± 6
3.4
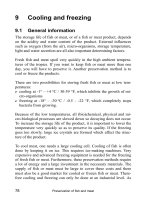
Sub-boundaries as Dislocation Sources and Obstacles
The sub-boundaries that have been formed seem to be sources of slipping dis-
locations. The process of generation of mobile dislocations by sub-boundaries
is readily affected by the applied stress. The TEM technique allows one to
observe the beginning of a dislocation emission. The creation of dislocations
occurs as if the sub-boundary blows the dislocations loops like bubbles. These
loops broaden gradually and move further inside subgrains. One can see this
effect for nickel in Fig. 3.12.
The sub-boundaryinα-iron that generates dislocationsis shown in Fig.3.13.
The subsequent dislocation semi-loops are blown by the ordered boundary.
3.5 Dislocations inside Subgrains 35
Fig. 3.12 Transmission electron micrographs showing the
dislocation sub-boundary as a source of mobile dislocations
in nickel. T = 1073K; σ =20MPa. ×48 000.
Fig. 3.13 Emission of dislocation
loops from the sub-boundary in α-
iron. Tests at 813K and σ =49MPa.
×66 000.
At the same time sub-boundaries act as obstacles for moving dislocations.
One can often observe a sequence of dislocation lines which are pressed to
the sub-boundary and these can enter the boundary.
3.5
Dislocations inside Subgrains
Some dislocations, which are observed in specimens after the high-tempera-
ture deformation, are not associated in sub-boundaries. They are located in-
side subgrains and have the Burgers vector a/2 < 111 > in metals with the
body-centered crystal lattice, i.e. α-iron, vanadium, and niobium. The slip
plane is generally of the {110} type. Screw dislocations are observed, as well
36 3 Structural Parameters in High-Temperature Deformed Metals
Fig. 3.14 Dislocations inside subgrains in niobium tested
at T = 1370K and σ =44.1MPa. s, Screw dislocations;
j, jogs; h, helicoids; l, vacancy loops. ×26 000.
as edge or mixed ones. Screw dislocations are located at the left-hand side
of Fig. 3.14 (marked with the letter s). These dislocations have the Burgers
vectora/2 < 111 > and are found to be in the {
¯
110}plane. The second family
of screw dislocations is seen on the right-hand side. Bends and kinks in the
dislocations, marked with j, attract one’s attention. They give an impression
that certain points of mobile dislocations are pinned up. This can be easily
seen in the left lower corner of Fig. 3.14 and in other areas marked with the
letter j. These kinks at mobile dislocations turn out to be of great importance
for our understanding of the physical mechanism of the steady-state creep.
Figure 3.15 illustrates the dislocation structure in nickel. Again screw com-
ponents with kinks are observed. Another effect is the appearance of small
dislocation loops. The dark-field technique allows one to conclude that these
are vacancy loops.
There are good reasons to assume that kinks and bends that have been
described by us are jogs. A jog is known to be a segment of a screw dislocation,
which does not lie in its plane of slipping. In fact, the jog is a segment of the
Fig. 3.15 Dislocations inside sub-
grains in nickel tested at T = 1023K
and σ =49.0MPa. s, Screw disloca-
tions; j, jogs. ×48 000.
3.5 Dislocations inside Subgrains 37
edge extra-plane and therefore it can move with the slipping screw dislocation
only with emission or absorption of point defects (vacancies or interstitial
atoms). During movement the jog slows the dislocation and lags behind.
Even the highest resolution of the electron microscope is not sufficient for
direct observation of jogs, since their length is of the order of one interatomic
distance. However, kinks and loops that have been observed in this work
for different metals show convincingly that the formation of jogs takes place
during high-temperature deformation.
Assuming that the kinks and bends in dislocation lines are produced by
jogs we have measured distances z
0
between adjacent bends. The histograms
of these density distributions are presented in Fig. 3.16. Under the mentioned
strain conditions the most probable quantities of z
0
in nickel and niobium
are 4–5 hn and 9–10 hn, respectively.
A comparison of the average distances
¯
λ between sub-boundary disloca-
tions, determined by the X-ray method, and the spacings
z
0
between jogs in
mobile dislocations, measured with the aid of electron microscopy, is given
in Table 3.4. n is the number of measurements of
z
0
values. Confidence in-
tervals by probability 0.95 are also shown in the table. The two values are
close to each other. In our opinion, the new experimental result that has been
obtained
¯z
0
≈
¯
λ (3.2)
is of great importance for our understanding of the physical mechanism of
high-temperature deformation.
Fig. 3.16 Histograms of the distribution of distances
between jogs in screw components of dislocations: (a)
nickel, 1073K, 14.0MPa, number of measurements n = 129;
(b) niobium, 1645K, 11.8MPa, n = 185.
38 3 Structural Parameters in High-Temperature Deformed Metals
Tab. 3.4 Comparison of average distances z
0
between jogs
in mobile dislocations and of average distances
¯
λ between
subgrain dislocations. n is the number of measurements.
Metal T ,K σ,MPa
¯
λ,nm z
0
,nm n
29.4 107 ± 10 120 ± 10 75
1370 35.3 94 ± 6 100 ± 8 94
44.1 94 ± 697± 12 24
Nb 1508 17.2 130 ± 10 120 ± 10 120
28.4 92 ± 795± 11 37
1645 9.8 120 ± 10 93 ± 9 68
11.8 97 ± 895± 9 185
V 1096 24.5 80 ± 890± 8 115
34.3 67 ± 660± 7 35
673 110.0 55 ± 356± 5 85
140.0 50 ± 348± 3 211
50.0 63 ± 667± 7 60
Ni 873 58.0 58 ± 454± 5 125
72.0 58 ± 446± 5 75
10.0 54 ± 565± 5 96
1073 14.0 45 ± 348± 4 129
20.0 38 ± 345± 7 85
873 25.0 64 ± 563± 5 78
Fe 30.0 60 ± 453± 5 88
923 6.0 71 ± 576± 12 45
Cu 746 7.8 87 ± 683± 7 46
The density of dislocations, which are not associated in sub-boundaries,
N, has been measured, and the results are presented in Table 3.5. Disloca-
tion densities during the high-temperature deformation for the metals under
study are estimated to be from 10
11
m
−2
to 10
12
m
−2
.
Tab. 3.5 The density of dislocations inside subgrains.
Metal T ,K σ,MPa N, 10
11
m
−2
Metal T ,K σ,MPa N, 10
11
m
−2
29.4 2.4 24.9 1.6
873 68.7 5.7 1370 29.4 3.1
Ni 98.1 9.5 Nb 35.3 3.8
1023 9.8 1.3 1508 17.2 2.9
40.0 6.3 28.4 5.3
Cu 678 8.8 2.2 V 1096 29.4 1.6
20.6 9.6 34.3 1.4
3.6 Vacancy Loops and Helicoids 39
3.6
Vacancy Loops and Helicoids
Closed dislocation loops as well as helicoids are observed very often in the
structure of the high-temperature tested metals. Dark-field analysis makes it
possible to determine the sign and the type of loops. The loops have been
found to be of the vacancy type. Helicoids are known to be formed usually
by screw dislocations under conditions of volume supersaturation by point
crystalline defects. We can see the loops, marked with the letter l, in Fig. 3.14
and also in 3.15. In Fig. 3.17 the typical structures of helixes and vacancy loops
are presented. The helicoid looks like a spiral in electron patterns. The foil
in Fig. 3.17(a) and (b) coincides with the crystal plane (111). One third of the
loops lie in the plane (1
¯
10), but two thirds are in planes (0
¯
11) and (
¯
101). Thus,
vacancy loops are generated in the dislocation slip planes. In Fig. 3.17(c) a
very interesting effect can be observed. Three chains of loops have been left
behind two segments of screw dislocations. These moved in the slip plane
(110). The dislocations have the Burgers vector a[
¯
110]; the loops are of the
vacancy type. One can also see helicoids.
Fig. 3.17 Transmission electron micro-
graphs showing vacancy loops and heli-
coids: (a), (b) Iron tested at T = 973K
and σ =10MPa; ×46 000. (c) Niobium
tested at T = 1508K and σ =17.3MPa;
×39 000.
40 3 Structural Parameters in High-Temperature Deformed Metals
3.7
Total Combination of Structural Peculiarities of High-temperature Deformation
The structural peculiarities can be generalized from the observed facts. Our
experimental data have led to the conclusion that there are several distinctive
structural features of strain (creep) at high temperatures and it turns out that
these features are caused by a certain physical mechanism.
The first distinctive feature is the simultaneous formation of sub-bounda-
ries within crystallites and a decrease in the strain rate ˙ε to an approximately
constant value. Each of the three curves [ε(t), η(t) and D(t)] have a “near-
linear” segment. The abscissae at the start of these segments coincide with
each other. The following conclusion look obvious: it is the process of sub-
structure formation that is the cause of the decrease in the plastic strain rate.
The subgrain dimensions are of theorderof micrometers, one or two orders
less than the grain size in polycrystalline materials. Subgrains are separated
from each other by small-angle boundaries, which give a rotation angle of the
order of several milliradians.
The relative constancy of the average structural parameters
¯
D and ¯η during
the steady-state period is the second essential feature that is intrinsic for face-
centered metals at temperatures of (0.40–0.70) T
m
, and for body-centered
metals at (0.45–0.65) T
m
. The values of
¯
D and ¯η depend upon external pa-
rameters, especially stress.
¯
D decreases, and ¯η increases when σ increases.
One should distinguish between the immobile dislocations associated in
sub-boundaries and the mobile dislocations inside subgrains. Dislocation
sub-boundaries that have been formed are regular networks or ordered junc-
tions. Usually one or two system of parallel equidistant dislocations have been
observed inside small-angle boundaries. The results of the Burgers vector,
b,
determination indicate that the parallel sub-boundary dislocations are of the
same sign. Sub-boundaries contain dislocations with a considerable screw
component. Mixed dislocations along [110] with
b = a/2[111] are characteris-
tic for body-centered metals. Pure screw sub-boundaries have also been found
with
b
1
= a/2[
¯
111] and
b
2
= a/2[1
¯
11]. Screw dislocations and 60-degree dis-
locations have been observed in the structure of face-centered metals. The
presence of a screw component in the boundary structure is the third distinc-
tive feature of the structure of the high-temperature deformed metals.
The fourth peculiarity isasfollows. It is obvious from ourinvestigationsthat
sub-boundaries play a double role. They are both the sources and the obstacles
(sinks) for mobile dislocations. Only the mobile dislocations are known to
make a contribution to the elementary events leading to the deformation of
the specimen.
Some dislocations are located inside subgrains. They move in slip planes
i.e. in planes of the {111} type for the cubic face-centered and the {110}