Physics, Pharmacology and Physiology for Anaesthetists - 4 pdf
Bạn đang xem bản rút gọn của tài liệu. Xem và tải ngay bản đầy đủ của tài liệu tại đây (461.14 KB, 26 trang )
Cardiac output measurement
The Fick principle
The total uptake or release of a substance by an organ is equal to the product
of the blood flow to the organ and the arterio-venous concentration difference
of the substance.
This observation is used to calculate cardiac output by using a suitable marker
substance such as oxygen, heat or dye and the following equation:
˙
Vo
2
¼ CO ðCao
2
À C
¯
vo
2
Þ
so
CO ¼
˙
Vo
2
=ðCao
2
À C
¯
vo
2
Þ
where
˙
V
O
2
is the oxygen uptake, CO is cardiac output,
C
aO
2
is arterial O
2
content and
C
¯
v
O
2
is mixed venous O
2
content.
Thermodilution and dye dilution
A marker substance is injected into a central vein. A peripheral arteri al line is used
to measure the amount of the substance in the arterial system. A graph of
concentration versus time is produced and patented algorithms based on the
Stewart–Hamilton equation (below) are used to calculate the cardiac output.
When dye dilution is used, the graph of concentration versus time may show a
second peak as dye recirculates to the measuring device. This is known as a
recirculation hump and does not occur when thermodilution methods are used.
Stewart–Hamilton equation
If the mass of marker is known and its concentration is measured, the volume
into which it was given can be calculated as
V ¼ M=C
If concentration is measured over time, flow can be calculated as
Flow ¼ M=ðC:DtÞ
where M is mass, V is volume and C is concentration. A special form of the
equation used with thermodilution is
Flow ¼
V
inj
ðT
b
À T
t
Þ:K
T
blood
ðtÞt
where the numerator represents the ‘mass’ of cold and the denominator
represents the change in blood temperature over time; K represents computer
constants.
Dye dilution graphs
Time (s)
0 5 10 15 20
Concentration
Draw a curve starting at the origin that reaches its maximum value at around
5 s. The curve then falls to baseline but is interrupted by a recirculation hump
at around 15 s. This is caused by dye passing completely around the vascu-
lature and back to the sensor a second time.
Time (s)
AUC
0 5 10 15 20
Log
10
concentration
Demonstrate that the semi-log plot makes the curve more linear during its rise
and fall from baseline. The recirculation hump is still present but is discounted
by measuring the area under the curve (AUC) enclosed by a tangent from the
initial down stroke. This is the AUC that is used in the calculations.
Cardiac output measurement 65
Thermodilution graphs
The actual graph of temperature versus time for the thermodilution method
would resemble the one below.
Demonstrate that the thermodilution curve has no recirculation hump when
compared with the dye dilution method. Otherwise the line should be drawn
in a similar fashion.
For reasons of clarity, the graph is usually presented with temperature decrease
on the y axis so that the deflection becomes positive.
66 Section 2
Á
Physical principles
Thermodilution graphs
The semi-log transformation again makes the rise and fall of the graph linear.
Note that this time there is no recirculation hump. As the fall on the initial plot
was exponential, so the curve is transformed to a linear fall by plotting it as a
semi-log. The AUC is still used in the calculations of cardiac output.
Cardiac output measurement 67
The Doppler effect
The Doppler effect is used in practice to visualize directional blood flow on
ultrasound, to estimate cardiac output and in some typ es of flow meter.
Doppler effect
The phenomenon by which the frequency of transmitted sound is altered as it
is reflected from a moving object. It is represented by the following equation:
V ¼
DF:c
2F
0
:cos
where V is velocity of object, DF is frequency shift, c is speed of sound in blood,
F
0
is frequency of emitted sound and is the angle between sound and object.
Principle
Sound waves are emitted from the probe (P) at a frequency F
0
. They are reflected off
moving red blood cells and back towards the probe at a new frequency, F
R
. The phase
shift can now b e determined by F
R
– F
0
.Theangleofincidence() is shown on the
diagram . If a me asurement or estimate of t h e cross-sectional area of the blood vessel
is known, flow can be derived as area mu ltiplied by velocity (m
2
.m.s
À1
¼m
3
.s
À1
).
This is the principle behind oesophageal Doppler cardiac output monitoring.
P
Skin
Velocity
(m.s
–1
)
Area
(m
2
)
F
0
F
R
It is also possible to calculate the pressure gradients across heart valves using the
Doppler principle to measure the blood velocity and entering the result into the
Bernoulli equation.
Bernoulli equation
DP ¼ 4v
2
where DP is the pressure gradient and v is the velocity of blood.
Neuromuscular blockade monitoring
This top ic t ests your knowledge of th e physics and physiology behind t he use of
neuromuscular b locking d rugs (NMBDs ). You w ill benefit from a c lear idea in your
mind about what each type of nerve stimulati on pattern is attempting to demons trate.
Single twitch
A single, supra-maximal stimulus is applied prior to neuromuscular blockade
as a control. The diminution in twitch height and disappearance of the twitch
correlates crudely with depth of neuromuscular block.
Supra-maximal stimulu s
An electrical stimulus of sufficient current magnitude to depolarize all nerve
fibres within a given nerve bundle. Commonly quoted as > 60 mA for transcu-
taneous nerve stimulation.
Train of four
60
0.2
ms
30
0
0 500 1000 1500
Time (ms)
Current (mA)
Notice that you are being asked to describe the output waveform of the nerve
stimulator. The axes must, therefore, be time and current as shown. Each
stimulus is a square wave of supra-maximal current delivered for 0.2 ms. The
train of four (TOF) is delivered at 2 Hz so there is one stimulus every 500 ms.
This means that if the TOF starts at time 0, the complete train takes 1500 ms.
Tetanic stimulus
A supra-maximal stimulus applied as a series of square waves of 0.2 ms
duration at a frequency of 50 Hz for a duration of 5 s is tetanic stimulation.
Depolarizing block train of four
100
50
0
0510
Time (s)
Response (%)
15
1.5
s
5
s
Notice now that you are being asked to describe the response to a TOF
stimulus. The axes are, therefore, changed to show time and percentag e
response as shown. It is important to realize that each twitch is still being
delivered at the same current even though the response seen may be reduced.
Partial depolarizing neuromuscular block causes an equal decrease in the
percentage response to all four stimuli in the TOF. After a period of tetany
that does not cause 100% response, there is no increase in the height of
subsequent twitches.
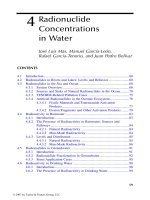
Non-depolarizing block train of four
100
50
0
0510
Time (s)
Response (%)
15
1.5
s5 s
Initial TOF should demonstrate each successive twitch decreasing in ampli-
tude: this is fade. The tetanic stimulus should fail to reach 100% response and
should also demonstrate fade. The second TOF should still demonstrate fade
but the twitches as a group should have increased amplitude. This is post-
tetanic potentiation.
70 Section 2
Á
Physical principles
Train of four ratio
The ratio of the amplitudes of the fourth to the first twitches of a TOF stimulus is
known as the TOF ratio (TOFR); it is usually given as a percentage T4:T1.
The TOFR is used for assessing suitability for and adequacy of reversal. Three
twitches should be present before a reversal agent is administered and the TOFR
after reversal should be > 90% to ensure adequacy.
Draw four twitches at 0.5 s intervals with each being lesser in amplitude than
its predecessor. In the example, the TOFR is 20% as T4 gives 20% of the
response of T1. Explain that this patient would be suitable for reversal as all
four twitches are present. However, had this trace been elicited after the
administration of a reversal agent, the pattern would represent an inadequate
level of reversal for extubation (TOFR < 90%).
Assessment of receptor site occupancy
Twitches seen Percentage receptor sites blocked
All present < 70
1 twitch lost > 70
2 twitches lost > 80
3 twitches lost > 90
All lost 95–100
Double-burst stimulation
Two bursts of three stimuli at 50 Hz, each burst being separated by 750ms.
In dou ble-bur st stimulation, the ratio of the second to the first twitch is assessed. Th ere
are the same requirements for adequacy of reversal as TOFR ( >90%); however,
having only two visible twitches makes assessment of the ratio easier for th e observer.
Neuromuscular blockade monitoring 71
No neuromuscular block
100
750
ms
50
0
0 500 1000
Time (m)
Response (%)
Demonstrate two clusters of three stimuli (duration 0.2 ms, frequency 50 Hz)
separated by a 750 ms interval. The heights of both clusters are identical. If
questioned, the current should be greater than 60 mA for the same reasons as
when using the TOF.
Residual neuromuscular block
100
750
ms
50
70
0
0 500 1000
Time (ms)
Response (%)
Demonstrate the two clusters with the same time separation. In the presence of
a neuromuscular blocking agent, the second cluster will have a lesser ampli-
tude than the first (70% is shown).
72 Section 2
Á
Physical principles
Post-tetanic count
A post-tetanic count is used predominantly where neuromuscular blockade is so
deep that there are no visible twitches on TOF. The post-tetanic twitch count can
help to estimate the likely time to recovery of the TOF twitches in these situations.
The meaning of the count is drug specific.
Draw a 5 s period of tetany followed by a 3 s pause. Note that the tetanic
stimulus fails to reach 100% response as this test is being used in cases of
profound muscle relaxation. Next draw single standard twitches at a frequency
of 1 Hz: 20 stimuli are given in total. Using atracurium, a single twitch on the
TOF should appear in approximately 4 min if there are four post-tetanic
twitches evident.
Phase 1 and phase 2 block
Phase 1 Phase 2
Cause Single dose of depolarizing
muscle relaxant
Repeated doses of depolarizing
muscle relaxant
Nature of block Partial depolarizing Partial non-depolarizing
Single twitch Decreased Decreased
T4:T1 > 0.7 < 0.7
1 Hz twitch Sustained Fade
Post-tetanic potentiation No Yes
Effect of anticholinesterases Block augmented Block antagonized
Neuromuscular blockade monitoring 73
Surgical diathermy
The principle behind the use of surgical diathermy is that of current density.
When a current is applied over a small area, the current density is high and heating
may occur. If the same current is applied over a suitably large area then the current
density is low and no heating occurs. For unipolar diathermy, the apparatus
utilizes a small surface area at the instrument end and a large area on the
diathermy plate to allow current to flow but to confine heating to the instrument
alone. Bipolar diathermy does not utilize a plate as current flows directly between
two points on the instrument.
Frequency
The safety of diathermy is enhanced by the use of high frequency (1 MHz) current,
as explained by the graph below.
Note that the x axis is logarithmic to allow a wide range of frequencies to be
shown. The y axis is the current threshold at which adverse physiological
events (dysrhythmias etc.) may occur. The highest ris k of an adverse event
occurs at current frequencies of around 50 Hz, which is the UK mains fre-
quency. At diathermy frequencies, the threshold for an adverse event is
massively raised.
Cutting diathermy
This type of diathermy is used to cut tissues and is high energy. It differs from
coagulation diathermy by its waveform.
Activation
Time
–
+
0
Current flow
When activated, the instrument delivers a sustained high-frequency AC wave-
form. Current density is high at the implement and local heating causes tissue
destruction. The sine wave continues until the switch is released.
Coagulation diathermy
Activation
Time
–
+
0
Current flow
When activated, the instrument delivers bursts of high-frequency AC inter-
rupted by periods of no current flow. Local tissue heating still occurs but is not
sustained and, therefore, causes less destruction than cutting diathermy.
Surgical diathermy 75
Cleaning, disinfection and sterilization
Maintaining cleanliness and sterility is involved in everyday practice but, for the
most part, is not under the direct control of anaesthetists. Nevertheless, a famil-
iarity will be expected with the main definitions and methods of achieving
adequate cleanliness.
Cleaning
The process of physically removing foreign material from an object without
necessarily destroying any infective material.
Disinfection
The process of rendering an object free from all pathogenic organisms except
bacterial spores.
Sterilization
The process of rendering an object completely free of all viable infectious
agents including bacterial spores.
Decontamination
The process of removing contaminants such that they are unable to reach a site
in sufficient quantities to initiate an infection or other harmful reaction.
The process of decontamination always starts with cleaning and is followed by
either disinfection or sterilization.
Methods
Technique Process
Cleaning Manual Washing
Automated Ultrasonic bath
Automated Low-temperature steam
Disinfection Chemical Gluteraldehyde 2%
Chemical Alcohol 60–80%
Chemical Chlorhexidine 0.5–5%
Chemical Hydrogen peroxide
Heat Pasteurization
Sterilization Chemical Ethylene oxide
Chemical Gluteraldehyde 2%
Heat Autoclave
Radiation Gamma irradiation
Other Gas plasma
Cleaning, disinfection and sterilization 77
Section 3
*
Pharmacological principles
The Meyer–Overton hypothesis
The Meyer–Overton hypothesis is the theory of anaesthetic action which
proposes that the potency of an anaesthetic agent is related to its lipid
solubility.
Potency is described by the minimum alveolar concentration (MAC) of an agent
and lipid solubility by the oil:gas solubility coefficient.
Minimum alveolar concentration
The minimum alveolar concentration of an anaesthetic vapour at equilibri um
is the concentration required to prevent movement to a standardized surg-
ical stimulus in 50% of unpremedicated subjects studied at sea level
(1 atmosphere).
The Meyer–Overton hypothesis proposed that once a sufficient number of anaes-
thetic molecules were dissolved in the lipid membranes of cells within the central
nervous system, anaesthesia would result by a mechanism of membrane disrup-
tion. While an interesting observation, there are several exceptions to the rule that
make it insufficient to account fully for the mechanism of anaesthesia.
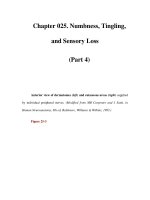
Meyer–Overton graph of potency versus lipid solub ility
Nitrous oxide
Xenon
Desflurane
Sevoflurane
Isoflurane
Halothane
Enflurane
1000
10010
Log
10
MAC
Log
10
oil:gas partition coefficient
0.1
1
10
100
1
After drawing and labelling the axis (note the slightly different scales), draw a
straight line with a negative gradient as shown. Make sure you can draw in the
position of the commonly used inhalational agents. Note that the line does not
pass directly through the points but is a line of best fit, and also that although
isoflurane and enflurane have near identical oil:gas partition coefficients they
have different MAC values and, therefore, this relationship is not perfect.
The Meyer–Overton hypothesis 79
The concentration and second gas effects
The concentration effect
The phenomenon by which the rise in the alveolar partial pressure of
nitrous oxide is disproportionately rapid when it is administered in high
concentrations.
Nitrous oxide (N
2
O), although relatively insoluble, is 20 times more soluble in the
blood than nitrogen (N
2
). The outward diffusion of N
2
O from the alveolus into
the blood is therefore much faster than the inward diffusion of N
2
from the blood
into the alveolus. Consequently, the alveolus shrinks in volume and the remaining
N
2
O is concentrated within it. This smaller volum e has a secondary effect of
increasing alveolar ventilation by drawing more gas into the alveolus from the
airways in order to replenish the reduced volume.
Graphical demonstratio n
The above concept can be described graphically by considering the fractional
concentration of an agent in the alveolar gas (F
A) as a percentage of its fractional
concentration in the inhaled gas (F
I) over time.
Nitrous oxide
Desflurane
Sevoflurane
Isoflurane
Halothane
1.0
0.5
FA/FI ratio
0
Time (min)
After drawing and labelling the axis draw a series of build-up negative expo-
nential curves with different gradients as shown. The order of the curves is
according to the blood:gas partition coefficients. The more insoluble the
agent, the steeper the curve and the faster the rate of onset. The exceptions
to this are the N
2
O and desflurane curves, which are the opposite way round.
This is because of the concentration effect when N
2
O is administered at
high flows and is the graphical representation of the word ‘disproportionately’
in the definition. You may be asked what would happen as time progressed
and you should indicate that the lines eventually form a plateau at an F
A/FI
ratio of 1.0.
The second gas effect
The phenomenon by which the speed of onset of inhalational anaesthetic
agents is increased when they are administered with N
2
O as a carrier gas.
This occurs as a result of the concentration effect and so it is always useful to
describe the concentration effect first, even if being questioned directly on the
second gas effect. If there is another gas present in the alveolus, then it too will be
concentrated by the relatively rapid uptake of N
2
O into the blood.
The concentration and second gas effects 81
Isomerism
Isomerism is a subject which can easily become confusing due to the myriad of
definitions and nomenclature it involves. Remembering a schematic diagram such
as the one below often helps to focus the mind as to where each type of isomer fits.
Isomerism
The phenomenon by which molecules with the same atomic formulae have
different structural arrangements.
Isomers are important because the three-dimensional structure of a drug may
determine its effects.
Structural isomerism
Identical chemical formulae but different order of atomic bonds.
Tautomerism
The dynamic interchange between two different forms of a molecular structure
depending on the environmental conditions.
Stereoisomerism
Identical chemical formulae and bond structure but different three-dimensional
configuration.
Enantiomers
Compounds that have a single chiral centre and form non-superimposable
mirror images of each other.
Diastereoisomers
Compounds containing more than one chiral centre or which are subject
to geometric isomerism and, therefore, have more than just two mirror
image forms.
Geometric isomerism
Two dissimilar groups attached to two atoms that are in turn linked by a double
bond or ring creates geometric isomerism because of the reduced mobility of
the double bond or ring.
Chiral centre
A central atom bound to four dissimilar groups.
Chiral centres encountered in anaesthetics usually have carbon or quaternary
nitrogen as the chiral centre. Any compound which contains more than one chiral
centre is termed a diastereoisomer by definition.
Optical isomerism
Differentiation of compounds by their ability to rotate polarized lights in
different directions.
Dextro- and laevorotatory
Compounds can be labelled according to the direction in which a molecule
of the substance will rotate polarized light. Abbreviated to either d- and l-
or þand À.
D- and L-prefixes
The use of D- and L-prefixes is a nomenclature for orientation of atomic
structure of sugar and amino acid molecules. It is a structural definition and
is not related to the optical properties.
Isomerism 83
Rectus and sinister
Molecules at a chiral centre can be labelled according to the direction in which
groups of increasing molecular weight are organized around the centre: rectus
and sinister, abbreviated to R and S, depending on whether the direction of
increment is clockwise or anti-clockwise, respectively.
In the diagram, the chiral centre is shaded and attached to four groups of different
molecular weights. The smallest group (G
1
) is then orientated away from the
observer and the remaining groups are assessed. If the groups increase in mass in a
clockwise direction as in the figure, the compound is labelled R- and vice versa.
Racemic mixture
A mixture of two different enantiomers in equal proportions.
Enantiopure
A preparation with only a single enantiomer present.
84 Section 3
Á
Pharmacological principles
Enzyme kinetics
Enzyme
A biological catalyst that increases the speed of a chemical reaction without
being consumed in the reaction itself.
The rate of a chemical reaction, therefore, depends on the concentration of the
substrates and the presence of the catalysing enzyme .
First-order reaction
A reaction whose rate depends upon the concentration of the reacting com-
ponents. This is an exponential process.
Zero-order reaction
A reaction whose rate is independent of the concentration of reacting compo-
nents and is, therefore, constant.
A first-order reaction may become zero order when the enzyme system is saturated.
The Michaelis–Menten equation
Michaelis–Menten equation predicts the rate of a biological reaction according
to the concentration of substrate and the specific enzyme characteristics:
V ¼
V
max
½S
K
m
þ½S
where V is the velocity of reaction, V
max
is the maximum velocity of reaction, K
m
is the Michaelis constant and [S] is the concentration of substrate.
The value of K
m
is the substrate concentration at which V ¼½V
max
and is specific
to the particular reaction in question. It is the equivalent of the ED
50
seen in
dose–response curves. This equation has a number of important features.
If [S] is very low, the equation approximates to
V %
V
max
½S
K
m
as the þ[S] term becomes negligible. This means that V is proportional to [S] by
a constant of V
max
/K
m
. In other words the reaction is first order.
If [S] is very high the equation approximates to
V % V
max
and the reaction becomes zero order, as V is now independent of [S].
Michaelis–Menten graph
Substrate concentration [s]
Velocity of reaction (V)
K
m
V
max
0
½V
max
The shape of the curve is an inverted rectangular hyperbola approaching V
max
.
Ensure you mark K
m
on the curve at the correct point. The portion of the
curve below K
m
on the x axis is where the reaction follows first-order kinetics,
as shown by a fairly linear rise in the curve with increasing [S]. The portion of
the curve to the far right is where the reaction will follow zero-order kinetics,
as shown by the almost horizontal gradient. The portion in between these two
extremes demonstrates a mixture of properties.
Lineweaver–Burke transformation
To make it easier to measure K
m
mathematically a Li neweaver–Burke transforma-
tion can be performed by taking reciprocals of both sides of the initial equation.
1
V
¼
K
m
þ½S
V
max
½S
This can be rearranged to give
1
V
¼
K
m
V
max
½S
þ
1
V
max
or
86 Section 3
Á
Pharmacological principles
1
V
¼
K
m
V
max
:
1
½S
þ
1
V
max
The equation may appear complex but is simply a version of the linear
equation
y ¼ðaxÞþb
where
y
is 1/
V
,
a
is
K
m
/
V
max
,
x
is 1/[S] and
b
is 1/
V
max
.
Lineweaver–Burke graph
1/V
max
K
m
/V
max
1/V
1/K
m
0 1/[S]
It may help to write the equation down first to remind yourself which func-
tions go where. The simple point of this diagram is that it linearizes the
Michaelis–Menten graph and so makes calculation of V
max
and K
m
much
easier as they can be found simply by noting the points where the line crosses
the y and x axes, respectively, and then taking the inverse value.
Enzyme kinetics 87
Drug interactions
Summation
The actions of two drugs are additive but each has an independent action of
its own.
Potentiation
The action of one drug is amplified by the addition of another, which has no
independent action of its own.
Synergism
The combined action of two drugs is greater than would be expected from a
purely additive effect.
Isobologram
The isobologram shows the amount of drug B that is needed in the face of
increasing amounts of drug A in order that the end effect remain s constant.
A, additive Draw the axes as shown and a linear relationship labelled A. This
represents an additive effect of drug A and drug B such that less of drug B is
needed as the dose of drug A is increased.
B, inhibitory Draw an upwardly convex curve labelled B which begins and
terminates at the same points as line A. This represents inhibition because
now, at any given dose of drug A, more of drug B needs to be given to
maintain a constant effect compared with an additive relationship.
C, synergistic Finally draw a downwardly convex curve labelled C. This
represents synergy in that less of drug B is required at any point compared
with what would be seen with an additive relationship.