Staged diabetes management a systematic approach - part 2 pps
Bạn đang xem bản rút gọn của tài liệu. Xem và tải ngay bản đầy đủ của tài liệu tại đây (692.1 KB, 41 trang )
GROUP FORMATION 33
Group formation
Forming a group is a very important step in ini-
tiating SDM. The focus is to identify health pro-
fessionals, institutions, and organizations with a
genuine interest in using community customized
Practice Guidelines to improve care and education
processes. Community refers to individuals with
a common interest i n developing, implementing,
and monitoring Practice Guidelines for diabetes
and associated disorders. The community can be
a managed care organization, a group practice, a
primary care clinic, a medical center, a depart-
ment within a medical school, or an entire region
of networked physicians and other care providers.
Communities can also include national organiza-
tions such as diabetes societies. The concept is
the reaching of a consensus by all interested par-
ties t o assure the application of evidence based
practices.
To move SDM from being just a good idea
to a working system in a community, resources
must be committed to adopting a new and stan-
dardized method of care. These resources can be
divided into four general components: personnel,
equipment and supplies, physical facilities, and
finances. These are generally known as “through-
puts.” They serve to convert demands and needs
as expressed by the people in the community
into improved outcomes by providing services to
people at risk for and with a disease. Central
to organizing these throughputs is the “cham-
pion”: an individual or individuals who support
change in their community and are willing to lead
this effort. This champion will need co-leaders
or co-ordinators to help in contacting, educat-
ing, and supporting other community health care
providers. Coordinators are motivated, willing to
fully participate i n a process that will take time
and energy. Coordinators often are members of
existing diabetes care and education teams and
have a stake in seeing diabetes care improved
in the community. Team members can include
primary care physicians, diabetes nurse educa-
tors, registered dietitians, psychologists or social
workers, and diabetes specialists. Although all
of these types of professional may not be avail-
able in the community, the areas of education,
nutrition, and psychology are important aspects
of care and should be addressed, if not repre-
sented.
Once the community has been defined and the
team is identified, construct the working group.
This working group is comprised of the care
team plus other physicians (family practitioners,
pediatricians, obstetricians, and endocrinologists),
health professionals (nurses, dietitians, podiatrists,
pharmacists, and psychologists), as well as repre-
sentatives of the administration, third-party pay-
ers, and patient groups interested and influen-
tial in the care and education of people with
diabetes or associated diseases in the commu-
nity. Be sure to include lay members of the lo-
cal diabetes associations. These individuals and
the organizations they represent can be very ef-
fective allies if, based on the group meeting,
additional resources are needed to implement
SDM.
The purpose of the working group is to de-
velop an action plan that familiarizes practi-
tioners with SDM, sets into motion modifica-
tion and adoption of Practice Guidelines, and
promotes constant re-evaluation of care. Take
time to identify the long-term goal of SDM;
this goal will affect the composition of and re-
sources needed by the working group. It has
been shown that without a vision and a plan,
much of the care is merely “passing the time,”
failing to achieve its ultimate purpose of im-
proving the life of the individual with diabetes.
With leadership, members of the working group
will reach consensus on Practice Guidelines for
the care of each type of diabetes and, ulti-
mately, will put SDM into practice and monitor
its progress.
34 THE IMPLEMENTATION OF STAGED DIABETES MANAGEMENT
Orientation to Staged Diabetes Management
With assessment data, begin the orientation pro-
cess. Start with the core care team. The presenta-
tions to the team should:
• define Staged Diabetes Management
• assess diabetes knowledge
• assess diabetes care
• establish goals
1. What is SDM? SDM is a process to ensure
the adoption of consistent guidelines that
will improve overall care.
2. How is diabetes currently managed in the
community? On the basis of the chart au-
dit, interview, and other data, the quality
of diabetes care can be characterized as
excellent, average, or poor.
3. How will diabetes care change with SDM?
Diagnosis, classification, treatment options,
and outcomes will be defined, consistently
applied, and monitored.
4. How is metabolic syndrome integrated with
the traditional approach to diabetes care
and education? Because most care teams
and patient education programs focus on
diabetes, it will be necessary to begin the
process of incorporating hypertension, dys-
lipidemia, renal disease, and obesity in
the “routine” care and education of peo-
ple with diabetes. This will necessitate a
re-evaluation of current practices.
Encourage rethinking about diabetes care, and
focus on broad community issues: improved care,
lower costs, efficiencies of scale, organized sys-
tems, and meeting national standards. Also, re-
view the data from the system’s analysis re-
garding the scope and depth of diabetes in the
community.
In the United States, diabetes costs over $130
billion per year, primarily due to the treatment
of complications. The worldwide figures are un-
known, but more than likely are 10–20 times
greater. While many of the microvascular and
macrovascular complications are preventable with
improved control of blood glucose and blood pres-
sure, the current situation suggests that the major-
ity of individuals with diabetes are under-treated.
Persons with type 2 diabetes, for example, have
up to five times the risk of cardiovascular dis-
ease as people of the same age without diabetes.
This is reflected in a five to ten times greater cost
for the patient with diabetes when compared to
an age and gender matched patient without dia-
betes. Ultimately, these costs are borne by all of
society and are reflected in poor quality of life
and premature death for many individuals with
diabetes. It is important that the group under-
stand the potential benefits that can be realized
with the implementation of a systematic approach
to early detection, intensive treatment, and close
surveillance.
A key point in the presentation about SDM is
that it relies on consensus. The working group
must agree on the need for change, the value
of a systematic approach, the need for evidence-
based medicine, the desirability for approaches
that treat to targets, and the need for community-
wide Practice Guidelines. Consensus should be
the result of full participation of all health pro-
fessionals who are influential in the care and ed-
ucation of people with diabetes and associated
disorders. The discussion should be unimpeded.
Controversial issues related to roles and respon-
sibilities, treatment options, and resource allo-
cations should be discussed. Consensus should
come by carefully evaluating data from scien-
tific findings, national standards, and local prac-
tices. In the end, the group’s efforts should pro-
duce a system that ensures a systematic ap-
proach that is not only evidence-based, but dy-
namic enough to undergo periodic re-evaluation
and modification.
CUSTOMIZATION OF STAGED DIABETES MANAGEMENT 35
Assess diabetes knowledge
The role of the champion in developing a con-
sensus is pivotal. It begins with an assessment
of the familiarity of the working group with dia-
betes and insulin resistance. Since these are adult
learners, testing is not advisable. The best way
to assess understanding is to review their current
practice and then determine how well the group
understands such critical elements as diagnostic
criteria, classification, treatment options, treat to
target, monitoring, and surveillance for compli-
cations. National standards of classification and
diagnosis of diabetes and hypertension should be
reviewed. Assessment and review are important to
building SDM’s framework. They set the tone for
using scientific information, supported by research
findings and data, to establish a systematic means
of treating disease. While individual clinical ex-
perience is important, SDM relies on scientific
evidence to establish the common clinical path-
ways that guide diagnosis and treatment.
Establish goals
Once the care team and the working group are
comfortable with the concept of SDM and want to
implement a program tailored to their community,
the next step is to set both long- and short-term
goals. This gives participants a vision for the
future and helps to keep the work effort on track.
It is advisable t o detail what will be accomplished
in the next month, 6 months, 1 year, and 5 years.
The long-term plan will set the stage for putting
the appropriate systems in place for measuring
outcomes as the team starts implementing SDM.
Some typical community goals are the following:
1. Achieve consensus on screening and diag-
nosis of type 1, type 2, and gestational dia-
betes.
2. Ensure the incorporation of insulin resis-
tance related disorders.
3. Establish common therapeutic goals and re-
ferral points in the DecisionPaths for each
type of diabetes.
4. Share the customized DecisionPaths with all
providers and patients.
5. Ensure that every patient’s progress is doc-
umented.
6. Adopt an ongoing method for assessing out-
comes.
Consensus on goals is crucial, leading to a sense
of ownership and responsibility for the program. It
has proven to be the critical step toward successful
implementation. When the orientation is complete,
the next step is to organize a working group who
will participate in the review and customization of
the Practice Guidelines and Master DecisionPaths.
Customization of Staged Diabetes Management
‘Practice Guidelines must use unambiguous
language, define terms precisely, and use
logical and easy-to-follow modes of presen-
tation.’
– Institute of Medicine
1
By fully participating in the customization of
Practice Guidelines for the community, the partic-
ipant feels some ownership of SDM. In general,
the starting point is to use the national standards of
practice, if they exist. Under such circumstances
there are elements that cannot be customized to
the community – such as the diagnostic criteria or
classification system. However, there are whole
sections, such as treatment options and methods
of monitoring metabolic control that can be modi-
fied based on resources and local practices. There
are eight steps that are designed to assist the
group in adapting SDM Practice Guidelines and
36 THE IMPLEMENTATION OF STAGED DIABETES MANAGEMENT
Master DecisionPaths to the community. In gen-
eral, 4–6 hours of meeting time are required to
complete the customization process. All partici-
pants should have copies of this textbook plus a
set of Quick Guides.
The customization of SDM is meant to be
by and for health professionals. Selection of the
participants in this process requires consideration
of several factors:
1. Who are the care providers? In general, the
providers are defined as those who are re-
sponsible for all aspects of disease man-
agement, including selecting the appropri-
ate therapy, adjusting pharmacologic agents,
making a referral for diabetes and nutrition
education, and managing co-morbidities.
The diabetes care and education team is the
starting point. There may, however, be oth-
ers who play an important role, such as a
pharmacist or visiting nurse.
2. Do they operate as part of a team or as indi-
viduals? Most groups operate as a loose con-
federation of i ndividuals. This often causes
confusion in medicine. A single nurse may
work with five to ten physicians and re-
ceive conflicting orders. Agreement that a
team approach will be used with consistency
should be a goal.
3. Can one participant represent a larger
group? In multi-site managed care organi-
zations, a person from each site might be a
member of the working group. That person
would represent the site and be responsi-
ble for orienting the site after consensus is
reached.
4. Are there individuals who “must” partici-
pate to ensure acceptance of the SDM ap-
proach? Medical directors, nursing direc-
tors, and others in administrative roles may
be in critical positions to foster acceptance
of SDM. Their inclusion is often necessary
to ensure adequate resource allocation.
Step 1: A call to action
The first step is to review the purpose of SDM,
the customization process, and the long-term goals
(developed during the orientation meeting). SDM
is meant to bring an evidence-based approach
to disease management. Staged Diabetes Man-
agement uses DecisionPaths to guide clinical
decision-making. Customizing SDM to the com-
munity allows each professional to participate in
decisions on treatment. The goal is to share the
same long-term vision for care in the community
and the means by which the vision will be put into
action. This should include such specific goals as
consistent criteria for diagnosis and classification,
improvement in glycemic control, and reduction
in the r ate of complications.
Step 2: Provide information about
diabetes and insulin resistance
Staged Diabetes Management is meant for the pri-
mary care physician and team, and yet it relies
on the full participation of specialists. T herefore,
it is important that the individuals with expertise
on diabetes, hypertension, renal disease, obesity,
and other related disorders are at the meeting to
provide in-depth information. Bringing specialists
into the process from the onset helps in reaching a
multidisciplinary consensus and ensures a consis-
tency in approach between primary care providers
and specialists. In the absence of specialists, rely
on reference materials to support the need for
consistency, tight metabolic control, and a mul-
tidisciplinary approach.
To assure that the scientific foundation of SDM
is established SDM provides electronic media
(eSDM) which includes a slide presentation pro-
duced by Flash
technology. The presentation is
in modular form, covering the classification, di-
agnosis, pathophysiology, and natural history of
each type of diabetes as well as associated disor-
ders and complications. The presentation i s pe-
riodically updated and provides a ready means
for laying the scientific foundation of SDM. It
CUSTOMIZATION OF STAGED DIABETES MANAGEMENT 37
is recommended that the participants in the cus-
tomization process have a scientific foundation
for SDM. The slide presentation assures that each
participant has the opportunity to learn about the
key principles of insulin resistance and insulin
deficiency, treatment modalities, surveillance for
complications, and other factors critical to under-
standing the disease process. The slides may be
presented to the whole team or as self-learning
modules. The presentations can be completed in
2–4 hours and should precede customization.
Step 3: Build consensus
The process of adapting Practice Guidelines and
Master DecisionPaths is best accomplished thro-
ugh consensus building. All participants should
have a chance to comment on each issue. After
the discussion ends a group consensus should
be possible. In the event that the group cannot
decide, turn to the scientific evidence to determine
whether it is a matter of insufficient data or a lack
of agreement in the scientific community. Voting
on an issue should be used as a last resort as it
tends to leave those in the minority dissatisfied.
Use the expert to try to persuade the minority to
change opinions.
Step 4: Customize the Practice
Guidelines
SDM is designed so that the Practice Guidelines
for each type of diabetes and related disorders
are structured in a similar manner. The Practice
Guidelines have seven components: risk factors
and screening, diagnosis, treatment options, treat-
ment targets, monitoring, follow-up, and surveil-
lance. In many cases certain elements of the
practice guideline cannot be customized as a na-
tional or regional consensus already exists. Some
examples are risk factors and diagnostic criteria.
Begin the process by selecting one practice
guideline. Type 2 diabetes is often selected be-
cause of its prevalence and complexity. Start with
the screening section. Many organizations have
options on who to screen and how often. In the
United States, individuals at high risk such as
members of minority groups, people with predia-
betes, and individuals with insulin resistance are
generally screened independent of age. All oth-
ers are generally screened after the age of 45.
This may change as more epidemiological data
are gathered. Each community is different based
on its ethnic, racial, and age distribution. Local
data on the incidence of type 2 diabetes should act
as the ultimate guide. This is also a good opportu-
nity to define the target population and high-risk
groups particular to the community. The Practice
Guidelines should have clinical applicability and
reflect the variety of ages, ethnic, or racial groups
found in the practices of clinicians in the group.
Each participant should be given the opportunity
to contribute to the discussion. This is the time to
identify “outliers” and to make sure their concerns
are factored into the customization process.
“Clinical Applicability. Guidelines should be
as inclusive as evidence and expert judgment
permit, and they should explicitly state the
populations to which statements apply.”
– Institute of Medicine
1
A key factor to consider in customizing the
Practice Guidelines is to establish a common sys-
tem for classification of type 1, type 2, and gesta-
tional diabetes, especially for future coding and
monitoring purposes. Too often type 2 patients
are misclassified because insulin is required to
achieve glycemic targets. Misclassification proba-
bly will not occur if the underlying pathophysiol-
ogy of these diseases is kept in mind. Type 1 is an
autoimmune disorder, type 2 results from insulin
resistance coupled with relative insulin deficiency,
and gestational diabetes occurs because of in-
sulin resistance first discovered during pregnancy.
The risk factors and screening criteria should take
these dimensions into account. Obesity, previ-
ous impaired glucose intolerance, family history,
common insulin resistance conditions (polycystic
ovary syndrome and Acanthosis Nigricans), and
lack of ketones (moderate to high) are generally
signs of type 2 diabetes.
38 THE IMPLEMENTATION OF STAGED DIABETES MANAGEMENT
Diagnosis
Inconsistencies in diagnostic criteria and inade-
quate documentation are among the most com-
mon problems SDM has uncovered. Therefore,
the current diagnostic criteria for each type of
diabetes should be reviewed. While the criteria
should not be modified as they are internation-
ally accepted, they can be clarified so as to set
stricter standards. Since both fasting and casual
blood glucose levels are accepted, with the latter
requiring “symptoms,” clarifying the symptoms
and how they are to be corroborated is necessary.
Stating them explicitly in the Practice Guidelines
and following the Diagnosis DecisionPath assures
consistency. The current standards for type 1 and
type 2 diabetes are the same: fasting plasma glu-
cose ≥126 mg/dL (7.0 mmol/L) or casual plasma
glucose ≥200 mg/dL (11.1 mmol/L) with symp-
toms (e.g. polyuria, polydypsia, and polyphagia)
both repeated on a second occasion to confirm
the diagnosis. Only age and symptoms at en-
try may differ significantly. Alternative means
(e.g. oral glucose tolerance test or, in extreme
situations, C-peptide) are called for only if the
group has difficulty making the diagnosis of di-
abetes or classifying a patient. For gestational
diabetes, only the 3 hour, 100 g oral glucose
tolerance test is used in the United States for
diagnosis.
Note: Where controversy may exist is with hy-
pertension and obesity. The criterion for hyperten-
sion for individuals with diabetes is a mean of two
values on different occasions of ≥130/80 mmHg.
This, however, has been interpreted many ways:
must both the systolic and diastolic meet the con-
ditions or either the systolic or diastolic must meet
the condition? Obesity has been defined as a BMI
of ≥30 kg/m
2
. Because these differences exist, full
discussion and reaching a consensus become very
important.
Treatment
The group may disagree on particular approaches
to disease management, but consensus on all of
the therapeutic options to be offered to the patient
is requisite to developing Practice Guidelines.
This avoids “shopping around” by patients. Many
individuals with type 2 diabetes are looking for
the health care professional who will not recom-
mend insulin. Partly based on a fear of injections
and partly on the misinformation that diabetes
is only serious when insulin is used, these pa-
tients often seek out health care providers who
do not offer insulin treatment. A second reason
for listing all available therapies is the opportu-
nity to inventory current practice by determining
the therapeutic options currently offered to pa-
tients. Finally, it presents an occasion to reinforce
the scientific basis of diabetes management. By
discussing the merits of each therapy and the cri-
teria by which they are generally used in current
practice, the opportunity arises to once again re-
view the action of the various pharmacological
agents. This is also an opportunity to introduce
the similarities among the different types of di-
abetes in terms of treatments. For all forms of
diabetes, medical nutrition therapy is an impor-
tant part of treatment. For both type 2 diabetes
and gestational diabetes, medical nutrition ther-
apy may be the stand-alone therapy. When in-
sulin (type 1, type 2, and gestational diabetes)
or oral agents (type 2 diabetes and gestational
diabetes) are selected, medical nutrition therapy
is synchronized to their pharmacokinetics. Each
community has its own approach to insulin thera-
pies and its own biases on selection of oral agent
administration. Nevertheless, it should be possible
to agree on all of the therapeutic options or stages.
Staged Diabetes Management Practice Guidelines
present the most popular stages for each type of
diabetes. The group may modify them. Specific
DecisionPaths have been developed for all current
therapies.
Treat to target
Although treatment goals currently vary among
communities, there is increasing evidence of the
need for near-normal control of blood glucose lev-
els. The evidence favouring tight control in type 1,
type 2, and gestational diabetes is overwhelming.
CUSTOMIZATION OF STAGED DIABETES MANAGEMENT 39
Based on this evidence, many diabetes associa-
tions throughout the world have proposed blood
glucose levels that are within one percentage point
HbA
1c
above normal. These are reflected in the
suggested Practice G uidelines in the SDM pro-
gram. Acceptance of values at or near the SDM
targets is encouraged. These may be seen as long-
term goals, with intermediate targets for each
patient. Additionally, SDM recognizes that very
young and elderly patients as well as those without
economic means and those with impaired cogni-
tive ability may require more individualized and
less stringent targets.
Staged Diabetes Management uses both HbA
1c
and SMBG to measure the level of glycemic
control. Since laboratories use different assays for
HbA
1c
, SDM uses the local laboratories’ normal
range as the criteria for control. Setting HbA
1c
targets helps address the need to achieve control
and the probability of reaching this goal. Ranges
for SMBG must be set separately from HbA
1c
since they do not always correlate directly with
HbA
1c
(due in part to different testing patterns).
The targets suggested in the SDM materials are
shown in Table 2.1. The relationship between
HbA
1c
and SMBG is based on clinical studies for
each type of diabetes in which patients tested at
least four times per day for a period of 3 months.
Use this as a general guide.
Setting goals for special circumstances is also
important at this juncture. For example, HbA
1c
should not be used in gestational diabetes since the
blood glucose targets are within the normal HbA
1c
range. Children under six years old and individu-
als over age 65 require slightly higher metabolic
goals because of the dangers of hypoglycemia.
However, for the vast majority of non-pregnant
patients, targets near or within the normal ranges
are appropriate.
Monitoring
Next, address a system of monitoring blood glu-
cose. HbA
1c
and S MBG levels provide the ba-
sis for determining whether patients have reached
their target. Therefore, use these tests to develop
a pattern for monitoring. Individual differences
between patients may require modifications, al-
though it is still beneficial to develop an overall
rule (perhaps a minimum). As the group estab-
lishes guidelines for blood glucose monitoring and
frequency of HbA
1c
testing, keep in mind that
number of tests required relates to how the data
are used for decision making and monitoring.
Staged Diabetes Management uses SMBG data
for two purposes: clinical decision-making and
overall assessment of the therapeutic intervention.
For clinical decision-making, SDM relies heavily
on SMBG to detect glucose patterns in order to de-
termine the most appropriate modifications in food
plan, pharmacologic agents, and exercise/activity.
The number of tests required varies throughout
adjust and maintain phases. In general, four tests
per day are the minimum when clinical decisions
are being made (two to four tests for type 2 di-
abetes on medical nutrition therapy). This may
be increased during the adjust phase when treat-
ment is being changed frequently. In the maintain
phase the patient has reached the glucose target
and needs monitoring for confirmation and for
detecting the need for further fine adjustments.
It may be possible to reduce the number of tests
during this phase if the SMBG data are corrobo-
rated by HbA
1c
values. In all cases SMBG must
have a defined purpose and the data must be acted
upon. Patients will soon abandon SMBG if their
health care professional ignores the results.
A general rule with SMBG is that the data
should be obtained from a memory based re-
flectance meter. Such a meter has an onboard
Table 2.1 Glycemic targets for each type of diabetes
Classification SMBG Blood Glucose Target HbA
1c
Target
Type 1 diabetes 70–140 mg/dL (3.9–7.8 mmol/L) pre-meal (50%) <7.0%
Type 2 diabetes 70–140 mg/dL (3.9–7.8 mmol/L) pre-meal (50%) <7.0%
Gestational diabetes 60–120 mg/dL (3.3–6.7 mmol/L) (100%) NA
40 THE IMPLEMENTATION OF STAGED DIABETES MANAGEMENT
memory that records the blood glucose value with
the corresponding time and date. The patient or
health care professional can scroll through the
values to determine the past several weeks’ pat-
tern. Most meters have the ability to be connected
to a computer and the glucose data reported in
graphic formats (which can be inserted in the
chart). This reduces the likelihood of error in re-
porting the test results. Self-monitored blood glu-
cose should occur at the decision-making points
in the day, generally before each meal and near
bedtime (3–4 hours after the end of dinner). For
special circumstances, such as overnight hypo-
glycemia, mid-afternoon hypoglycemia, and post-
prandial hyperglycemia, SMBG tests can be added
at the appropriate times.
HbA
1c
is used in clinical decision-making to
corroborate the metabolic control reflected in
SMBG values. HbA
1c
is a relative measure that
reflects average blood glucose level for the pre-
vious 10–12 weeks. As SMBG values improve,
HbA
1c
levels will decrease. The second purpose
of HbA
1c
and SMBG is to assess whether a ther-
apy is achieving its goal. Too often patients are
maintained on unproductive therapies. The com-
munity needs criteria that any member of the
health care team (or the payers) can easily use
to assess progress. HbA
1c
is an excellent mea-
sure of the overall efficacy of a therapy. If HbA
1c
rises, therapy is not working and modification or
change is necessary. Similarly, if SMBG values
remain high, the current therapy is failing.
In forming the Practice Guidelines, address
these five questions related to monitoring:
1. How often should SMBG be used? In the
initial selection of treatment and in the ad-
just phase, at least four SMBG tests per day
are needed to evaluate therapy. If therapy
is failing, do more testing until the under-
lying problem is discovered. Then select a
new therapy. In stable periods, the optimum
is still four times per day, especially for
those patients using insulin. Table 2.2 sum-
marizes the testing frequency for each type
of diabetes. Use this as an overall guide for
all team members and patients as well. If the
circumstances permit reducing SMBG, one
of these alternative patterns will probably
provide sufficient data:
– 3–4/day, 2–3 days per week
– 1–2/day, varying time of day
– 4/day, 1 weekday, 1 weekend day
There are many other options, but keep in
mind the data must allow accurate assess-
ment of overall glycemic control and maybe
used to guide the selection of alternative
therapies.
2. How frequently should HbA
1c
be deter-
mined? HbA
1c
reflects overall control in
the 10–12 weeks before the test. Optimally,
HbA
1c
values should be determined quar-
terly and before the patient is seen. Too
often the SMBG data (especially if they are
erratic) do not provide sufficient information
to confirm how well the current therapy is
Table 2.2 Recommended SMBG testing frequency/day
Adjust Phase Maintain Phase
Stage Type 1 Type 2 GDM Type 1 Type 2 GDM
MNT na 2–4+ 6–7 na 1–2 6–7
Oral agent na 2–4+ na na 1–2 na
Combination na 2–4+ na na 1–2 na
Insulin Stage 2 (Mixed) 4+ 4+ 6–7 2–4 2–4 6–7
Insulin Stage 3 (Mixed) 4+ 4+ 6–7 3–4 2–4 6–7
Insulin Stage 4 (Basal/Bolus) 4+ 4+ 6–7 4 2–4 6–7
Pump 4+ 4+ 6–7 4 2–4 6–7
CUSTOMIZATION OF STAGED DIABETES MANAGEMENT 41
working overall. If the HbA
1c
is obtained
before the patient is seen, these data can be
compared and a more accurate assessment of
control can be made. If this is not possible
and there is a discrepancy between HbA
1c
and SMBG, immediately contact the patient
if change in therapy is required. If HbA
1c
is not available, obtain a fasting plasma
glucose l evel, which provides the best al-
ternative overall assessment (in office) of
glycemic control. Make sure to compare
this test with the SMBG results, as would
be done with the HbA
1c
. An alternative
test, fructosamine, which provides previous
2–3 weeks overall glycemic control, may be
used in place of HbA
1c
. However, the fruc-
tosamine comparability to HbA
1c
has not
been studied extensively.
3. When should both HbA
1c
and SMBG be
used? Use both when undertaking intensive
therapies and when SMBG cannot be ver-
ified. Since SDM relies on sound SMBG
data, confirm the SMBG values with a peri-
odic HbA
1c
.
4. Who should not get an HbA
1c
?SinceHbA
1c
is a retrospective measure covering an ex-
tended period of time, it is generally not
used in gestational diabetes except at diag-
nosis to determine the extent of pre-existing
hyperglycemia or if there is concern that the
patient has underlying type 1 or type 2 dia-
betes. Under such circumstances, a baseline
HbA
1c
is advisable. The range of blood glu-
cose in pregnancy is generally 20 per cent
lower than in the non-pregnant state. Even
with poor management of gestational dia-
betes, blood glucose generally does not rise
to levels that would be reflected in a signif-
icantly elevated HbA
1c
.
5. When and for whom should ketones be mon-
itored? All patients with type 1 diabetes
should monitor their ketones when any two
consecutive unexplained SMBG values
>240 mg/dL (13.3 mmol/L) are discovered
or any illness or infection is present. For
pregnant women with gestational or type
2 diabetes, monitoring ketones ensures that
there is no starvation occurring. Frequency
depends on the patient. In general, once per
day in pregnancy is a good rule to follow.
Follow-up and surveillance
The frequency of follow-up visits is somewhat
individualized. In the adjust phase, follow-up fre-
quency will be high with weekly telephone contact
and monthly office visits. In the maintain phase,
frequency of visits should be routine, reflecting
community practices. Three to four times a year
is customary. Staged Diabetes Management pro-
vides the list of tests and procedures that gen-
erally are recommended or required (by national
standards) for diabetes and co-morbidity manage-
ment as well as complication surveillance. (See
under each type of diabetes and the complications
section.) Based on the population in any commu-
nity and their particular risks, the data collected
may need to be modified at each visit.
Step 5: Customize the Master
DecisionPaths
After completion of the Practice Guidelines, the
group should consider customization of the corre-
sponding Master DecisionPath. It is very impor-
tant to give the group the opportunity to evalu-
ate the sequence of therapies and the criteria by
which each therapy is selected. Although SDM
contains the Master DecisionPaths for each type
of diabetes, they are designed to be customized to
represent the consensus of local practitioners. The
fundamental approach throughout the customiza-
tion should be to assure scientific credibility. Al-
though SDM materials reflect the most common
and current practices that have been shown to be
clinically effective, limited resources may require
that they be modified.
During the customization process the commu-
nity should consider changing:
1. The list of treatment options
42 THE IMPLEMENTATION OF STAGED DIABETES MANAGEMENT
2. The order of treatment options
3. The criteria for initiating treatment
4. The criteria for moving from one therapy to
the next
Note: Although in general, throughout the natu-
ral history of type 2 diabetes, patients require more
complex therapies, SDM is not uni-directional.
There are times when reversing the course of treat-
ment, replacing an oral agent with medical nu-
trition alone, may be appropriate. This decision
should be based on SMBG data confirmed by
HbA
1c
.
Before beginning customization, the group
should be familiarized with the layout of the
Master DecisionPath. Stages are listed along the
right-hand side in rectangular shapes. Included
along with the names are the conditions for mov-
ing from one stage to the next. For combination
and insulin stages, the timing of the oral agent
and insulin doses is also provided. For both ad-
ministration of pharmacologic agents and SMBG,
Staged Diabetes Management uses a pre-meal
four-point scale: AM – fasting; Midday – ap-
proximately 4 hours after breakfast; PM – before
the evening meal; and BT – 3–4 hours after the
evening meal or bedtime. Thus, for type 2 di-
abetes, OA–0–0–N indicates oral agent in the
morning (AM) and NPH insulin before bedtime
(BT) along with an evening snack. Insulin Stage
4 (Basal/bolus) closely mimics normal insulin
secretion (hence the designation physiologic). It
has several versions using a four injection regi-
men: R–R–R–N denotes regular insulin before
each meal and NPH insulin 3 hours after the
evening meal; alternatively, RA-RA-RA-LA in-
dicates the use of a rapid-action insulin analog
before each meal plus a long-acting analog at bed-
time.
Therapy choices
First, look at the Master DecisionPaths provided
by SDM and note the progression of therapies.
Modifications in therapeutic choices or progres-
sion may be necessary based on the availability
Table 2.3 Suggested timelines to
reach glycemic targets
Stage Time
Medical nutrition therapy 2–3 months
Oral agent 3 months
Insulin 6–12 months
of resources or other factors. If this is so, make
the changes. However, note that an expert panel
reviewed the recommended therapies. They rep-
resent the simplest and most effective routes to
intensive glucose control and therefore should be
carefully considered by the group.
Criteria for changing therapy
Effective management requires a goal and an al-
lowable time to meet that goal. Unfortunately,
however, extended time in the adjust phase that
does not lead to improvement in glycemic con-
trol is common in diabetes care. Estimates indi-
cate that 80 per cent of all patients with diabetes
stay in a therapy even when glycemic targets are
not achieved. Staged Diabetes Management pro-
vides guidelines for deciding when a therapy has
reached its maximum effectiveness and, therefore,
should be changed. Table 2.3 summarizes these
guidelines. It is strongly recommended that the
community follow them in the Master Decision-
Paths.
Co-management
Staged Diabetes Management is meant to optimize
primary care services without sacrificing quality.
Therefore, each Master DecisionPath offers op-
portunities to consider expert advice. Perhaps the
community does not have the resources to pro-
vide all treatment options. For example, many
primary care physicians are not trained to initiate
insulin pump therapy. Review the Master Deci-
sionPaths and determine with the group which
therapies should be co-managed with a special-
ist. In any co-management situation, the primary
care provider continues as the coordinator of care.
CUSTOMIZATION OF STAGED DIABETES MANAGEMENT 43
This is an opportunity to make certain that the
specialist also follows the community Master De-
cisionPath to ensure that all team members can
continue delivering consistent, quality care.
Selecting initial therapies
Staged Diabetes Management covers the thera-
pies for a newly detected patient and the con-
tinuation of treatment for previously diagnosed
cases that are to be followed according to the
SDM protocols. For recently diagnosed cases the
time necessary to make or confirm a diagnosis
and to determine the initial treatment or stage
is variable. In general, confirmation should occur
within a few days. For the majority of patients
no treatment need be initiated until the diagno-
sis is confirmed, thus the waiting period does not
present a medical problem. However, for patients
whose fasting or casual blood glucose at diag-
nosis exceeds 300 mg/dL or 16.6 mmol/L, with
or without positive ketones, there is a need for
immediate insulin therapy. This is especially im-
portant for individuals below the age of 30 years.
The differential diagnosis between type 1 and
type 2 diabetes may require extensive labora-
tory tests that take several days to complete.
During this time the individual may develop
acidosis. This could lead to diabetic ketoacido-
sis (DKA). To avoid this it is recommended
that insulin therapy be initiated until blood glu-
cose levels can be restored (<200 mg/dL or
11.1 mmol/L).
For those already in treatment, the transition to
SDM start phase represents the point at which a
new treatment is being selected. The use of the
SMBG data, laboratory plasma blood glucose, and
HbA
1c
is recommended to ensure improvement
in glycemic control in as rapid and efficacious
a manner as possible. For patients already self-
monitoring and for whom serial HbA
1c
values
are available, the addition of a laboratory fasting
plasma glucose would be helpful. These data will
help differentiate between those individuals with
primarily insulin deficiency and those with insulin
resistance. (The natural history of type 2 diabetes
suggests that relative insulin deficiency occurs
7–10 years after the onset of disease and is of-
ten accompanied by deterioration in casual plasma
glucose.) Some community physicians may be re-
luctant to select the more complicated regimens
because they believe that patients are less likely to
be compliant and because they themselves may be
unfamiliar with how to start, adjust, and maintain
these therapies. Staged Diabetes Management pro-
vides Specific DecisionPaths for each treatment
stage, which have been tested in numerous sites
and reviewed by expert panels. The overwhelm-
ing evidence supports their use by primary care
teams.
2
Note: The entry plasma glucose and HbA
1c
lev-
els depicted on the Master DecisionPath are sug-
gested. The group may choose to modify them. The
result, however, should be one consistent set of
criteria for determining which therapy is selected.
This avoids confusion when several members of
the health care team see the patient.
Step 6: Share Customized Practice
Guidelines and Master
DecisionPaths
If different members of the larger group helped
modify the SDM program, determine the extent
of the whole group’s acceptance of the practice
guideline and the Master DecisionPath for each
type of diabetes. Refer to the diabetes expert if
the results of any of the smaller groups’ cus-
tomizations seem inconsistent with the ADA or
other national or international expert organiza-
tions’ standards of practice. The group should
adopt guidelines that are both realistic and us-
able. Occasionally, guidelines are too strict or too
liberal. Hear all viewpoints at this juncture, be
patient, and leave ample time for discussion.
Once consensus has been reached on the Prac-
tice Guidelines and Master DecisionPath, review
selected Specific DecisionPaths to familiarize the
group with the SDM approach. To do this, if the
groups were divided according to type of diabetes,
now is the time to reconvene them.
44 THE IMPLEMENTATION OF STAGED DIABETES MANAGEMENT
Step 7: Review Specific
DecisionPaths
All treatment DecisionPaths are organized accord-
ing to stage. They are self-contained with start
followed by adjust/maintain. They are meant to
clarify the implementation of a treatment protocol
and are not meant to be modified. They follow
the Food and Drug Administration guidelines and
contain any contraindications or precautions.
If the Quick Guides are being used, they are
colour coded for each type of diabetes. Using
type 2 diabetes as an example (Medical Nutrition
Therapy/Start), note that the structure of the De-
cisionPath begins with the entry criterion (blood
glucose at diagnosis). It then moves to the medical
visit and the blood glucose targets. This is always
followed by “how to start” the therapy along with
notes related to starting the treatment. After “how
to start” comes the follow-up information. This is
the same structure for all start phases.
Adjust treatment
Next is the adjust/maintain phase of the Deci-
sionPath. Once again the structure follows a set
pattern. The DecisionPath begins with a brief re-
view of key data. This is followed by an evalu-
ation of current glycemic control. If the patient
has reached the targets, they enter the maintain
phase. Follow-up guidelines are detailed in the
box to the r ight. If the patient has not reached
the targets, the reason must be determined. The
underlying reason is often adherence. Staged Di-
abetes Management provides a Specific Decision-
Path to evaluate patient adherence and to identify
behaviours typical of psychological or social reac-
tions to diabetes (see the Appendix, Figures A.19
and A.24). If adherence is not the problem, the
next question is whether any improvement has oc-
curred. To determine this, a simple algorithm has
been devised. If at the previous visit the SMBG
or HbA
1c
was less than twice the target, then over
the period of 1 month the average SMBG should
have dropped by 15 mg/dL (0.8 mmol/L) and the
HbA
1c
by 0.5 percentage points. If the SMBG
and/or HbA
1c
was greater than twice the target,
the drop should have been 30 mg/dL (1.7 mmol/L)
or 1.0 percentage point HbA
1c
.Ifthisisoccur-
ring, the current treatment is continued without
any adjustment. If, however, the treatment does
not meet these criteria, further adjustment is nec-
essary. Each pharmacologic agent has a maximum
safe and efficacious dose. For oral agents it is
straightforward. For insulin, in general, >1U/kg
(>1.5 U/kg in adolescents) is considered over-
insulinization and calls for a re-evaluation of the
therapy. Staged Diabetes Management provides
these criteria for each adjust phase, and also pro-
vides the reasons for moving from one therapy
to the next. For oral agents, the choice of com-
bination or insulin therapy is based on whether
the lack of improvement is due primarily to fast-
ing hyperglycemia or overall hyperglycemia. For
Insulin Stage 2 (Mixed), the criteria for moving
to Stage 3 (Mixed) are persistent fasting hyper-
glycemia, nocturnal hypoglycemia, or insufficient
improvement over the past 12 months.
Insulin adjustment guidelines
Staged Diabetes Management provides insulin ad-
justment guidelines according to each stage of
therapy. These guidelines are meant to provide
general rules for adjusting the insulin dose up or
down based on the standard insulin action curves.
It is highly recommended that SMBG values be
the basis for the decision as to which insulin to ad-
just and by how much. The guideline is based on
patterns of blood glucose. Make certain that a pat-
tern is detected before beginning to make changes
in the i nsulin dose.
Ancillary DecisionPaths
This section includes the common DecisionPaths
for medical visits, hypoglycemia, illness assess-
ment, education, nutrition, exercise, and adher-
ence assessment. The group should review se-
lected paths to familiarize the participants with
the roles and responsibilities of team members.
Begin with diabetes education. Note that the
DecisionPaths list the data that the educator needs
EVALUATION OF STAGED DIABETES MANAGEMENT 45
prior to seeing the patient as well as the length of
time each visit requires. Nutrition and exercise
follow the same format. Adherence assessment
covers both the metabolic parameters and on the
back side some of the behavioural cues that may
explain poor adherence.
With the Specific DecisionPaths reviewed, it is
time to apply these paths to actual case studies.
Three or four model cases taken from the records
of patients treated at the site should be summa-
rized and used as the basis of the exercise. One
should cover diagnosis, one initial therapy, one
transition to i nsulin, and one such co-morbidities
as hypertension and dyslipidemia. The case stud-
ies serve to test the SDM principles against actual
situations.
Step 8: Discuss implementation
Before adjourning this meeting, an implementa-
tion plan needs to be developed. Additional meet-
ings to finalize the plan may be necessary, but at
least make a start now. There are several options
for moving the community toward full implemen-
tation and much will depend on the make-up of the
community. Over the past decade numerous med-
ical organizations have implemented SDM. Many
have published their experience (a reference list
is provided at the end of this chapter).
Once the group has reached consensus on Prac-
tice Guidelines and Master DecisionPaths, a time-
line for implementing SDM needs t o be devel-
oped. The timeline should establish when SDM
materials will be distributed to the community and
when and how patients will be switched to SDM.
For most communities the timeline begins almost
immediately following participation in the consen-
sus building process. Decisions to start all newly
detected cases and to include the Practice Guide-
lines or a flow sheet in each chart are common.
Some other decisions, such as making changes to
charting, scheduling patients, and setting up pro-
cedures for diabetes education and nutrition may
take a little time. At this meeting a priority list
of steps that need to be taken and assignment
for responsibility to undertake the steps by team
members should be made.
Evaluation of Staged Diabetes Management
Once SDM is underway, assess progress period-
ically, specifically in the areas of patient care,
quality of care, and cost of care. This evaluation
provides information needed to make changes and
improvements and is crucial to the program’s suc-
cess.
Measuring quality
The issue of measuring quality can be broken
down into three types of evaluation measure:
structural, process, and outcome. Structural mea-
sures refer to those program elements that are
throughputs: personnel, equipment, facilities, and
financing. For nearly half a century, structural
measures were predominant in medicine. Physi-
cian education, availability of highly technical
instruments, the hospital–medical school associ-
ation, and money spent on these structural ele-
ments were believed to be reflected in care. Thus,
the more spent the better the outcome. By the
mid-1950s, it became clear that structural mea-
sures did not necessarily explain differences in
outcome. Perhaps the most striking information
came from studies comparing surgery rates when
patients sought one opinion versus two. A sec-
ond opinion led to 50 per cent fewer surgeries
and lower costs – and medical outcome was not
compromised.
3
The shortcomings of structural measures led to
process measures, which focused on the policies,
programs, and procedures of health care delivery.
Considered part of throughputs, process measures
tracked patients through the system and examined
whether consistent, documented practices were in
46 THE IMPLEMENTATION OF STAGED DIABETES MANAGEMENT
place. Practice Guidelines developed because of
attention to issues of process.
Process measures became widespread, and in
some clinics the belief emerged that the mere ex-
istence of standards of care could ensure quality.
Federally funded patients were the first to ben-
efit from process measures; that is, professional
service review organizations measured physician
performance against Practice Guidelines. A typi-
cal process measure included the presence or ab-
sence of diagnostic criteria for type 2 diabetes in
the patient’s chart as well as the documentation of
patient education and evaluation of complications.
Process measures assumed that beneficial med-
ical outcomes resulted from systematic processes.
Research, however, did not entirely support this
assumption. Standardized care should have im-
proved outcome, but too often Practice Guidelines
were not used. One reason for a lack of imple-
mentation of guidelines was that they did not
account for the unique resources each community
brings to a medical problem. A second reason of-
ten cited was that Practice Guidelines tended to
be written by “experts” who were not involved in
community-based primary care.
Defects in structural and process measures led
to outcome measures. By focusing on the end
product (medical condition of the patient after
the treatment), providers could determine whether
a medical intervention led to beneficial results.
Since outcomes were so important, many argued,
outcome measures alone would suffice. Thus, in
the 1980s several medical centers advertised the
number of successful heart transplants, the num-
ber of patients receiving laser therapy, the five
year survival rate for individuals with breast can-
cer, and so forth. This may have been an excellent
way to promote particular health care delivery sys-
tems, but it also showed tremendous variations in
practice. Concern for these variations, rising costs,
renewed focus on quality, and a cost–benefit ap-
proach to outcome measurement has led to the
current outlook on quality of care. According to
this outlook each element of the systems approach
to quality assessment has merit. Thus, the key to
assessing the impact of SDM is to incorporate
structural, process, and outcome measures from
the outset.
Process and structural measures
If the SDM Diabetes System Review was com-
pleted as part of the needs assessment, note that
it was divided according to inputs, throughput,
and outputs. This will serve as a baseline mea-
sure. If the review was not done for the needs
assessment, familiarize the diabetes teams with it
now. By creating a team of health professionals
and assigning resources to SDM this will result in
changing the structure of diabetes care in the com-
munity. Note these structural changes in items one
to seven of the throughputs. Identifying process
measures for SDM is straightforward. The Prac-
tice Guidelines and Master DecisionPaths adopted
by the community are process measures and the
basis for assessing SDM. To assess the process
measures, conduct a patient chart audit using the
Patient Chart Audit Form found in the Appendix,
Figure A.2.
In addition to auditing the patient’s charts, an-
swer the following process measure questions:
1. Has t he community of health care profes-
sionals agreed on the Master DecisionPaths
for type 1, type 2, and gestational diabetes?
2. Has a policy been established to include
the Practice Guidelines and DecisionPath in
each patient’s chart or in every exam room?
3. Has a system been devised to track patients
using the Master DecisionPath?
4. Has a system been adopted to record and
aggregate data according to type of diabetes,
stage, and phase?
Outcome measures
Incorporate intermediate and long-term outcome
measures into the SDM program. Here are several
intermediate outcome measures for consideration:
• HbA
1c
• blood glucose (SMBG)
EVALUATION OF STAGED DIABETES MANAGEMENT 47
• blood pressure
• microalbuminuria
• lipid profile
• treatment for diabetes
• treatment for hypertension
• treatment for dyslipidemia
• body mass index (BMI)
• medical nutrition plan
• foot examination
• eye examination
• aspirin use
• referral for diabetes education
• referral for medical nutrition therapy
For diabetes in pregnancy, use the following
measures:
• miscarriage (type 1 and type 2 diabetes only)
• fetal anomalies (type 1 and type 2 diabetes
only)
• large for gestational age (LGA)
• small for gestational age (SGA)
• neonatal hypoglycemia
Long-term measures for type 1 and type 2 di-
abetes are listed below. The number of interven-
ing variables affecting these outcomes cannot be
easily identified. For that reason, monitor these
outcomes, but also record possible intervening
variables:
• retinal changes
• renal changes
• neurological changes
• cardiovascular disease
• peripheral vascular disease
• foot problems (ulcers, deformities, infections)
• other related complications
Evaluate the long-term measures in light of spe-
cific steps taken to alter them. Improved metabolic
control should prevent or delay microvascular
complications. However, the level of control and
how well it is sustained are critical. Unless these
factors are taken into account, false conclusions
may be made about the relationship between SDM
and outcomes. Therefore, be realistic in select-
ing outcome measures. Minimally, the outcomes
should meet the criteria for NCQA Physician
Recognition as outlined in Chapter 1.
Ongoing monitoring
Developing a system of ongoing monitoring is
fundamental to promoting change while ensuring
quality. In 1950, Dr. Deming, the famed de-
veloper of the quality movement, proposed the
PDSA cycle.
4
He argued that for a program to
change and maintain quality, the environment
needed planning (P), doing (D), studying (S),
and acting (A). Applied to medicine in general
and SDM in particular, PDSA promotes ongoing
reassessment of medical practices. Recently,
such quality assurance movements as Six Sigma
have emerged to reinforce the whole movement
towards improved quality and reduced error.
5
Arguing that the rate of error in medicine is too
high, resulting in significant human and financial
costs, the Six Sigma movement attempts to apply
mathematical principles to problem identification
and resolution. An underlying principle is to
assure both effectiveness and efficiency while
reducing error. Six Sigma’s goal is to reduce error
to three mistakes for each one million medical en-
counters. As an example, it argues that currently
there are more than 500 surgical errors each
week. Using an approach similar to that of Dr.
Deming, instead of the PDSA paradigm, it uses
a define–measure–analyze–improve–control
(DMAIC) model. Its key is to measure the scope
of the problem first, understand the factors that
contribute to error, bring together all involved
personnel to find a way to correct the error,
48 THE IMPLEMENTATION OF STAGED DIABETES MANAGEMENT
implement the change, and measure the outcome.
It recognizes that critical to its success are a
committed leadership, a management process
that incorporates measurement, and the careful
selection of change agents who are among the
best professionals in the organization.
Whether the Deming approach, Six Sigma, or
any of another dozen quality improvement pro-
cesses, the principles remain the same. Identifica-
tion and acceptance of a problem must come first.
Measurement is key to this. Through measurement
both the scope of the problem and possible solu-
tions become known. Selection of an intervention
needs to be founded in science. The importance
of an evidence based approach cannot not be em-
phasized enough. Too often the solution is selected
based on too little evidence. For years the belief
that patients required individual education to learn
about diabetes went untested. Only when rising
costs made such education prohibitive was there
a willingness to understand the role of patient edu-
cation i n the treatment of diabetes and to measure
its cost effectiveness. Out of this came an under-
standing that while education was beneficial, its
costs were too high. The question was whether
a more cost effective approach could be created.
Teaching patients in group classes was proposed.
However, unlike individual education, this inter-
vention was thoroughly tested and subjected to
statistical analysis. It was shown that individuals
had the same amount of improvement in glycemic
control when taught in groups as patients taught
individually, but at a lower cost.
6
As illustrated in the discussion of patient edu-
cation, assessment eventually gets to the question
“What does it cost?”. Increasingly, cost is impor-
tant in determining a program’s usefulness. Can
SDM lead to a better way to determine cost?
Staged Diabetes Management reduces variation
and generates significant data from short-term,
long-term, and ongoing monitoring. A series of
studies in a variety of clinical setting have shown
cost savings with improved glycemic control.
7–9
References
1. Institute of Medicine. Clinical Practice Guidelines.
Field MJ, Lohr KN, eds. Washington, DC: National
Academy Press, 1990.
2. Mazze RS, Etzwiler DD, Strock ES, et al.Staged
Diabetes Management: toward an integrated model
of diabetes care. Diabetes Care 1994; 17: 56–66.
3. Barr JK, Schachter M, Rosenberg SN, et al.
Procedure-specific costs and savings in a manda-
tory program for second opinion on surgery. Qual
Rev Bull 1990; 16: 25–32.
4. Deming WE. OutoftheCrisis. Massachusetts Insti-
tute of Technology, 1986.
5. Barney M and McCarty T. TheNewSixSigma.
Minneapolis: Pearson Higher Education. 2002.
6. Rickheim PL, Weaver TW, Flader JL a nd Kendall
DM. Assessment of group versus individual dia-
betes education: a randomized study. Diabetes Care
2002; 25(2): 269–274.
7. Mazze R and Simonson G. Staged Diabetes Man-
agement: a systematic evidence-based approach to
the prevention and treatment of diabetes and its co-
morbidities. Pract Diabetes Int 2001; 18(7) (Sup-
plement).
8. Sidorov J, Shull R, Tomcavage J, Girolami S, Law-
ton N and Harris R. Does diabetes disease man-
agement save money and improve outcomes? A
report of simultaneous short-term savings and qual-
ity improvement associated with a health mainte-
nance organization-sponsored disease management
program among patients fulfilling health employer
data and information set criteria. Diabetes Care
2002; 25(4): 684–689.
9. Benjamin E and Bradley R. Systematic Implemen-
tation of Customized Guidelines: The Staged Di-
abetes Management Approach. Journal of Clinical
Outcomes Management 2002; 9: 81–86.
PART TWO
THE TREATMENT OF
DIABETES
Staged Diabetes Management: A Systematic Approach (Revised Second Edition) R.S. Mazze, E.S. Strock, G.D. Simonson and R.M. Bergenstal
2006 Matrex. ISBN: 0-470-86576-X
4
Type 2 Diabetes
Statistics from the Centers for Disease Control
National Center for Chronic Disease Prevention
and Health Promotion report that in the year 2003
there were approximately 18.0 million Americans
with diabetes.
1
The majority (∼95 per cent) of
these i ndividuals have type 2 diabetes. More-
over, 5.9 million of the 18 million people have
undiagnosed type 2 diabetes.
2
Aggregating both
the detected and undetected cases, more than 10
per cent of the adult population currently has
type 2 diabetes. Annually, as many as 800 000
new cases are detected and about half that num-
ber die with type 2 diabetes as an underlying
or contributing factor. Thus the number of peo-
ple with type 2 diabetes is growing by nearly
500 000 each year. If the population is segmented
into high-risk groups, these proportions change
significantly. Among those over the age of 65,
the percent of people with diabetes doubles to 20
per cent. For those who are in high-risk racial or
ethnic groups, the numbers can be up to fivefold
greater. Even among children and adolescents the
incidence and prevalence of type 2 diabetes is ris-
ing. This phenomenon is worldwide. It has been
estimated that 300 million people will have dia-
betes by the year 2025.
Whether in the United States or elsewhere the
common factors associated with this substantial
increase i n the number of people with diabetes
are: (1) better surveillance; (2) aging population;
(3) increased prevalence of obesity in children
and adults; (4) poor nutrition; and (5) reduction
in activity.
Etiology
In simplest terms, type 2 diabetes is both a geneti-
cally and environmentally mediated disease char-
acterized by a combination of insulin resistance
in peripheral tissues (muscle, liver, and adipose)
coupled with relative insulin deficiency. It is un-
clear which factor occurs first, insulin resistance
or insulin deficiency. In most cases individuals
with type 2 diabetes have both conditions in vary-
ing degrees, perhaps reflecting the multi-factorial
nature of the pathogenesis of the disease. It is im-
portant to note that both insulin resistance and in-
sulin deficiency are progressive in nature. Staged
Diabetes Management relies on at least a basic
understanding of the biochemical and molecular
derangements leading to insulin resistance and
relative insulin deficiency in order to make in-
formed clinical decisions regarding the preven-
tion and treatment of t he disease. This is es-
pecially true with the dramatic proliferation in
therapeutic options for managing type 2 diabetes
Staged Diabetes Management: A Systematic Approach (Revised Second Edition) R.S. Mazze, E.S. Strock, G.D. Simonson and R.M. Bergenstal
2006 Matrex. ISBN: 0-470-86576-X
80 TYPE 2 DIABETES
mellitus, targeting insulin resistance (thiazolidine-
diones, biguanides), insulin deficiency (sulfony-
lureas, meglitinides, insulin, and insulin analogs)
and impaired incretin action (incretin mimetics).
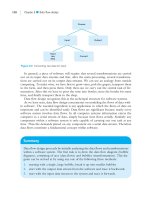
Deficiency in
β
-cell function
Individuals destined to develop type 2 diabetes
may have two defects related to insulin secretion.
First, they may fail to secrete adequate insulin
at the start of a meal. This first-phase insulin is
needed to overcome the initial glucose challenge
of a meal and to signal the liver to reduce its
production of endogenous glucose. After some
(unknown) duration of disease, the β-cells are
unable to adequately respond to the post-prandial
rise in glucose. The defects in t he biphasic β-cell
response eventually contribute to a net decrease in
available insulin. This defect in insulin secretion
appears to be found in normoglycemic relatives
of individuals with type 2 diabetes, suggesting
that reduced production of insulin may be an early
defect in the progression to type 2 diabetes.
In the years prior to and early in the progression
of type 2 diabetes, individuals are often hyperin-
sulinemic due to the β-cell response to increasing
insulin resistance in peripheral tissues. Interest-
ingly, individuals may be both hyperinsulinemic
and hyperglycemic at the same time because there
is a relative insulin deficiency that develops. That
is, the hyperinsulinemia may not be sufficient
to overcome insulin resistance, altering glucose
metabolism to the point where hyperglycemia de-
velops. Moreover, early during this hyperinsuline-
mic state there appears to be β-cell dysfunction
manifested as diminished first-phase insulin secre-
tion and reduced response to glucose challenges.
With time the natural history of diabetes dictates
that β-cell dysfunction continues to worsen, result-
ing in even further declines in insulin secretion.
A vicious cycle develops as glucose levels rise in
the blood stream, creating a glucose toxic environ-
ment, further weakening the β-cell and allowing
glucose levels to rise higher.
Why the β-cell dysfunction? While this remains
an area of intense scientific research, it appears
that many factors combine to cause β-cell dys-
function. These include:
• alterations in β-cell sensitivity to insulin sec-
retagogues
• glucose toxicity
• lipid deposition in the β-cell (lipotoxicity)
• increased demands of insulin secretion due to
insulin resistance
Insulin deficiency may occur relatively early in
the natural history of type 2 diabetes in certain
populations. It has been suggested that if the tra-
ditional diet of a population were relatively low in
carbohydrates, then the average amount of insulin
produced by individuals in this population would
be low relative to populations accustomed to di-
ets high in carbohydrate. It has been reported that
such individuals generally produce less insulin
than weight matched populations accustomed to
high-carbohydrate diets. Thus, the change to a
Western style diet for Asian-Americans might ex-
plain the significant increase in the incidence of
type 2 diabetes in this population. Their insulin
deficiency makes them unable to produce ade-
quate amounts of insulin to maintain normal blood
glucose levels. Such individuals are not to be
confused with other groups who also have expe-
rienced a significant alteration in diet. It has been
postulated that certain ethnic groups, including
American Indians and Polynesians, have a genetic
predisposition for survival which favours the stor-
age of energy (fat) when food is plentiful coupled
with conservation of energy stores during times
of famine. As access to consistent food supplies
becomes possible, the very same “thrifty genes”
that were advantageous during cycles of feast and
famine become deleterious when food is always
plentiful, as they tend to gain weight and become
severely insulin resistant.
Insulin resistance
Research is emerging on the molecular mecha-
nisms of insulin resistance leading to type 2 dia-
betes, but the entire picture is far from complete.
ETIOLOGY 81
One thing is clear, the development of insulin
resistance in peripheral tissues is multifactorial
and is not caused by a single defect; rather, a com-
bination of defects in several signaling pathways
leading to reduced insulin mediated glucose up-
take. The following section briefly highlights the
current understanding of this complex and multi-
faceted metabolic disorder.
Insulin resistance appears to start at the level of
the insulin receptor. These receptors are located
on the surface insulin sensitive cells and set off a
cascade of events leading to glucose uptake and
metabolism. The fi rst step in this cascade is the
activation of the receptor via the autophospho-
rylation of key tyrosine residues. The activated
receptor contains intrinsic tyrosine kinase activ-
ity, resulting in the phosphorylation of key sig-
naling proteins called insulin receptor substrates
(IRS-1, IRS-2, and IRS-3). Insulin resistance at
the receptor level is thought to occur primar-
ily by the inhibition of receptor tyrosine kinase
activity
3
and secondarily to a minor reduction in
the number of insulin receptors in individuals with
type 2 diabetes.
4
Stimulation of phosphotyrosine
phosphatase (PTPase), an enzyme that inactivates
the insulin receptor by cleavage of the phosphate
groups from phosphotyrosine residues, has been
shown to result in increased insulin resistance.
5
Relationship between obesity
and insulin resistance
A positive correlation between excess weight gain
(obesity) and insulin resistance has been estab-
lished for decades, but the precise cause and ef-
fect relationship has yet to be clearly delineated.
One of the mysteries to unravel is how increased
storage of triglyceride (fat) in adipose tissue can
result in insulin resistance in muscle and liver tis-
sue. One explanation is the rise in free fatty acid
(FFA) levels associated with obesity. Obese in-
dividuals tend to have elevated FFA levels due
to suppressed lipogenesis and increased lipolysis
coupled with a diet high in fat. Elevated FFA
levels have been shown to decrease insulin me-
diated glucose uptake in skeletal muscle,
6
and
increase hepatic glucose output,
7
resulting in hy-
perglycemia. Thus, obesity related increases in
FFA level provide a direct linkage between fat
deposition excess (weight gain) and insulin resis-
tance in other insulin-sensitive tissues.
Another intriguing connection between obesity
and insulin resistance has been the identification
of tumour necrosis factor α (TNFα). This cytokine
is secreted from adipose tissue and skeletal mus-
cle and has been shown to have a multitude of
effects including induction of tumour cell lysis,
modulation of lipid metabolism, and septic shock.
TNFα has been implicated in causing insulin re-
sistance and type 2 diabetes.
8
Data supporting this
are quite compelling. For example, TNFα lev-
els have been shown to positively correlate with
body mass index (BMI) in individuals with type 2
diabetes
9
and t o impair insulin stimulated glucose
uptake in muscle.
10
The mechanism of action is
thought to occur by a TNFα induced reduction in
insulin receptor mediated phosphotyrosine kinase
activity and direct inactivation of IRS-1. TNFα
is not the only factor that contributes to obesity
related insulin resistance. Additional research is
needed to fully understand insulin resistance in
peripheral tissues.
Influence of body fat distribution
on insulin resistance
The influence of body fat distribution plays a crit-
ical role in the development of insulin resistance.
For example, individuals with central or truncal
fat distribution (waist to hip circumference ratio
>1) have higher levels of insulin resistance com-
pared to those with lower body fat distribution in
the gluteofemoral region.
11
The classic morpho-
logical categorizations of “apple” versus “pear”
shape are easy to distinguish clinically and pro-
vide a basis for identification those patients with
highest levels of insulin resistance.
Why does fat stored at one location in the body
differ from others in contributing towards insulin
resistance? Current research has demonstrated that
the answer is linked to differences in metabolic ac-
tivity of the various fat stores. Central or truncal
82 TYPE 2 DIABETES
fat stores are more metabolically active than lower
body fat stores. Metabolically active means that
the fat tissue can effectively store triglyceride by
the action of lipoprotein lipase and quickly break
down triglyceride by the action of lipases, releas-
ing free fatty acids into the bloodstream. It is the
flux of free fatty acids into the bloodstream that
is thought to lead to increased insulin resistance
in the liver and skeletal muscle.
Can medications influence body fat distribu-
tion? Thiazolidinediones have been shown to
move visceral fat to subcutaneous adipose stores.
New medications are currently undergoing clin-
ical testing t o determine if they are effective at
reducing weight and influencing fat distribution
in the body. One medication, rimonabant, a selec-
tive cannabinoid-1 receptor antagonist, appears to
significantly reduce weight (∼5–8 kg) and reduce
abdominal obesity. This weight reduction is ac-
companied by a modest reduction in triglycerides
and increase in high-density lipoprotein.
Pre-diabetes
Figure 4.1 shows the three variables that depict the
natural history of undiagnosed or poorly treated
type 2 diabetes. By understanding the natural his-
tory, it is possible to find clues as to the underlying
defects that contribute to hyperglycemia. Before
the onset of overt type 2 diabetes, blood glu-
cose levels rise above the normal range, resulting
Natural History of Type 2 Diabetes
TIME (YEARS)
Normal BG Range
Pre-diabetes
350
300
250
200
150
100
50
300
250
200
150
100
50
0
−10 −5
0 5 10 15 20 25 30
Diabetes
Insulin Resistance
Insulin Level
Normal
Incretin action
Postprandial BG
Fasting BG
Figure 4.1 Natural History of Type 2 Diabetes
with impaired incretin action
in a state of impaired glucose homeostasis (pre-
diabetes). Impaired glucose homeostasis includes
two categories, impaired fasting glucose (IFG)
and impaired glucose tolerance (IGT). Diagnosis
of IFG is made if the fasting plasmaglucose, is be-
tween 100 and 125 mg/dL (5.6 and 6.9 mmol/L)
and diagnosis of IGT is made if the 75 g oral glu-
cose tolerance test two hour value is between 140
and 199 mg/dL (7.8 and 11 mmol/L).
As previously mentioned, individuals with ei-
ther pre-diabetes or type 2 diabetes often have
elevated plasma insulin levels (hyperinsulinemia).
Pancreatic β-cells attempt to maintain normal in-
sulin production in response to increasing insulin
resistance by synthesizing and secreting insulin in
an attempt to maintain euglycemia. This can be
indirectly measured by determining the amount
of insulin in the blood using an insulin radioim-
munoassay (RIA). As the patient moves from pre-
diabetes to diabetes, first phase insulin secretion,
characterized by a sudden burst of insulin released
in response to a post-prandial rise in blood glu-
cose, is gradually lost. The β-cells are not able
to sustain the demands of synthesis and secretion
of insulin and, over the course of years, gradually
lose the ability to secrete adequate amounts of
insulin. This decline in β-cell function is called β-
cell exhaustion. One factor implicated in causing
β-cell exhaustion is glucose toxicity resulting from
persistent hyperglycemia.
12
The length of time
from excessive insulin production to the exhaus-
tion of pancreatic cells is related in part to the per-
sistence and level of hyperglycemia. This process
generally occurs over several years and is modu-
lated by such factors as diet, activity, and weight
gain. Eventually, if near-normal glycemia is not
restored, it is possible for the patient to reach
a state in which insulin production is so com-
promised (insulin deficiency) as to limit the only
viable therapeutic option to exogenous insulin.
Confounding these factors is that some indi-
viduals with type 2 diabetes produce excessive
hepatic glucose. One of insulin’s functions is to
suppress hepatic glucose production and increase
the formation of glycogen during the fed state.
Hepatic insulin resistance (characterized by the in-
ability of basal levels of insulin found during the
fasting state to adequately suppress the formation
OVERVIEW OF TREATMENT OPTIONS FOR TYPE 2 DIABETES 83
of excess glucose by the liver via the process of
gluconeogenesis) results in elevated fasting blood
glucose levels.
Throughout, the progression toward diabetes is
a concomitant process linked to increasing in-
sulin resistance. Known as part of the metabolic
syndrome, it was previously called Reaven’s syn-
drome, syndrome X, dysmetabolic syndrome, and
insulin resistance syndrome. Thought to be the
effect of both cellular and vascular insulin resis-
tance, it is characterized by obesity, hypertension,
dyslipidemia, and renal disease (see Chapter 7 for
a complete discussion). Another factor is impaired
incretin action. These gut-related hormones con-
trol 50% of post-prandial insulin release.
No method to predict the onset of impaired
glucose homeostasis or subsequent type 2 diabetes
currently exists. These events are compounded by
genetic predisposition t o insulin resistance and
Table 4.1 Approximate risk of
developing type 2 diabetes
Factor Risk Range
Age >65 years old 15–25%
American Indian 30–50%
Hispanic 20–30%
African-American 15–20%
Asian 10–12%
Caucasian 5–8%
Previous gestational diabetes 20–80%
obesity along with environmental factors such as
diet composition and activity levels. Because the
genetic component is so important, certain ethnic
and racial groups are at higher risk for developing
type 2 diabetes. Table 4.1 shows the approximate
risk of developing type 2 diabetes in different
populations.
Overview of treatment options for t ype 2 diabetes
Medical nutrition therapy (MNT) is the balance
between energy intake and output through di-
etary management and planned activity. Since
MNT, as a monotherapy, lowers blood glucose by
30–45 mg/dL or between 1–1.5 percentage points
HbA
1c
, it is reserved for individuals who recently
developed diabetes in whom mild insulin resis-
tance is the primary underlying defect. It has been
shown that a modest increase in activity combined
with a reduction of fat and carbohydrates of be-
tween 5 and 10% can lead to increased insulin
sensitivity resulting in improved glucose uptake
and overall improved glycemic control.
Oral agents: monotherapy
When MNT fails, or when at diagnosis blood
glucose levels are outside of the therapeutic range
of MNT alone, oral agent therapy is initiated and
MNT is continued. Throughout treatment for type
2 diabetes MNT plays a significant role. Nutrient
intake and energy output are synchronized with
the physiologic action of pharmacologic agents t o
assure optimization of their therapeutic benefits.
Oral agents are divided into three categories
based on their action: insulin sensitizers, insulin
secretagogues and a-glucosidase inhibitors. The
insulin sensitizers are further subdivided into
those that work at t he target tissue-thiazolidine-
diones (TZD) and those that inhibit hepatic
gluconeogenesis-biguanides. The TZDs work in
muscle and adipose tissue, binding to nuclear
peroxisome proliferator activated receptors which
stimulate the isoform PPAR-γ. This results in ex-
pression and intracellular movement of GLUT-
4 transporters which enable the rapid uptake of
glucose. The biguanide, metformin works prin-
cipally in the liver by inhibiting gluconeogene-
sis, thereby suppressing excessive hepatic glucose
output. Thus, the principal action of these agents
is to improve insulin sensitivity.
Secretagogues (sulfonylureas and meglitinides)
work in pancreatic ß-cells where they help fa-
cilitate secretion of insulin by binding to the
ATP-sensitive potassium channel. This depolar-
izes the ß-cell, which in turn allows calcium to
enter the cell, resulting in release of insulin. Be-
cause the meglitinides have a short half-life, they
84 TYPE 2 DIABETES
are taken immediately before meals. Both classes
of secretagogues are limited by ß-cell mass. When
ß-cell mass is low the quantity of available insulin
is diminished. The action of the secretagogues
does not increase the ß-cell mass, nor does it cause
an increase in the production of insulin. Its action
is limited to facilitating the release of available
insulin. Thus, it is intended for patients with rela-
tive insulin deficiency. Patients with actual insulin
deficiency generally require exogenous insulin to
supplement depleted insulin supplies.
α-glucosidase inhibitors work in the gastroin-
testinal tract. Because they inhibit the enzyme
a-glucosidase, the breakdown and absorption of
complex carbohydrates and other nutrients is
slowed. Their benefit is for patients who cannot
control their appetite and consequently have ele-
vated postprandial blood glucose.
Generally, oral agents as mono-therapies de-
crease blood glucose by 1 to 2 percentage points
HbA
1c
or up to 60 mg/dL. When used in combi-
nation with effective MNT, the cumulative benefit
is 3 percentage points HbA
1c
. Thus, it is not un-
common to use more than one therapeutic agent
in the treatment of type 2 diabetes. The selection
of a combination of agents is based on clear iden-
tification that the current therapy is not adequately
addressing the underlying defect. Therefore, the ad-
dition of another drug from the same classification
(e.g. secretagogue or thiazolidinedione), is not in-
dicated as they have the same mechanism of action.
Combination therapies
The selection of two or more pharmacologic
agents for the treatment of diabetes requires un-
derstanding the interaction. Table 1 summarizes
the various combinations of therapies that can be
utilized to optimize control. Note, the presence of
kidney or liver disease is a factor that should al-
ways be considered when selecting pharmacologic
agents.
Combination therapy with secretagogue
Patients who reached the maximum clinically ef-
fective dose of a secretagogue and who have either
insulin resistance or significant postprandial hy-
perglycemia are candidates for the addition of
an insulin sensitizer, an incretin mimetic or in-
sulin. If HbA
1c
has been maintained<11% the
addition of metformin would be indicated by fast-
ing hyperglycemia, thiazolidinedione by general-
ized or postprandial hyperglycemia (with insulin
resistance) and, exenatide by postprandial hyper-
glycemia. The selection is further mediated by
renal and liver function (see details in Table 1:
Combination Therapy Select) as well as degree of
hyperglycemia. For example, the addition of exe-
natide to a sulfonylurea has an incremental benefit
of one percentage point HbA
1c
. Patients above
this threshold, but below 11% HbA
1c
should be
considered for combination with an insulin sensi-
tizer. Patients above 11% HbA
1c
should be started
on a regimen that includes insulin.
Combination therapy with sensitizers
The most common combination is metformin and
sulfonylurea. This combination of pharmacologic
agents reduces HbA
1c
by as much as 4 percent-
age points. As illustrated in Figure 2, patients
whose mean FPG at diagnosis is between 251
and 300 mg/dL (HbA
1c
between 9 and 11%)
with both insulin resistance and insulin deficiency
are most likely to benefit from a combination of
sensitizer and secretagogue. While metformin is
the most common sensitizer to add, TZDs may
also be considered. TZDs target persistent hy-
perglycemia by facilitating target tissue insulin
sensitivity. Their additive benefit is a decrease in
HbA
1c
by 1–2 percentage points. However, when
the principal defect is postprandial hyperglycemia
and the maximum effective dose of metformin has
been exhausted, if the patient is within one per-
centage point of target HbA
1c
, use of exenatide
instead of a secretagogue is indicated.
Combination therapy with incretins
When the combinations of sensitizer and secre-
tagogue fail to achieve the optimum therapeutic
benefit there are three paths that can be selected:
PREVENTION OF TYPE 2 DIABETES 85
1. Add exenatide
2. Add thiazolidinedione
3. Start insulin
If at maximum clinically beneficial dose, the com-
bination oral agent therapy results to within one
percentage point of the upper limit of normal
HbA
1c
and there is evidence of postprandial hy-
perglycemia, consider adding exenatide (see Exe-
natide: SDM Approach). If the principal defect
is fasting and postprandial hyperglycemia and
the HbA
1c
<11% consider adding thiazolidine-
dione. If HbA
1c
≥11%, this signifies insulin de-
ficiency. Generally FPG >300 mg/dL and the
patient presents with clinical symptoms of hyper-
glycemia. Exogenous insulin therapy should be
started.
Insulin therapies
The initiation of insulin therapies is indicated
when insulin levels are below normal. This is of-
ten characterized by HbA
1c
>11%, fasting plasma
glucose >300 mg/dL or symptoms of significant
hyperglycemia. Insulin therapies may be subdi-
vided based on their ability to mimic normal in-
sulin action:
1. Basal/bolus
2. Mixed
3. Basal + oral agents
The regimen that is closest to normal physiol-
ogy is a combination of long-acting insulin, to
supplement basal insulin requirements and rapid-
acting insulin to control postprandial glucose ex-
cursions. This approach generally requires three
or more injections per day. In contrast, mixed in-
sulin (either pre-mixed or self-mixed) generally
relies on combinations of short or rapid-acting and
intermediate-acting insulins to control both basal
and post meal glucose levels.
This approach uses two or three injections and
often requires a fixed daily routine. The t hird,
and generally least physiological approach, is the
combination of a long-acting insulin with an oral
agent. The oral agent may be an insulin sensitizer,
secretagogue or both.
Prevention of type 2 diabetes
Can type 2 diabetes be prevented? The previ-
ous discussion suggested several pathways to the
development of type 2 diabetes. The concept of
genetic predisposition to type 2 diabetes has re-
ceived significant attention. Supporting this the-
ory is the high prevalence of type 2 diabetes
among such genetically homogeneous populations
as American Indians, Samoans, and Hispanics.
Additional evidence comes from the high con-
cordance rate for type 2 diabetes among identi-
cal twins. For t hese groups it has been hypothe-
sized that their high prevalence is due to “thrifty
genes.”
23
The idea of a thrifty gene that favors
storing energy over expending energy is supported
by a high preponderance of obesity in these high-
prevalence groups. This suggests not only a ge-
netic, but also a morphologic explanation linking
hyperglycemia to obesity through insulin resis-
tance.
A genetic explanation of type 2 diabetes is by
the high prevalence of early type 2 diabetes among
women with previous gestational diabetes. Is it pos-
sible to prevent type 2 diabetes in these women, or
are they inevitably likely to develop this disease
due to a genetic predisposition? Recent evidence
suggests that the increased risk of developing type
2 diabetes in women with GDM may be an artifact.
These women may already have type 2 diabetes
which, went undiscovered until their pregnancy.
GDM, may indeed be an early sign of type 2 dia-
betes. Supporting this view are two factors: (1) the
high incidence of subsequent type 2 diabetes; and
(2) an increasing reliance on pharmacological in-
terventions to control blood glucose in pregnancy.
86 TYPE 2 DIABETES
Contradicting this view is the wide variation (20 to
80 per cent) in the incidence of subsequent type
2 diabetes. In fact, the risk is altered if there is
no family history of diabetes, the pregnancy was
uncomplicated by obesity, and where there are no
subsequent pregnancies.
Do genetic, morphologic, and physiologic fac-
tors combine to cause type 2 diabetes, or do they
act independently? Evidence supports all three po-
sitions. Most likely, the risk of type 2 diabetes
will be highest among women who have a family
history of t ype 2 diabetes, are significantly obese,
and have experienced gestational diabetes. In con-
trast, the lowest risk would be in lean Caucasian
males with no family history of diabetes. The
need to clarify the impact of these three factors
is based on the question as to what could be done
to prevent the inevitability of developing type 2
diabetes. For example, if genetic factors were the
key, then insulin-sensitizing agents would be ben-
eficial well in advance of overt hyperglycemia.
If, on the other hand, obesity were the princi-
pal factor, medical nutrition therapy as well as
increased exercise/activity would be beneficial to
prevent type 2 diabetes. If, however, pancreatic
β-cell exhaustion is the root cause, early use of
insulin combined with drugs that block rapid ab-
sorption of carbohydrates may be the solution. If a
combination of factors leads to diabetes, perhaps
prevention will require a combination of inter-
ventions. This has been demonstrated in a series
of studies completed in Europe and the United
States. Collectively they support the notion that a
careful assessment of risk factors, interventions
in lifestyle that may modify these factors, and
ultimately consideration of pharmacologic agents
may be the best means of preventing the onset
of type 2 diabetes. The US multi-center Dia-
betes Prevention Program (DPP) and The Finnish
Diabetes Prevention Study have shown that in-
tensive interventions aimed at significant changes
in life style (reduction in caloric intake and in-
creased consistent activity) lower weight, which,
in turn, reduces the risk of developing overt type 2
diabetes.
24,25
In the presence of such data it is
necessary to – at the very least – promote appro-
priate nutrition and activity level combined with
very close surveillance so that those at the highest
risk (impaired glucose homeostasis) could be of-
fered treatment. When these intensive steps fail
to arrest the deterioration in glycemic control,
then non-hypoglycemic pharmacological agents,
such as metformin and thiazolidinediones, might
be used. In the DPP, metformin was able to re-
duce the incidence of type 2 diabetes by 31 per
cent compared with placebo. The reduction in risk
was even more dramatic in obese patients with
body mass index greater than 35 kg/m
2
.
Note: Before continuing, it might be helpful to
review the structure of Staged Diabetes Manage-
ment for type 2 diabetes. The SDM Decision-
Paths and Practice Guidelines present the stages
and phases of diabetes diagnosis and treatment.
Phases refer to three specific periods in diabetes
management – start treatment (diagnosis and ini-
tial therapy), adjust treatment (modifying therapy
in order to achieve glycemic targets), and maintain
treatment (reaching the therapeutic goal). Stages
are the treatment options. This information should
be shared with the patient and family members.
Type 2 diabetes detection and treatment
(The following guidelines are for non-pregnancy.
Type 2 diabetes complicated by pregnancy is
discussed in Chapter 6.)
This discussion provides the basis for screening,
diagnosis, and treatment of type 2 diabetes. It be-
gins with the Type 2 Diabetes Practice Guidelines,
followed by t he Master DecisionPath. The latter
lays out an orderly sequence of therapeutic stages
shown to i mprove glycemic control. Specific De-
cisionPaths for each stage (treatment options) as
well as Diabetes Management Assessment De-
cisionPaths (medical visit, education, nutrition,
adherence assessment) along with a complete de-
scription of each item and the rationale for deci-
sions are also presented.
As this section is reviewed, note the following: