Staged diabetes management a systematic approach - part 5 pdf
Bạn đang xem bản rút gọn của tài liệu. Xem và tải ngay bản đầy đủ của tài liệu tại đây (354.74 KB, 41 trang )
TYPE 2 DIABETES IN CHILDREN AND ADOLESCENTS 185
Insulin therapy
Because initiation of insulin is a major step in di-
abetes therapy, it may be helpful to review with
the patient and the family some key principles of
care and the Type 2 Diabetes Master DecisionPath
for Children and Adolescents (see Figure 5.15). I t
is important to note that patients starting insulin
may need a revised food plan and exercise pro-
gram synchronized to insulin action, and referral
to a dietitian is strongly encouraged.
Hyperinsulinemia, hypoglycemia, and
weight gain.
Introducing exogenous insulin to
improve glycemic control raises concerns about
hypoglycemia and weight gain. While hyper-
glycemia may indeed be rectified, if insulin is
introduced too rapidly at high doses patients may
experience symptoms of relative or “true” hy-
poglycemia. It is not uncommon to lower blood
glucose by >100 mg/dL ( 5.6 mmol/L) when high-
dose insulin is used. In SDM, insulin is started
at the lowest safe dose and is adjusted slowly
so that HbA
1c
decreases at a rate of 0.5–1 per
cent HbA
1c
per month (or average SMBG of
15–30 mg/dL [0.8–1.7 mmol/L]). At this rate of
improvement there is time to address weight gain
issues. For newly diagnosed patients with severe
hyperglycemia prior to the initiation of insulin,
there may have been modest weight loss (both by
volume of fluid loss and glucose excretion). Using
insulin to restore near-normal glycemia is often
accompanied by a 3–10 lb (1.5–5 kg) weight
gain. This is normal and can be minimized by
modifying diet or increasing exercise/activity at
the start of insulin therapy. As part of an intensive
regimen, the exogenous insulin may cause some
“hunger”. There is a tendency to chase the insulin
with food, which results in added caloric intake.
This can be prevented by maintaining the same
carbohydrate intake and moving the carbohydrate
to synchronize with insulin action and/or adjust-
ing the insulin regimen. (For example, if due to
the peak action of intermediate-acting insulin the
patient experiences mid-afternoon hypoglycemia,
reduce the caloric intake at the midday meal and
use some of these calories [carbohydrate] for a
mid-afternoon snack. The net effect is to maintain
the same caloric intake, but to distribute it more
effectively to reduce hypoglycemia.)
Treatment options. Insulin therapy in type 2
diabetes is similar to that for type 1 diabetes be-
cause the same insulins and regimens are used
(although pump therapy is relatively rare in type
2 diabetes). Where the two differ is how the in-
sulin is used to overcome the underlying defect.
In type 1 diabetes the destruction of the pancreatic
β-cell results in an absolute insulin deficiency, re-
quiring total reliance on exogenous insulin. This is
rarely the case in type 2 diabetes. Depending upon
the duration of disease and the severity of insulin
resistance and relative insulin deficiency, exoge-
nous insulin has varying functions. Individuals
with type 2 diabetes retain the ability to produce
and secrete insulin although it may not be enough
to meet the metabolic demands of insulin resis-
tance. The defect may be in the timing of insulin
secretion (defects in first-phase insulin secretion),
amount of insulin that can be produced by the β-
cell r esulting in a relative insulin deficiency, or
insulin resistance. Thus the choice of therapy first
takes into consideration the underlying defects. In
most children and adolescents requiring insulin
at diagnosis, the underlying defect is related to
both a relative insulin deficiency and insulin re-
sistance. Thus, the exogenous insulin will have to
address both of these defects and generally calls
for higher-dose insulin compared with a child or
adolescent with type 1 diabetes.
There are several approaches to insulin ther-
apy. SDM divides each insulin regimen into two
components: basal or background and bolus or
meal related. Combinations of basal and bolus in-
sulin can be used for conventional and intensive
management. In conventional insulin therapy, in-
sulin action is matched to carbohydrate intake (see
Chapter 3 for insulin action curves). This regi-
men relies on a consistent schedule of food intake
and exercise/activity. Since insulin is given to an-
ticipate when food is ingested, it is important to
maintain a consistent eating schedule and carbo-
hydrate intake that is synchronized to insulin ac-
tion. Typically the conventional regimens require
fewer injections and mixing of different types of
insulin (see Table 5.3). Once the most popular
186 TYPE 2 DIABETES AND METABOLIC SYNDROME IN CHILDREN AND ADOLESCENTS
Table 5.3 Selecting insulin: Stage 2, 3, or 4
Primarily fasting Primarily post-prandial Fasting and post-prandial Cannot detect
hyperglycemia hyperglycemia hyperglycemia problem
Stage 2 X
Stage 3 X
Stage 4 (Physiologic) X X X X
regimen, it is now being replaced by a more phys-
iologic insulin delivery regimen: intensive insulin
therapy. In this regimen, insulin is altered to match
energy intake and expenditure. The regimens con-
sist of three or more injections of insulin per day
and are co-ordinated with food intake and activity
level. Because it comes closer to mimicking the
normal physiologic state, intensive insulin ther-
apy provides a better chance of optimizing blood
glucose control. Typical of this approach are fre-
quent changes in insulin dose and more frequent
SMBG. The goal of both approaches is to op-
timize glycemic control with fewer episodes of
hypoglycemia.
In general, regimens requiring administration of
insulin before meals and large snacks are far more
physiologic, generally require less total insulin,
and usually result in a more flexible schedule for
the patient. Many physicians and patients are con-
cerned with the discomfort of multiple-injection
insulin regimens. Studies have repeatedly shown
that the newer fine-gauge needles (30 and 31
gauge) are nearly painless if proper injection tech-
nique is followed. Additionally, needleless insulin
delivery devices are available to help patients
with needle phobia. Currently studies are under-
way testing the feasibility, safety, and efficacy
of inhaled insulin preparations, which may make
multiple insulin administration more acceptable to
patients (and health care providers).
For consistency, the insulin therapies supported
by SDM use pre-meal (bolus) and bedtime (basal)
as the times to administer insulin. Whether basal
or bolus, conventional or intensive, generally in-
sulin may be given at four specific times dur-
ing a day related to meals, activity, and sleep.
The times are before breakfast (fasting), midday
meal, evening meal, and at bedtime (3–5 hours
after the evening meal). The insulins are denoted
as short-acting regular (R), rapid-acting (RA),
intermediate-acting (N), and long-acting glargine
(G). SDM recommends writing out insulin regi-
mens using these specific times and types of in-
sulin. For example, R/N–0–R–N denotes break-
fast regular and intermediate insulin, no insulin
before lunch, regular insulin before the evening
meal, and intermediate insulin before bedtime. See
Chapter 3 for a complete review of insulin action
curves.
Medical nutrition therapy is continued through-
out all stages of therapy. In newly diagnosed
patients, MNT is i nstituted along with insulin
initiation and generally follows the carbohydrate
counting method. MNT with insulin follows the
same general principles as stated in the weight
management section of this chapter.
Short-acting insulin: choosing between regular
or rapid-acting. No clear criteria currently exist
for choosing between regular short-acting and
rapid-acting insulin for type 2 diabetes. However,
in clinical practice, some principles have emerged
that may be helpful in choosing between these
two forms of insulin. For patients whose lifestyle
makes food and activity planning very difficult,
RA, which is injected just prior to eating and has
a more predictable action curve (peak within 1 to
1
1
/
2
hours, overall action 3 hours), is the preferred
choice. For patients already under treatment for
whom regular insulin before each meal has not
resulted in improved post-prandial glucose levels,
replacement of R with RA is recommended. This
maintains the patient on the same number of
injections. For all other patients, at diagnosis or
in treatment, either R or RA could be used at
the same dose. RA is preferred in SDM because
it is generally more predictable and can be more
easily adjusted. For children and adolescents with
type 2 diabetes the major criteria are twofold:
TYPE 2 DIABETES IN CHILDREN AND ADOLESCENTS 187
convenience and predictability. Fewer injections
of regular insulin are more convenient, but require
that meals and snacks be taken at the same time
each day. R has a variable peak action and a
long-lasting “tail” that make it difficult to predict
its action curve. RA insulin is more predictable
because of its shorter action curve, but would
require insulin administration prior to each meal
(and sometimes before snacks). Some would argue
that children cannot be expected to do this. In
actuality children with type 1 diabetes have been
administering their own insulin throughout the
day, even in school. When starting insulin in
a child with type 2 diabetes it may be helpful
for health professionals to consider the manner
in which a child with type 1 diabetes would be
treated.
Intermediate or long-acting insulin: choosing
between N and glargine. In general glargine is su-
perior to N in terms of both predictability and
convenience. One injection per day of G at bed-
time should provide sufficient basal insulin for a
24 hour period without any peak action. However,
some patients may require splitting the dose of G
for optimal basal insulin coverage. In contrast, N
requires two injections and each may peak at be-
tween 6 and 9 hours after administration. When
taking N it must be certain that food is available
during its peak action to prevent hypoglycemia.
Patients tend to overreact, eating snacks through-
out the day to anticipate a hypoglycemic reaction.
Starting insulin with a new diagnosis of type
2diabetes.
At diagnosis of type 2 diabetes, initi-
ation of insulin therapy should occur immediately,
without regard to symptoms, if fasting plasma glu-
cose is >300 mg/dL (16.7 mmol/L), casual plasma
glucose is >350 mg/dL (19.4 mmol/L), or ketones
are present. At these high plasma glucose levels,
medical nutrition therapy alone or in combination
with an oral agent (metformin) will not normally
sufficiently lower the blood glucose level into the
target range. Furthermore, patients with persistent
hyperglycemia at these levels experience glucose
toxicity. Therefore they are at increased risk for
hyperglycemic hyperosmolar syndrome (HHS). Fi-
nally, some children may be developing type 1
diabetes, for whom insulin therapy will prevent di-
abetes ketoacidosis.
Determine whether insulin will be initiated on
an inpatient or outpatient basis.
Many institutions have developed systems that
allow for the safe initiation of insulin on an
outpatient basis. If resources for education and
medical follow-up are not available, the patient
should be hospitalized. If the patient is at risk for
HHS (see Chapter 10), if there is uncertainty as
to type of diabetes, or if the individual cannot
care for him or herself, consider hospitalization
immediately.
Preparing the patient to use insulin:
multiple injections and insulin adjustment.
Blood glucose monitoring. All patients or their
family caregiver should be performing SMBG,
independent of the number of injections. These
data are necessary for meaningful communica-
tions between the patient and the health care pro-
fessional. The type of meter to be used for SMBG
varies. However, SMBG should have these im-
portant attributes. First, the SMBG meter should
have a memory, making it possible to record
and store data for retrieval. This also increases
the accuracy and reliability of the patient’s infor-
mation. Second, the skills needed by the patient
should be simple, with regard to use of the de-
vice. Third, testing should be scheduled to coin-
cide with meals, activity, and insulin adjustments
to optimize collecting data for clinical decision-
making. Fourth, testing should take into account
the need to adjust insulin doses based on changes
in blood glucose.
Unlike the case with oral agent regimens, pa-
tients or their caregivers are expected to play a
very important role in the daily adjustments in
insulin dose. There are two approaches to ad-
justing treatment using SMBG data – pattern or
immediate response. The t wo are meant to ad-
dress most situations. When they do not, it is
generally necessary to collect more SMBG data
and to confirm that the patient’s behaviour is
consistent with the instructions. Pattern response
suggests that each individual has a consistent
set of blood glucose/insulin relationships. This
188 TYPE 2 DIABETES AND METABOLIC SYNDROME IN CHILDREN AND ADOLESCENTS
consistency is characterized by predictable pat-
terns in which specific insulin doses are related
to known glycemic levels. For example, increas-
ing the morning intermediate-acting N insulin will
consistently result in a decrease in late-afternoon
(pre-evening meal) blood glucose levels. There-
fore, the purpose of initial SMBG is to determine
whether such a pattern can be easily identified.
When, after trial and error (even within 3 days)
such a pattern has been identified, treatment of
type 2 diabetes may follow a predictable path.
Generally, however, identifying a specific pattern
takes substantially longer. Because of changes
in food plan, exercise/activity, seasons, and so
on, patterns may change. Therefore, the concept
of patterned response should be continually re-
assessed.
Immediate response recognizes that an acute sit-
uation has developed requiring an immediate ac-
tion such as hypoglycemia (insulin reaction), hy-
perglycemia, or an anticipated change in food plan
or exercise. This occurs whenever blood glucose
is below 60 mg/dL (3.3 mmol/L) or greater than
250 mg/dL (13.9 mmol/L). Refer to “Hospitaliza-
tion for Problems Related to Glycemic Control”
in Chapter 10 for additional information.
Insulin Stage 2, 3 or P hysiologic Insulin
Stage 4?.
For newly diagnosed children or ado-
lescents starting insulin therapy, the Type 2 Dia-
betes Master DecisionPath (see Figure 5.15) indi-
cates three insulin regimens using rapid or short-
acting and intermediate or long-acting insulins.
The conventional approach is to begin with Stage
2 and proceeds to the next stages if this two-
injection regimen fails to bring the patient into
glycemic control. An alternative approach which
SDM has been found to be very effective is to
begin with bedtime long-acting (G) insulin with
subsequent addition of injections of RA before
each meal as needed for daytime management of
post-prandial hyperglycemia (i.e. 0–0–0–G built
up to RA–RA–RA–G). Basically this is the most
physiologic of the insulin regimens supported by
SDM. This section discusses each regimen begin-
ning with Stage 2. However, it should be noted
that children and adolescents generally have a
variable schedule characterized by unpredictabil-
ity. Unless the scheduled can be fixed, it is recom-
mended that the patient be given an opportunity
to try the most flexible regimen – modified Stage
4 beginning with bedtime G. This will require a
substantial number of SMBG tests over the first
several weeks to assure adequate insulin coverage
for each meal. In the long term it should fit into
the variable schedule of most children.
Insulin Stage 2: conventional (mixed)
approach.
This is the most conservative ap-
proach using the smallest number of injections.
Its only major limitation is that the child or ado-
lescent cannot skip meals and activity levels must
also be regimented. Following a thorough his-
tory, physical, and laboratory evaluation and after
review of the target blood glucose levels, the de-
cision as to whether to hospitalize to start the
patient on an insulin regimen should be made. In
most cases hospitalization is unnecessary. Assum-
ing that insulin will be started on an ambulatory
basis, the time of insulin initiation becomes the
next question.
Note: For all insulin therapies the starting
dose formula has been carefully selected to
meet the immediate metabolic requirements
of the individual while reducing the risk of
hypoglycemia and severe hyperglycemia.
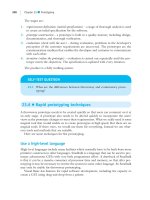
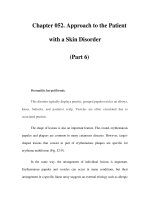
Insulin Stage 2/Start
R/N–0–R/N–0 or RA/N–0–RA/N–0
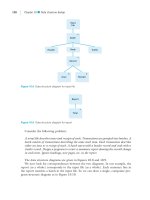
Morning insulin start. If the first time the pa-
tient starts this therapy is in the morning, the
total daily dose is calculated as 0.3 U/kg (see
Figure 5.19). The total daily dose is divided into
two periods roughly associated with breakfast and
the evening meal (approximately 10 hours apart).
The pre-breakfast dose is two-thirds of the to-
tal daily requirement. This is further divided into
one-third R or RA and two-thirds N. The small
amount of R or RA is to cover breakfast. The
intermediate-acting insulin is to cover lunch and
TYPE 2 DIABETES IN CHILDREN AND ADOLESCENTS 189
Start Insulin Stage2
RA/N–0–RA/N–0
R/N–0–R/N–0
Calculate total dose at 0.3 U/kg based on current weight
Distribution of daily dose
RA/N or R/N ratio
AM
2/3
1:2
MIDDAY
0
–
PM
1/3
1:1
BT
0
–
Pre-mixed insulin may be used for patients unable to
draw insulin correctly or who have less than optimal
caregiver involvement/support.
Refer patient and caregiver for nutrition and diabetes
education
Follow-up
Medical:
Education:
Nutrition:
daily phone contact for 3 days, then office
visit within 1 week; 24-hour emergency
phone support needed
within 24 hours, then office visit in 2 weeks
within 1 week
Insulin Stage 2/Adjust
Start Medical Nutrition Therapy
At Diagnosis or from Oral Agent Stage, or
Oral Agent and Insulin Stage
If acutely ill, hospitalize and start insulin immediately;
otherwise, start insulin within 1 week and consider
hopitalization if outpatient (and caregiver) education
not available
Figure 5.19 Type 2 Insulin Stage 2/Start for Chil-
dren and Adolescents
the afternoon period. Review the insulin action
curves described in Chapter 3. Note the likely
times of peak action. Glucose excursions after
lunch will have to be measured by SMBG between
2 and 4 hours post-meal to determine whether ad-
equate insulin is available. Daytime activity will
also affect blood glucose levels. With adolescents
and children it is very important that SMBG be
done before and following activity to gauge the
impact of the physical activity on glucose level.
Because weekdays (in school) and weekends dif-
fer substantially, it may be necessary to readjust
the insulin regimen. The pre-evening meal insulin
is calculated as one-third of the total daily dose
equally split between R or RA and intermediate-
acting insulin and given as one injection before
the evening meal. For example, a patient with a
current weight of 100 lb (45 kg) would receive 14
total units of insulin. Of the 14 units, nine would
be given in t he AM and five in the PM. Of the
nine units in the AM, six units would be N and
three units would be R or RA. The PM dose would
be three units N and two units R or RA (due to
rounding the R or RA was kept at less than 1:1
ratio with the N). Note that if premixed insulins
is used it cannot easily be adjusted.
Afternoon or evening insulin start.Ifthether-
apy is being started in the afternoon or evening,
the starting dose is one-third the normal total daily
dose (0.1 U/kg), which is equally divided between
N and R or RA insulin and administered just prior
to the evening meal. The next day the patient
would be on the total daily dose (0.3 U/kg) as de-
scribed above. The patient should be taught both
insulin administration technique and how to mon-
itor blood glucose. SMBG should be performed
every 4 hours until the next day. If blood glucose
levels are >250 mg/dL (13.9 mmol/L), consider
additional small doses (1–2 units) of R or RA
with SMBG 2 hours after the i nsulin injection.
This therapy is temporary. Have the patient return
the next morning to initiate daily insulin adminis-
tration (see previous section).
Immediate follow-up. Self-monitored blood glu-
cose is the best way to assess the impact of insulin
therapy. The minimum SMBG for this treatment
regimen is five times per day (before meals, at
bedtime, and at 3AM). An evening snack may
be necessary to prevent overnight hypoglycemia.
One or two carbohydrate choices taken from ear-
lier in the day and moved to bedtime can be
provided as a snack.
During the first several days it is imperative to
maintain glucose levels at a point that will avoid
both hypoglycemia and hyperglycemia. Addition-
ally, co-management with the various health pro-
fessionals (nurse educator and dietitian, if avail-
able) who will be involved in diabetes care must
be established. This is especially important in
ambulatory management. The guidelines for in-
sulin adjustments begin immediately, along with
making arrangements for follow-up diabetes and
nutrition education and establishing target blood
glucose levels.
Although near euglycemia is the overall goal of
treatment to prevent microvascular and macrovas-
cular complications (see the end of this chapter
and Chapters 8 and 9 for further information),
190 TYPE 2 DIABETES AND METABOLIC SYNDROME IN CHILDREN AND ADOLESCENTS
any improvement from baseline benefits individ-
uals with type 2 diabetes. Setting the initial goal
at fasting <200 mg/dL (11.1 mmol/L) and post-
meal <250 mg/dL (13.9 mmol/L) is the first
step in ensuring eventual near-normal levels of
blood glucose. This interim target was estab-
lished to promote the overall goal of gradual
(safe) reduction in blood glucose. While any im-
provement in blood glucose is acceptable, the
overall long-term goal is to achieve near-normal
glycemic control. Thus, it is appropriate to re-
act to consistent patterns of high blood glucose
with increased insulin after assessing adherence
issues.
Medical nutrition therapy. As with all pharma-
cologic therapies, medical nutrition therapy is part
of the overall treatment approach. Start as if the
person were treated solely by nutrition therapy
(see Medical Nutrition and Activity Therapy/Start
and Weight Management Start for children and
adolescents). Modifying the nutrition therapy to
avoid hypoglycemia may be necessary. To do this,
consider altering the timing of both food intake
and exercise to synchronize with the insulin ac-
tion curve. Some initial weight gain may occur
with the introduction of insulin. This is due to
the uptake and metabolism of glucose as glycemic
targets are being reached or as a result of rehy-
dration. Subsequent weight gain, however, may
be due to chasing insulin with food or poor adher-
ence to MNT recommendation. Since children and
adolescents are in an active growing period, “nor-
mal” weight gain needs to be differentiated from
weight gain due to the insulin regimen. The key
is to utilize the growth-related curves and to dif-
ferentiate between symmetrical and asymmetrical
growth. Individuals whose height and weight are
in the 90th percentile are experiencing symmet-
rical growth patterns, whereas individuals whose
weight is in the 90th percentile and height in
the 50th percentile are asymmetrical and likely
to have a BMI >85th percentile.
In SDM, alterations in the timing of meals,
snacks, and exercise are the principal tools by
which hyperglycemia and hypoglycemia are pre-
vented. If persistent hyperglycemia or hypogly-
cemia do occur, immediately consider changing
the insulin regimen.
Table 5.4 Insulin Stage 2 pattern adjustment
guidelines (see Figure 5.20 for letter designations)
Insulin Stage 2 Pattern Adjustments
RA/N–0–RA/N–0 or R/A–0–R/N–0
Ͻ70 mg/dL
(Ͻ3.9 mmol/L)
140–250 mg/dL
(7.8–13.4 mmol/L)
Ͼ250 mg/dL
(Ͼ13.4 mmol/L)
AMor
3 AM
MIDDAY
(MID)
PM
BEDTIME
(BT)
1–2 U (a,b) 1–2 U (a,k) 2–4 U (a,k)
1–2 U (c,e) 1–2 U (f,g,k) 2–4 U (f,g,k)
1–2 U (d,e) 1–2 U (f,h,k) 2–4 U (f,h,k)
1–2 U (e) 1–2 U (f,k) 2–4 U (f,k)
Ͻ100 mg/dL
(Ͻ5.5 mmol/L)
160–250 mg/dL
(8.9–13.9 mmol/L)
Ͼ250 mg/dL
(Ͼ13.9 mmol/L)
Adjust insulin based on BG patterns
May increase or decrease dose by 1–2 U or 10% of dose
Follow-up
Medical: weekly while adjusting insulin, then office visit within 1–2
months
PM
RA or RPM RA or R
AM NAM N
AM RA or RAM RA or R
PM NPM N
PM RA or R
AM N
AM RA or R
PM N
Insulin Stage 2/Adjust
R/N–0–R/N–0 or RA/N–0–RA/N–O
Adjustments to Insulin Stage 2 are based on pat-
terns of SMBG values (see Table 5.4).
Follow these general principles:
• Look for a pattern – at least 3 days of similar
blood glucose values.
• Make initial adjustments to target the consis-
tently low blood glucose first. Follow this by
targeting patterns of high blood glucose.
• Normally, target only one insulin at a time –
either N, R, or RA) – at one time point (AM
or PM).
• Change dose by 1–4 units depending on the
level of hyperglycemia.
• Become familiar with insulin action curve
principles (see Chapter 3).
• Avoid adding calories to total food intake to
prevent hypoglycemia. Instead, move carbo-
hydrate choices (e.g. save dessert for bedtime
snack).
TYPE 2 DIABETES IN CHILDREN AND ADOLESCENTS 191
How to Use These Tables
1. Find current insulin stage
2. Find the pattern of blood glucose problem (column)
3. Identify time of day (row) pattern occurs
4. Recommended adjustment is given where the column and row
intersect
5. See notes for additional considerations
Insulin Pattern Adjustments
Adjust insulin from 3 day pattern of typical schedule
Determine which insulin is responsible for pattern
Adjust by 1–2 units or 10% of dose
Adjust only one dose at a time
Correct hypoglycemia first
If total dose Ͼ1.0 U/kg, consider adding metformin
If hyperglycemia throughout day, correct highest average
target SMBG first; if all within 50 mg/dL (2.7 mmol/L) of
target, correct
AM first
Notes
a. Evaluate nocturnal hypoglycemia; check 3
AM BG
b. Consider adjusting bedtime snack
c. Consider adding or adjusting mid-morning snack
d. Consider adding or adjusting afternoon snack
e. Evaluate if prior activity is causing hypoglycemia
f. Consider adding activity
g. Consider decreasing mid-morning snack
h. Consider decreasing afternoon snack
i. No mid-morning snack usually needed with RA
j. No afternoon snack usually needed with RA
k. Use of regular insulin in place of rapid-acting (RA)
necessitates snacking. If possible, use RA insulin in children
and adolescents.
Figure 5.20 Type 2 diabetes insulin adjustment
considerations for children and adolescents
Target blood glucose and insulin adjustments.
During the first several months of insulin ther-
apy, the patient should demonstrate improved
glycemic control. HbA
1c
should drop by approx-
imately 0.5–1 percentage point per month and
mean SMBG 15–30 mg/dL (0.8–1.7 mmol/L). If
these rates are met, the same insulin doses are
kept. If the rates are not met, increase the insulin
doses following the adjustment guidelines.
Insulin Stage 2/Maintain
R/N–0–R/N–0 or RA/N–0–RA/N–0
When SMBG and HbA
1c
targets are met, al-
terations to the insulin, food plan, and exercise
regimens are still likely to be required to main-
tain near-normal blood glucose levels. To prevent
both hyperglycemia and weight gain, encourage a
schedule of blood glucose and weight monitoring.
While neither need be as regimented as during
start and adjust phases, both are required to de-
tect either increasing blood glucose or weight. At
a minimum, SMBG should occur prior to each
insulin injection, with at least one daily 2-hour
post-prandial (at varying meals each day). Weight
should be monitored weekly. Some changes in in-
sulin dose and timing should be expected. The
patient might be provided with some general rules
for making insulin adjustments based on consis-
tent patterns of blood glucose.
Moving to Insulin Stage 3
Insulin Stage 3/Start: from Insulin Stage 2
R/N–0–R–N or RA/N–0–RA–N
Three conditions can be addressed by Insulin
Stage 3 that may have been encountered in Insulin
Stage 2:
• morning fasting blood glucose consistently
above target range
• nocturnal hypoglycemia
• varying time of evening meal
Morning fasting blood glucose may be high for
several reasons. The principal causes relate to a
high bedtime glucose, early AM excessive glu-
cose output (dawn phenomenon), Somogyi effect,
insufficient exogenous basal insulin and lack of
adherence to MNT (large bedtime snacks). One
consequence of relative insulin deficiency may
be excess hepatic glucose production (gluconeo-
genesis). The second factor, high evening blood
glucose, is usually the result of a larger evening
meal or proportionately higher carbohydrates at
the evening meal and at bedtime. The third cause
for high fasting plasma glucose, dyschronized in-
sulin peak action, may result in low blood glu-
cose from 2 to 4 AM and a rebound to hyper-
glycemia ( Somogyi effect) by morning. The lat-
ter is often the cause of nocturnal hypoglycemia.
Alternatively, nocturnal hypoglycemia may result
from too much intermediate-acting insulin at din-
ner coupled with insufficient bedtime snack. If
192 TYPE 2 DIABETES AND METABOLIC SYNDROME IN CHILDREN AND ADOLESCENTS
At Diagnosis or from Oral Agent Stage or Insulin Stage 2
If acutely ill, hospitalize and start insulin immediately;
otherwise, start insulin within 1 week and consider hopitalization
if outpatient (and caregiver) education not available
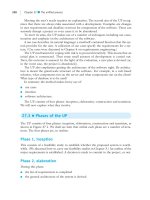
Start Insulin Stage 3
RA/N–0–RA–N
R/N–0–R–N
Calculate total dose at 0.3 U/kg based on current weight
Distribution of daily dose
RA/N or R/N ratio
AM
2/3
1:2
MIDDAY
0
–
PM
1/6
–
BT
1/6
–
From Insulin Stage 2
Refer patient for nutrition and diabetes education
Follow-up
Medical:
Nutrition/
education:
if new insulin start, daily phone contact for 3
days, then office visit within 1 week; 24-hour
phone support needed
if changing therapies, phone or office visit
within 1 week, then office visit within 1 month
if new insulin start within 24 hours, other
wisewithin 1 week
Insulin Stage 3/Adjust
Start Medical Nutrition Therapy
If current total dose is Ͼ1.5 U/kg, consider decreasing
dose to 1.0 U/kg, otherwise use current total dose
Move PM N to bedtime (BT)
RA or R may be modified for activity and timing of meals
•
•
•
At Diagnosis or New Insulin Start
Refer patient and caregiver for nutrition and diabetes education
Figure 5.21 Type 2 Insulin Stage 3/Start for Chil-
dren and Adolescents
adjustments to the Insulin Stage 2 regimen have
failed to overcome these problems, moving the
intermediate-acting insulin to at least 3 hours af-
ter the evening meal (this bedtime injection is
shown as BT in figures and tables) should pro-
vide some resolution. Before doing this, however,
be certain that overinsulinization has not occurred
(>1.0 U/kg). If this is suspected, consider reduc-
ing the total daily insulin dose to 1 U/kg and
redistributing it according to Insulin Stage 3 (see
Figure 5.21).
To start Insulin Stage 3, move the current dose
of evening meal N insulin to bedtime. Make
certain SMBG occurs at this time. One or two
carbohydrate choices from earlier in the day can
be moved as a bedtime snack. Readjust both the
evening R or RA and the morning R or RA
after 3 days on this regimen. Most probably t he
morning R or RA will be reduced and the evening
R or RA will be increased. The total daily dose
should still follow the pattern of a maximum of
1.5 U/kg.
Before beginning pattern adjustment, determine
which insulin is responsible for the glucose pat-
tern. Intermediate-acting insulin (N) is meant to
reach its peak near the morning to lower the fast-
ing blood glucose value. The overlap of R and
N between midnight and 2 AM may require ad-
justing the evening snack. This should not be
the case in individuals using RA because of its
shorter action curve. In addition, residual bedtime
N may be present when the morning R or RA is
administered. Measurement of blood glucose post-
breakfast thus becomes important when starting
Stage 3.
Insulin Stage 3
Most newly diagnosed patients do not start with
three injections because historically this is used
in patients who were started on I nsulin Stage
2 and ultimately required bedtime intermediate-
acting insulin. There is no reason that the three-
injection regimen could not be used at diagnosis
(this is often the case in gestational diabetes). If
Insulin Stage 3 is used at diagnosis, make certain
that a thorough history, physical, and laboratory
evaluation are completed and that the target blood
glucose levels are reviewed.
Note: For all insulin therapies the starting
dose formula has been carefully selected to
meet the immediate needs of the individual
while reducing the risk of hypoglycemia as
well as hyperglycemia.
Insulin Stage 3/Start: at diagnosis
R/N–0–R–N or RA/N–0–RA–N
Morning insulin start. If the patient starts this
therapy in the morning, the total daily dose is cal-
culated as 0.3 U/kg (see Figure 5.21). The total
TYPE 2 DIABETES IN CHILDREN AND ADOLESCENTS 193
daily dose i s divided into three periods associated
with breakfast, the evening meal (approximately
10 hours apart), and bedtime (at least 3 hours af-
ter dinner). The pre-breakfast dose is two-thirds
of the total daily requirement. This is further di-
vided into one-third R or RA and two-thirds N.
The R or RA insulin is to cover breakfast and the
intermediate-acting insulin N is to cover lunch and
the afternoon period. The evening dose is calcu-
lated as one-third of the total daily requirement
and evenly split between R or RA at dinner and
intermediate-acting insulin N at bedtime. By plac-
ing N insulin at bedtime, its principal action is
moved closer to the morning.
Afternoon or evening insulin start.Ifthether-
apy is being started in the afternoon or evening,
the starting dose is one-third the normal starting
dose (0.1 U/kg) equally split between N and R
or RA. The short-acting i nsulin is given before
dinner and the intermediate-acting insulin before
bedtime. The next day the patient would be on
the total daily dose as described above for start-
ing Insulin Stage 3 in the morning. The patient
or family caregiver should be taught both in-
sulin administration technique and how to monitor
blood glucose. Blood glucose should be monitored
(SMBG) every 4 hours. If blood glucose levels are
<250 mg/dL (13.9 mmol/L), consider additional
small doses (1–2 units) of R or RA with SMBG
an hour after the insulin. This therapy is tempo-
rary. Have the patient return the next morning to
initiate daily insulin administration (see previous
section).
During the first several days it is imperative to
maintain glucose levels at a point that will avoid
both hypoglycemia and hyperglycemia. Have the
patient SMBG at least five times per day (before
meals, at bedtime, and at 3AM). Additionally, co-
management with the various health professionals
who will be involved in diabetes care must be es-
tablished. If feasible a nurse educator and dietitian
should be incorporated into care as soon as possi-
ble. The guidelines for insulin adjustments begin
immediately. Along with making arrangements
for both nurse and dietitian follow-up, establish
target blood glucose levels.
Table 5.5 Type 2 Insulin Stage 3/adjust for chil-
dren and adolescents (See Figure 5.20 type 2 dia-
betes insulin adjustment considerations for children
and adolescents)
Insulin Stage 3 Pattern Adjustments
RA/N–0–RA/N–0 or R/A–0–R/N–0
Ͻ70 mg/dL
(Ͻ3.9 mmol/L)
140–250 mg/dL
(7.8–13.4 mmol/L)
Ͼ250 mg/dL
(Ͼ13.4 mmol/L)
AMor
3 AM
MIDDAY
(MID)
PM
BEDTIME
(BT)
1–2 U (a,b) 1–2 U (a,k) 2–4 U (a,k)
1–2 U (c,e) 1–2 U (f,g,k) 2–4 U (f,g,i,k)
1–2 U (d,e) 1–2 U (f,h,k) 2–4 U (f,h,k)
1–2 U (e) 1–2 U (f,k) 2–4 U (f,k)
Ͻ100 mg/dL
(Ͻ5.5 mmol/L)
160–250 mg/dL
(8.9–13.9 mmol/L)
Ͼ250 mg/dL
(Ͼ13.9 mmol/L)
Adjust insulin based on BG patterns
May increase or decrease dose by 1–2 U or 10% of dose
Follow-up
Medical: weekly while adjusting insulin, then office visit within 1–2
months
PM
RA or RPM RA or R
AM NAM N
AM RA or RAM RA or R
PM NPM N
PM RA or R
AM N
AM RA or R
PM N
Insulin Stage 3/Adjust
R/N–0–R–N or RA/N–0–RA–N
The patient should realize that it will be necessary
to frequently adjust the morning short-acting in-
sulin. The first sign of too much morning R or RA
will be post-breakfast or midday hypoglycemia.
Reduction in morning R or RA (see Table 5.5) will
resolve this problem. An additional adjustment
in breakfast carbohydrate intake or mid-morning
snack may be needed. If the pre-evening meal glu-
cose goes up, use the same formula as before, i.e.,
raise the morning N. This will increase the amount
of insulin available to cover carbohydrate intake
at lunch. Alternatively, if the bedtime N lowers
the fasting blood glucose, the intermediate-acting
insulin requirements during the daytime may need
to be reduced. If the pre-dinner blood glucose
is <70 mg/dL (3.9 mmol/L) for three consecu-
tive days, consider lowering the morning N. Keep
in mind the impact of exercise on both when
there is too much or too little insulin. Exercise
in the mid-afternoon should be closely followed
by SMBG before and after the exercise period. If
possible, avoid adding additional calories in or-
der to prevent weight gain. The third adjustments
are related to the bedtime blood glucose l evels.
194 TYPE 2 DIABETES AND METABOLIC SYNDROME IN CHILDREN AND ADOLESCENTS
These are affected most by food intake at dinner
and by the amount of short-acting insulin used.
In addition, many people snack from supper to
bedtime without having a discrete evening meal.
This may influence the type of short-acting in-
sulin selected and/or the dose administered. Blood
glucose at bedtime should not exceed 160 mg/dL
(8.9 mmol/L). Consider increasing R or RA be-
fore dinner or changing the meal content. Hyper-
glycemia at bedtime will often result in a high
fasting blood glucose (see Insulin Stage 2 for gen-
eral principles).
Insulin Stage 3/Maintain
R/N–0–R–N or RA/N–0–RA–N
When patients reach their metabolic targets using
Insulin Stage 3, they enter the maintain treat-
ment phase. In this phase changes in insulin,
food plan, and exercise regimens are likely to be
less frequent. Despite this reduction in changes
to therapy, surveillance with SMBG is necessary.
Because of the addition of a third injection and
perhaps fear of hypoglycemia overnight, some pa-
tients may add too many calories as part of the
evening snack. A schedule of consistent weight
monitoring should be encouraged. While neither
SMBG nor weight monitoring need be as regi-
mented as during start and adjust phases, both
are required to detect trends of either increasing
blood glucose or weight. At minimum, SMBG
should occur prior to each insulin injection with
at least one post-prandial (at varying meals each
day). Because this would mean no fewer than
four tests a day, for patients who have maintained
their metabolic goal for at least 1 month, con-
sider alternate day testing or reducing the number
of tests to two a day at different times each day.
Some changes in insulin dose and timing should
be expected. Food plan should consider further al-
terations in timing and size; carbohydrate and/or
caloric intake should not increase by an appre-
ciable amount. The patient should be reminded of
the general rules, such as relying on 3 day patterns
before changing insulin dose.
Moving from Insulin Stage 3 to Physiologic
Insulin Stage 4
R–R–R–N or G or RA–RA–RA–N or G
The Stage 4 regimen makes insulin adjustments
very easy. Each blood glucose determination has
a direct relationship to the previous insulin dose.
For example, if the bedtime blood glucose level is
high, increase the PM R or R A insulin. Similarly,
if the fasting blood glucose is high, increase the
bedtime N or G.
Before initiating this regimen from Stage 3,
make certain the total daily insulin dose has not
reached >1.5 U/kg, which is indicative of overin-
sulinization. If overinsulization has occurred the
total daily dose can be reduced to 1 U/kg (leav-
ing room for subsequent adjustments). Begin by
recalculating the total daily dose at 1 U/kg. Bed-
time N should be recalculated so that i t is 30 per
cent of the total daily dose. The remaining 70 per
cent of the insulin should be given in the form of
R or RA before each meal. Thus, for the 100 lb
(45 kg) child whose current Stage 3 Insulin was
comprisedof55Ureducethisto45Uandgive
15 U as bedtime N and 10 U as R or RA before
each meal. If the plan is to change to G insulin
then reduce the total daily dose by 20 per cent (45
- 9), resulting in 36 U for t his 100 lb child. Next
divide the total dose into 50 per cent (18 U) of G
at bedtime and 6 U of R or RA before each meal.
This per cent is a reverse of the earlier regimens.
In this case R or RA is used to cover all meal
related increases in blood glucose, while bedtime
N or G is used to provide a basal insulin.
Physiologic Insulin Stage 4: basal/bolus
approach
Multiple injection regimens are far more ad-
justable and will most likely result in a more flex-
ible schedule for the patient. Dividing the insulin
into smaller doses reduces the chance of local
discomfort and provides a more consistent time
action profile. Additionally, regimens with more
injections generally require less insulin overall.
If Insulin Stage 3 failed to move the patient
into the maintain phase of therapy after 6 months
TYPE 2 DIABETES IN CHILDREN AND ADOLESCENTS 195
of experimentation, or if the patient at diagnosis
is willing to try a more intensive regimen then a
four-injection regimen should be considered. The
patient and family should already have been intro-
duced to the Type 2 Diabetes Master DecisionPath
for Children and Adolescents, and alternate thera-
pies, requiring an increased number of injections,
should have been discussed. Stage 4 is the most
physiologic regimen and offers the patient more
flexibility regarding timing of meals. Staged Di-
abetes Management encourages providers to dis-
cuss the advantages of Stage 4 with their patients
and family caregivers, especially those starting in-
sulin at diagnosis or after metformin has failed.
Physiologic Insulin Stage 4/Start: at
diagnosis
R–R–R–N or G or RA–RA–RA–N or G
If starting Stage 4 at diagnosis, ask the patient to
do SMBG four times/day (before each meal and at
bedtime (plus overnight one to two times during
the fi rst week). Two approaches can be used to
initiate this therapy: formula or experiential (see
Figure 5.22). For the formula method calculate the
total daily dose at 0.3 U/kg. If using N insulin,
calculate the amount as 30 per cent of the total
daily dose (of all insulins). Divide the remaining
70 per cent equally and administer as either R or
RA before each meal. Thus, for a 100 lb (45 kg)
child, 14 total units of insulin would be given.
Five units (rounded from 4.5) of N would be given
at bedtime and 3 units of R or RA would be given
before each meal. If using G insulin, 50 per cent of
the total dose (7 units) would be given at bedtime
as G and 2 units (rounded) of R or RA would be
given before each meal, resulting in a total of 13
units. Adjustments to this regimen may be made
after 3 days of a consistent pattern.
If the plan is to follow an experiential approach,
start with N or G at bedtime calculated at 0.1 U/kg
(0–0–0–G or N). During the next 7–10 days
make 1–2 unit adjustments in the dose until 0.3
U/kg has been reached or fasting plasma glucose
(without any hypoglycemia is reduced by at least
60 mg/dL (3.2 mmol/L)). Next, review all blood
At Diagnosis or from Oral Agent Stage or another Insulin Stage
If acutely ill, hospitalize and start insulin immediately; otherwise,
start insulin within 1 week and consider hospitalization if
outpatient (and caregiver) education not available
Start Insulin Stage 4
RA–RA–RA–N or G
R–R–R–N or G
Calculate total dose based on 0.3 U/kg current body weight
Start
BT N at 30% of total dose or BT G at 50% of total dose
Equally distribute remainder of total dose (as RA or R) before each meal
(may be readjusted based on food plan)
Follow-up
Medical:
Education:
if new insulin start, daily phone contact for 3
days, then office visit within 1 week; 24-hour
phone support needed
if changing therapies, phone or office visit with-
in 1 week, then office visit within 1 month
if new insulin start, within 24 hours, otherwise
within 2 weeks
Insulin Stage 4/Adjust
Start Medical Nutrition Therapy
At Diagnosis or New Insulin Start
•
•
•
e.g 100 kg ptϭ 5 U RA–5U RA–5U RA–15U G
From other insulin stage If current total dose is Ͼ1.5 U/kg, consider
decreasing to 1.0 U/kg
For
BT N insulin: Start BT N at 30% of current total dose and equally
For BT G insulin
Reduce current total insulin dose by 20%
Distribute remaining insulin as 50%BT G and 50% RA or R
Distribute RA or R equally before each meal (may be readusted
based on food plan)
e.g. current total dose = 90 Units; new total dose ϭ 72 Units
Distributed as 12 U RA–12U RA–12 U RA–36 U G
•
•
•
(may be readjusted based on food plan)
distribute remainder of total dose (as RA or R) before each meal
Figure 5.22 Type 2 Physiologic Insulin Stage 4/
Start for Children and Adolescents
glucose values to identify the pattern of blood glu-
cose that consistently is highest over more than
3 days (e.g. midday, PM, or bedtime). Add an
injection of RA or R insulin (0.1 U/kg) to the pre-
ceding meal. Thus if the pre-evening-meal BG is
consistently the highest add RA or R insulin prior
to the mid-day meal. The new regimen would be
0–RA–0–G. Adjust this insulin every 3 days by
1–2 units until 0.2 U/kg or the pre-evening-meal
BG has reduced by least 60 mg/dL (3.2 mmol/L).
Repeat this for the next highest blood glucose pat-
tern. Eventually, the patient will be on a regimen
of RA–RA–RA–G at the minimum amount of
insulin necessary to physiologically mimic insulin
requirements.
196 TYPE 2 DIABETES AND METABOLIC SYNDROME IN CHILDREN AND ADOLESCENTS
This gradual introduction of pre-meal insulin
based on SMBG data reinforces the experiential
aspects of diabetes self-management. The child or
adolescent quickly learns how small increments
of insulin given at the appropriate time affect
BG level. By relying on low-dose basal insulin
initially to improve fasting plasma glucose, an
added benefit is that the patient begins the day
with improved glucose levels. Meal related B G
excursions become less dramatic. By identifying
the most serious pattern of hyperglycemia first,
the insulin can be targeted and thereby used more
sparingly. The result i s generally a total insulin
dose of <1 U/kg.
Physiologic Insulin Stage 4/Adjust
R–R–R–N or G or RA–RA–RA–N or G
Because this regimen allows for targeting the in-
sulin action to particular postprandial blood glu-
cose excursions, make certain that SMBG occurs
before each insulin administration. The blood glu-
cose value determined at that point will help de-
cide how well the insulin given before the last
meal worked and will help calculate the i nsulin
to be given at the current meal. Start by identi-
fying the highest blood glucose. Increase by 1–4
units the insulin prior to the high blood glucose
(see Table 5.6). Continue until this blood glu-
cose is lowered to within target. Now find the
next highest blood glucose. Repeat until all blood
glucoses are within target. For example, if the
highest blood glucose is fasting, then increase N
or G by 1–4 units. Once the fasting has been
resolved, turn to the next blood glucose that is
persistently highest. Assume it is the pre-evening-
meal blood glucose. Increase the midday R or RA
by 1–4 units.
Physiologic Insulin Stage 4/Maintain
R–R–R–N or G or RA–RA–RA–N or G
Upon reaching t heir glycemic targets, patients
enter the maintain treatment goal phase. N or-
mally, fewer alterations to insulin, food plan,
Table 5.6 Type 2 Physiologic Insulin Stage 4/Ad-
just for Children a nd Adolescents (See Figure 5.20 type
2 diabetes insulin adjustment considerations for chil-
dren and adolescents)
Insulin Stage 4 Pattern Adjustments
RA–RA–RA–N or G R–R–R–N or G
Ͻ80 mg/dL
(Ͻ4.4 mmol/L)
140–250 mg/dL
(7.8–13.4 mmol/L)
Ͼ250 mg/dL
(Ͼ13.4 mmol/L)
AMor
3 AM
MIDDAY
(MID)
PM
BEDTIME
(BT)
1–2 U (a,b) 1–2 U (a,k) 2–4 U (a,k)
1–2 U (c,e) 1–2 U (f,g,k) 2–4 U (f,g,k)
1–2 U (d,e) 1–2 U (f,h,k) 2–4 U (f,h,k)
1–2 U (e) 1–2 U (f,k) 2–4 U (f,k)
Ͻ100 mg/dL
(Ͻ5.5 mmol/L)
160–250 mg/dL
(8.9–13.9 mmol/L)
Ͼ250 mg/dL
(Ͼ13.9 mmol/L)
Adjust insulin based on BG patterns
May increase or decrease dose by 1–2 U or 10% of dose
Follow-up
Medical: weekly while adjusting insulin, then office visit within 1–2
months
PM
RA or RPM RA or R
AM NAM N
AM RA or RAM RA or R
PM NPM N
PM RA or R
AM N
AM RA or R
PM N
and exercise regimens will be required. However,
surveillance with SMBG is necessary. To prevent
both hyperglycemia and weight gain, encourage
a schedule of blood glucose and weight moni-
toring. At a minimum, SMBG should be done
prior to each insulin injection with at least one
post-prandial (at varying meals each day). Be-
cause this would mean no fewer than four tests
a day, for patients who have maintained their
metabolic goal for at least 1 month, consider
alternate-day testing or reducing the number of
tests to two a day at different times each day.
Some changes in insulin dose and timing should
be expected. Monitor weight at least weekly. Food
plan should consider further alterations in tim-
ing and portion size, keeping in mind that the
total caloric intake should not increase apprecia-
bly. The patient should be reminded of the general
rules for changing insulin doses – a minimum of
3 days of the same pattern. Patients and caregivers
should be reminded to contact their healthcare
provider if blood glucose levels begin to rise.
HbA
1c
should continue to be determined every
3–4 months.
METABOLIC SYNDROME IN CHILDREN AND ADOLESCENTS 197
Metabolic syndrome in children and adolescents
In this section the macrovascular and microvascu-
lar diseases that comprise the metabolic syndrome
(insulin resistance syndrome) in children and ado-
lescents are highlighted. A more complete review
of all associated complications of diabetes is pro-
vided in Chapters 8 and 9.
The exact number of children and adolescents
with the metabolic syndrome is unknown. Cur-
rently, there are seven separate disorders that may
be included in the syndrome:
1. overweight–obesity
2. acanthosis nigricans
3. polycystic ovary syndrome
4. hyperglycemia–pre-diabetes or type 2 dia-
betes
5. dyslipidemia
6. hypertension
7. nephropathy
It is unclear as to how many children and ado-
lescents have one or more of these disorders.
Since a child with any one of these disorders
is then at increased risk for the others, it is in-
cumbent upon health care providers to maintain
close surveillance of any child or adolescent who
has evidence of metabolic syndrome. SDM pro-
vides an assessment guide and a Master Deci-
sionPath for insulin resistance, which reviews the
steps and tests that should be part of the com-
prehensive, ongoing surveillance. Surveillance be-
gins with evaluation of BMI. All children whose
BMI <85th percentile for age and gender should
be evaluated annually for the other elements of
the metabolic syndrome. Similarly, all individuals
with acanthosis nigricans should be evaluated for
co-morbidities associated with insulin resistance.
In both instances, they should be immediately
screened for hyperglycemia, hypertension, renal
disease, and dyslipidemia. For females, discov-
ery of PCOS should be followed by these tests;
alternatively, if other insulin resistance disorders
are discovered first, female adolescents should be
evaluated for PCOS.
Assessment for metabolic
syndrome
Figure 5.23 contains a comprehensive assessment
for the metabolic syndrome in children and ado-
lescents. Briefly, assessment f or the following
conditions is required.
Overweight Irritability,
fatigue,
sleep apnea,
depression
BMI Ͼ85th per-
centile for age and
gender
Ͼ120% ideal body
weight
Pulmonary
hypertension
Central adiposity
Refer to BMI
Tables, A–7,
A–11
See Medical
Nutrition
Therapy and
Activity Therapy
Guidelines
Acanthosis
nigricans
Often none
or cosmetic
Dark, thickened
skin due to hyper-
keratosis of the skin
folds;most common
in young individuals
of color, clinical sign
of insulin resistance
Consider obtain
-ing fasting
insulin level to
ascertain if
hyperinsulinemic
Polycystic
ovary
syndrome
(PCOS)
Oligomenor-
rhea,
hirsutism,
acne, infertil-
ity, rapid
weight gain,
acanthosis
nigricans
Increased total
testosterone, hir-
sutism, acanthosis
nigricans, obesity,
hyperinsulinemia,
dyslipidemia,
oligomenorrhea,
amenorrhea, acne
See PCOS
Practice
Guideline and
Master
Decision Path
Hyperglycemia Often none
Secondary
enuresis
Pre-diabetes: FPG
100–125 mg/dL
(5.6–6.4 mmol/L)
CPG or OGTT 2
hour value
140–199 mg/dL
(7.7–11.0 mmol/L)
Diabetes: FPG
у126 mg/dL (7.0
mmol/L) and/or
CPG у200 mg/dL
(11.1 mmol/L)
on two occasions
See Screening
and
Differential
Diagnosis
Complication
Patient
Complaints
Clinical Evidence Action
Figure 5.23 Assessment for insulin resistance syn-
drome in children and adolescents
198 TYPE 2 DIABETES AND METABOLIC SYNDROME IN CHILDREN AND ADOLESCENTS
Overweight/obesity
Determination of the weight status of children
and adolescents requires use of specially designed
growth and B MI charts (Figure 5.3 and 5.4). See
the beginning of this chapter for a full discussion
of weight management.
Acanthosis Nigricans
Insulin resistance in peripheral tissue induces a
chronic state of hyperinsulinemia. The high lev-
els of insulin cause cells found in the skin called
keratinocytes to proliferate and produce excessive
amounts of keratin. This hyperkeratosis results in
a symmetrical, velvet-like, dark hyperpigmenta-
tion of the skin folds on the neck and under the
arms, in the arm folds and behind knees. The con-
dition is more often diagnosed in people of colour.
Polycystic ovary syndrome (PCOS)
PCOS is a chronic condition that is usually mar-
ked by anovulation, infertility, and hyperandro-
genism. Patients present with irregular menstrual
cycles, oligomenorrhea, or amenorrhea and will
report excessive vaginal bleeding. They are often
obese and have hirsutism. Another early indicator
of PCOS is facial acne that does not respond read-
ily to treatment. In adolescents of colour there is
a high correlation between PCOS and acanthosis
nigricans due to hyperandrogenism.
Hyperglycemia
Children and adolescents with insulin resistance
may not have elevated blood glucose. Although
they produce as much as twice the normal amounts
of insulin, initially this is sufficient to overcome
hyperglycemia related insulin resistance. How-
ever, eventually such individuals will become hy-
perglycemic if they remain obese and insulin re-
sistant. There i s no way, however, to predict when
this occurs, therefore surveillance is necessary.
Dyslipidemia
Insulin resistance is often marked by decreased
HDL cholesterol and elevated triglycerides. This
dyslipidemia has been associated with fatty streaks
and fibrous plaques found in the coronary arteries,
contributing to increased risk for cardiovascular
disease.
Hypertension
The exact cause of hypertension in children with
insulin resistance is unknown. It may be related to
underlying kidney disease, obesity, hyperinsuline-
mia, hyperglycemia, or other, as yet undiscovered
factors. What is known is that detection is im-
portant. Determination of hypertension in children
and adolescents is a function of age, gender, and
height. Generally there are no symptoms at pre-
sentation.
Renal disease
Concern about hypertension in obese children is in
part a reflection of the results of some studies that
indicate a close association between renal disease
and insulin resistance. Since it is uncertain as to
whether kidney disease and hypertension occur
independently it is important to screen for both
entities.
Children and adolescents Master
DecisionPath for insulin resistance
Any child discovered to have any of the conditions
that are correlated with insulin resistance or any of
the risk factors should undergo an annual assess-
ment for the other correlates. This can be carried
out efficiently and systematically by following the
SDM Master DecisionPath for Metabolic Syn-
drome (Figure 5.24). In most cases obesity will
be the first of t he correlates to be noticed. As
mentioned in an earlier section clinical obesity
is defined as exceeding the 95th percentile BMI
METABOLIC SYNDROME IN CHILDREN AND ADOLESCENTS 199
YES
YES
YES
YES
YES
YES
YES
NO
NO
NO
NO
NO
NO
NO
Child or adolescent at risk of
Metabolic Syndrome
Diagnosed overweight
or obesity?
Type 2 diabetes
Suspected or diagnosed
hypertension?
Suspected or diagnosed
renal complication?
Suspected or diagnosed
dyslipidemia?
Polycystic ovary syndrome?
Suspected psychosocial/caregiver
issues (adherence, support)?
Reassess at each visit
Follow Weight Management
for Children and Adolescents
Follow Type 2: Practice
Guidelines for Children and
Adolescents
Follow Hypertension Practice
Guidelines for Children and
Adolescents
FollowMicroalbuminuria
Screening, Detection and
Treatment for Children and
Adolescents
Follow Dyslipidemia Practice
Guidelines for Children and
Adolescents
Follow PCOS Practice
Guidelines for Children and
Adolescents
Follow Psychoeducational
Assessment
Figure 5.24 Children and Adolescents Master De-
cisionPath for Insulin Resistance Syndrome
based on age and gender. It is recommended, how-
ever, that any child above the 85th percentile BMI
be evaluated on an annual basis for the other cor-
relates of insulin resistance. The next step is to
screen for t ype 2 diabetes. This is done by ei-
ther capillary blood glucose or plasma glucose in
a laboratory. The screening test can only serve to
determine who needs further evaluation. To be di-
agnosed with diabetes, two tests on different days
are required. Afterwards the child will fall into
one of three categories: overt diabetes, impaired
glucose homeostasis (pre- diabetes) or normal
glycemia. The definitions are not age dependent
and are the same for adults. Next is measurement
for hypertension. This requires three blood pres-
sure measurements on separate days and meeting
the age, gender, and height criteria. Although in
most cases hypertension (HTN) would signal the
need to evaluate for renal disease, in children sus-
pected of insulin resistance screening for microal-
buminuria should be carried out without regard
to blood pressure. Renal disease can be assessed
initially with a semiquantitative test strip or by
quantitative measure in the laboratory. If positive,
more detailed examination is in order. Finally, in
adolescent females with any suspicion of insulin
resistance determine whether they have a history
of oligomenorrhea, amenorrhea, or signs of hy-
perandrogynism.
SDM provides specific Practice Guidelines and
DecisionPaths for each of the disorders on the
Master DecisionPath. In the following section the
key elements of each path as they refer specif-
ically to children and adolescents are discussed.
Greater detail is provided in the chapters devoted
to metabolic syndrome.
Hypertension
Hypertension Practice Guidelines
As with most co-morbidities associated with in-
sulin resistance, both the detection and the treat-
ment of HTN are modified for children and
adolescents. Hypertension Practice Guidelines for
children and adolescents are shown in Figure 5.25.
Screening and risk factors. All children ≥2
years of age should be evaluated for hypertension
(HTN) at l east annually. If the blood pressure (BP)
meets the criteria for HTN (adjusted for age, gen-
der, and height), then a full diagnostic series of
BPs should be undertaken. Children with risk fac-
tors such as obesity, type 2 diabetes, renal disease,
or dyslipidemia should be screened at each visit.
Generally, HTN in children is without symptoms,
thus risk factor assessment is important.
Diagnosis. The correct BP measurement tech-
nique is essential. The patient should be allowed
to rest at least five minutes in the office and
200 TYPE 2 DIABETES AND METABOLIC SYNDROME IN CHILDREN AND ADOLESCENTS
Screening
Diagnosis
Annual blood pressure measurement children у2 years of age
Average systolic and diastolic у95th percentile for age and gender (see BP Tables) on 3 or
more occasions; use height percentiles rather than chronologic age.
Rule out renal parenchymal disease, coarctation of the aorta or renal artery stenosis, use of
street drugs or ETOH, anabolic steroids, diet drugs, tobacco use/cigarette smoking, oral
contraceptive pills (OCP), use of chronic cold remedies and excess caffeine or sport drink intake.
Consider secondary causes such as: with decreased potassium, consider hyperaldosteronism;
heck TSH to rule out hyper- or hypothyroidism; if positive clinical features consider
screening for Cushing’s with 24 hour UFC; consider pheochromocytoma
Symptoms
Risk Factors
Treatment
Options
Often none; blurred vision, fatigue, palpatations, sleeping difficulties, dysuria, polyuria, chest
pain, abdominal pain, headache, malaise, weight loss, epistaxis, facial palsy
• Overweight BMI Ͼ85th percentile for age and gender (see BMI Tables).
• Waist-to-hip ratio Ͼ1.0
• Positive family history of hypertension, PVD, CVD, stroke, MI, endocrine disease
• Microalbuminuria
• Smoking
• History of urinary tract infection
• Hyperinsulinemia
• Child abuse
• Diabetes, IGT, or IFG
or renal insufficiency or failure
Medical nutrition and activity therapy alone or in combination with pharmacologic agents
(ACE inhibitor, angiotensin II receptor blocker, calcium channel blocker, low-dose diuretic,
b-blocker); caregiver participation; cardiovascular conditioning, weight loss when appropriate;
stress reduction
Targets
Hypertension
Microalbuminaria
Monitoring
BP Ͻ90th percentile for gender, age and height percentile (BP Tables)
у2 yrs of age, adult standards apply (Ͻ30 mg albumin/g)
Self-monitor blood pressure 4 times per day (twice prior to prescribed medication) while in
adjust phase with oscillometric home blood pressure monitor; one time per day during maintain
phase; blood presssure at every office visit
Follow-up
Weekly–Monthly
Every 3 Months
Yearly
(in addition to
3–4 month visit)
With diastolic blood pressure 5 to 9 mmHg above the 95th percentile Q 4–6 weeks; with
diastolic blood pressure у10 mmHg above the 95th percentile, in one week
With marginal elevation, every 3–6 months
History and physical; self-monitored blood pressure profile, screen for albuminuria;
fundoscopic eye exam; dental examination;medical nutrition and cardiovascular conditioning
continuing education; fasting lipid profile, glucose screen, smoking cessation as needed;
consider 24 hour ambulatory blood pressure monitoring
Figure 5.25 Hypertension Practice Guidelines for Children and Adolescents
should be seated at the time of the measurement.
The cuff size should be appropriate and care-
fully placed. Measurement should be made at least
twice with 2–5 minutes between determinations.
If there is any suspicion that the in-office BP may
be compromised by patient anxiety provide the
patient with a means of monitoring BP at home
(SMBP). The accurate assessment of BP is clearly
a necessity if appropriate interventions are to be
instituted.
METABOLIC SYNDROME IN CHILDREN AND ADOLESCENTS 201
%
90th
95th
90th
95th
90th
95th
90th
95th
90th
95th
90th
95th
90th
95th
90th
95th
90th
95th
90th
95th
90th
95th
90th
95th
90th
95th
90th
95th
90th
95th
90th
95th
90th
95th
Age (yr)
1
2
3
4
5
6
7
8
9
10
11
12
13
14
15
16
17
5%
98
101
99
103
100
104
101
105
103
107
104
108
106
110
108
112
110
114
112
116
114
118
116
120
118
122
120
124
121
125
122
126
123
127
10%
98
102
99
103
101
104
102
106
103
107
105
109
107
111
109
113
111
115
113
117
115
119
117
121
119
123
121
125
122
126
123
127
123
127
25%
99
103
101
104
102
106
103
107
105
108
106
110
108
112
110
114
112
116
114
118
116
120
118
122
120
124
122
126
123
127
124
128
124
128
50%
101
104
102
106
103
107
104
108
106
110
107
111
109
113
111
115
113
117
115
119
117
121
119
123
121
125
123
127
124
128
125
129
126
130
75%
102
106
103
107
104
108
106
109
107
111
109
113
110
114
112
116
114
118
116
120
119
122
121
125
123
126
124
128
126
130
127
120
127
121
90%
103
107
104
108
105
109
107
111
108
112
110
114
112
115
114
117
116
119
118
122
120
124
122
126
124
128
125
129
127
131
128
132
128
132
95%
104
108
105
109
106
110
108
111
109
113
111
114
112
116
114
118
116
120
118
122
120
124
123
126
124
128
126
130
128
131
129
132
129
133
5%
52
56
57
61
61
65
64
68
66
71
69
73
71
75
72
76
74
78
75
79
76
81
78
82
79
83
80
84
80
85
81
85
81
85
10%
52
56
57
61
61
65
64
68
67
71
69
73
71
75
72
77
74
78
75
79
77
81
78
82
79
83
80
84
81
85
81
85
81
86
25%
53
57
58
62
61
66
65
69
67
71
69
74
71
75
73
77
74
79
76
80
77
81
78
82
79
84
80
85
81
85
82
86
82
86
50%
53
58
58
62
62
66
65
69
68
72
70
74
72
76
74
78
75
79
77
81
78
82
79
83
80
84
81
85
82
86
82
87
83
87
75%
54
58
59
63
63
67
66
70
69
73
71
75
73
77
74
79
76
80
77
81
79
83
80
84
81
85
82
86
83
87
83
87
83
88
90%
55
59
60
64
64
68
67
71
69
74
72
76
74
78
75
79
77
81
78
82
79
83
81
85
82
86
83
87
83
88
84
88
84
88
95%
55
60
60
64
64
68
67
71
70
74
72
76
74
78
76
80
77
81
78
83
80
84
81
85
82
86
83
87
84
88
84
88
85
89
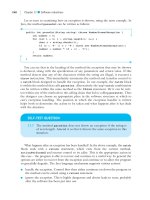
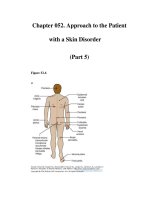
Rosner et. al., Pediatrics 1996; 98: 653–654
Systolic BP (mmHg)
by percentile of height
Diastolic BP (mmHg)
by percentile of height
Girls
Figure 5.26 Female blood pressure level percentile by age and percentile of height
Children and adolescents can be placed in one
of four BP categories: normal, high risk, HTN,
and severe HTN. With the exception of severe
HTN, the criteria for HTN under the age of 18
are based on age and gender adjusted for height
(Figures 5.26 and 5.27). Normal BP is both sys-
tolic and diastolic BP below the 90th percentile.
High risk are either systolic or diastolic by be-
tween the 90th and 95th percentiles; HTN is the
average systolic and diastolic BPs taken on three
separate occasions ≥95th percentile. Severe HTN
(requiring referral to a cardiologist) is dependent
solely on age range. For example, an 8 year old
boy whose height places him in the 50th percentile
would have normal BP if the BP <111/74 mmHg;
he would be at high risk if the systolic BP were
≥111 to 115 mmHg or the diastolic BP were ≥74
to 78 mmHg; if he exceeded an average BP of
116/81 mmHg but not <129/85 mmHg, he would
be HTN. If he exceeds 129/85 mmHg on any
occasion he would be considered to have severe
HTN. Since there may be underlying (or contem-
poraneous) causes other than insulin resistance a
202 TYPE 2 DIABETES AND METABOLIC SYNDROME IN CHILDREN AND ADOLESCENTS
%
90th
95th
90th
95th
90th
95th
90th
95th
90th
95th
90th
95th
90th
95th
90th
95th
90th
95th
90th
95th
90th
95th
90th
95th
90th
95th
90th
95th
90th
95th
90th
95th
90th
95th
Age (yr)
1
2
3
4
5
6
7
8
9
10
11
12
13
14
15
16
17
5%
94
98
98
102
101
105
103
107
104
108
105
109
106
110
108
112
109
113
111
115
113
117
115
119
118
121
120
124
123
127
126
130
128
132
10%
95
99
99
103
102
106
104
108
105
109
106
110
107
111
109
113
110
114
112
116
114
118
116
120
119
122
121
125
124
128
127
131
129
133
25%
97
101
101
105
103
107
105
109
107
111
108
112
109
113
110
114
112
116
113
117
115
119
118
122
120
124
123
127
126
130
129
133
131
135
50%
99
103
103
107
105
109
107
111
109
113
110
114
111
115
112
116
114
118
115
119
117
121
120
124
122
126
125
129
128
132
131
134
133
137
75%
101
105
104
108
107
111
109
113
111
114
112
116
113
117
114
118
116
119
117
121
119
123
121
125
124
128
127
131
130
133
132
136
135
139
90%
102
106
106
110
109
112
110
114
112
116
113
117
114
118
116
119
117
121
119
123
121
125
123
127
125
129
128
132
131
135
134
138
136
140
95%
103
107
107
110
109
113
111
115
113
117
114
118
115
119
116
120
118
122
119
123
121
125
124
128
126
130
129
133
132
136
134
138
137
141
5%
49
54
54
58
59
63
63
67
66
71
70
74
72
77
74
79
76
80
77
81
77
82
78
83
78
83
79
83
80
84
81
86
83
88
10%
49
54
54
59
59
63
63
68
67
71
70
75
73
77
75
79
76
81
77
82
78
82
78
83
79
83
79
84
80
85
82
86
84
88
25%
50
55
55
60
60
64
64
68
68
72
71
75
73
78
75
80
77
81
78
83
79
83
79
84
80
84
80
85
81
86
82
87
85
89
50%
51
56
56
61
61
65
65
69
69
73
72
76
74
79
76
81
78
82
79
83
80
84
80
85
81
85
81
86
82
86
83
88
86
90
75%
52
57
57
62
62
66
66
70
69
74
73
77
75
80
77
82
79
83
80
84
81
85
81
86
81
86
82
87
83
87
84
89
87
91
90%
53
58
58
63
63
67
67
71
70
75
74
78
76
81
78
83
80
84
81
85
81
86
82
87
82
87
83
87
84
88
85
90
87
92
95%
54
58
58
63
63
68
67
72
71
76
74
79
77
81
79
83
80
85
81
86
82
87
83
87
83
88
83
88
84
89
86
90
88
93
Rosner et. al., Pediatrics 1996; 98: 653–654
Systolic BP (mmHg)
by percentile of height
Diastolic BP (mmHg)
by percentile of height
Boys
Figure 5.27 Male blood pressure level percentile by age and percentile of height
thorough evaluation is needed (generally by a car-
diologist).
Treatment options. Treatment for H TN in
children is similar to t hat in adults. The use of
medical nutrition therapy (MNT) to manage HTN
is the cornerstone of treatment. Weight manage-
ment, reduction in sodium intake, and increased
physical activity are crucial elements. Replacing,
reducing and restricting foods and drinks high in
sodium, carbohydrate, and/or fats is a fundamen-
tal strategy. MNT is the same as would be used
in diabetes and dyslipidemia. Generally MNT as
a solo therapy is reserved for children in the at
risk category. For children meeting the criteria
for HTN, pharmacological therapy plus MNT is
recommended (Figure 5.28). ACE inhibitors are
the preferred therapy as they provide a renal pro-
tective benefit. However, angiotensin II receptor
blockers, calcium channel blockers, low-dose di-
uretics, and β-blockers are acceptable. Physical
activity should be part of therapy after completing
a fitness evaluation.
Targets. Intensive management to pre-set and
agreed upon targets (treat-to-target) is a hallmark
METABOLIC SYNDROME IN CHILDREN AND ADOLESCENTS 203
Child or adolescent with
hypertension
History, physical exam, and laboratory
evaluation by provider; rule out
secondary causes of hypertension
Persistent microalbuminuria?
(Ͼ30 mg/g on 3 or more occasions)
See Microalbuminuria Screening,
Detection and Treatment
YES
Start ACE Inhibitor or Angiotensin II Receptor
Blocker
Captopril, enalapril, or ramipril because of renal
protective effects unless baseline hyperkalemia;
impaired renal function, especially bilateral renal
artery stenosis; drug interactions; previous drug
reactions; specific indication for another agent;
likelihood of short-term follow-up is low;
pregnancy and lactation
Starting dose (see Antihypertensive Therapy
Choices)
If ACE inhibitor or angiotensin II receptor
blocker contraindicated, select from a different
class of antihypertensive (see
Antihypertensive Therapy Choices)
If currently on diuretic therapy, reduce dose or
stop for 3 days prior to initiating ACE inhibitor
Monitor blood pressure with oscillometric home
blood pressure monitor
Ace inhibitors: repeat potassium and creatinine
in one week. Re-evaluage therapy if increased
potassium (Ͼ5.7 mEq/L) or serum creatinine
(0.4–0.5 mg/dL), persistent dry cough,
hypotension, rash, leukopenia
See Medical Nutrition Therapy/Assessment
Move to Hypertension Drug Therapy/Adjust
Start Anti Hypertensive
Therapy:
The list of drugs below is the
recommended order in which
the therapies should be selected.
With diabetes:
ACE inhibitor/ARBs
Calcium channel blocker
Beta blocker (Assess for hypo-
glycemia)
Diuretics
Vasodilators
Without diabetes:
Dihydroperidone
ACE inhibitor/ARBs
Beta blocker
Diuretics
Vasodilators
Educate patient and care-
givers:
Hypertension is a chronic
disease
Importance of taking
medications as prescribed
May feel tired initially
Do not stop medication
without consulting provider
Medication side effects
Refer to registered dietitian
If no contraindication (renal,
cardiac) refer to activity
therapy
•
•
•
•
•
•
•
NO
•
•
•
•
•
•
Figure 5.28 Hypertension Drug Therapy Start/
Treatment for Children and Adolescents
of the SDM approach. For children with insulin
resistance it is vital that BP be returned to below
the 90th percentile (or less than 130/80 mmHg
in children over 11 years of age). This has been
shown to reduce the risk of renal disease or slow
its progression in cases where it already exists.
14
Because of the close association between these
disorders screening for microalbuminuria and, if
negative, yearly surveillance is recommended.
Monitoring. Although in-office measurement
of BP has been considered the basis for most
decisions related to diagnosis and treatment, re-
cent evidence suggests that a far more accurate
and reliable method is home or self-monitoring
BP (SMBP). Because this method provides vital
information related to hourly and daily excursions
in BP and more closely resembles BP under nor-
mal conditions, it is recommended as part of SDM
monitoring for children in the high-risk, HTN,
and severe HTN categories. The use of oscillo-
metric monitors should begin with an in-office
demonstration and evaluation of technique against
in-office BP determinations by sphygmomanome-
ter or office-based oscillometric device. Once it
is clear that the patient or caregiver can operate
the device, a testing schedule of 4/day at varying
times should be i nitiated. As many of the devices
have an onboard memory, the patient need not
keep records. The data can be offloaded in the of-
fice. If this is not available then patients can use
a logbook to record their values. Generally, the
accumulated data are averaged and the same BP
criteria as mentioned above are used. For a com-
plete discussion of how to interpret BP data from
self-monitoring devices see Chapter 9 on HTN.
Follow-up. During the initial treatment phase,
patients should have 24-hour telephone access
and should be seen at least monthly. In the
more severe cases, weekly contact and review
of self-monitored BPs will assure timely inter-
ventions should the current therapy be inade-
quate. Quarterly visits and annual reassessment
for co-morbidities of insulin resistance are recom-
mended. Special attention to w eight, blood glu-
cose, HDL cholesterol, triglycerides, and protein-
uria is essential.
Hypertension Drug Therapy/Start Treatment
Most antihypertensive drugs have had limited
testing in children and adolescents, thus care-
ful surveillance for contraindications is neces-
sary. Following the history and physical examina-
tion make the selection of pharmacological agent
based on whether the child has diabetes and/or
underlying renal disease. If the child was not
evaluated for all disorders associated with insulin
resistance, first complete the steps in the Mas-
ter DecisionPath for Insulin Resistance. Before
selecting the therapy also make certain that the pa-
tient and family understand the significance of the
204 TYPE 2 DIABETES AND METABOLIC SYNDROME IN CHILDREN AND ADOLESCENTS
clinical findings, the goal of treatment and the im-
portance of the antihypertensive drug and SMBP.
It is imperative that all of those involved in the
child’s care agree on the target BP, how it is to
be measured and how long it will take to reach.
As best as possible, determine the role of each
family member and the patient related to admin-
istering the antihypertensive agent and measuring
BP. Finally, it should be made very clear that
some antihypertensive drugs may fail to achieve
the agreed upon goal; under such circumstances,
the family should be informed that there are many
alternative drugs.
For children >2 years of age and non-pregnant
adolescents with diabetes and/or renal disease, the
first drug of choice is an ACE inhibitor; for those
>13 years of age either an ACE (non-pregnant
only) or ARB may be initiated (Figure 5.28).
Both antihypertensive agents have renal protec-
tive f unctions as well as BP lowering ability. For
individuals without diabetes or renal disease di-
hyroperiodones are recommended. For all drugs
generally begin at the lowest dose based on body
weight.
Independent of the medication, all patients and
their caregivers should be taught about HTN, the
importance of the medication, the role of medical
nutrition therapy, and the contraindications or side
effects. Within one week of initiation of and ACE-
I repeat both potassium and creatinine measures.
Check for any indication of persistent cough,
hypotension, rash, or leukopenia. If these occur
consider switching to an ARB.
As soon as feasible, MNT should be initiated
following the weight management protocols pro-
vided by SDM. The focus of MNT is to optimize
the effectiveness of the pharmacological inter-
vention by reducing foods high in salt, lowering
the carbohydrate load, and preventing unneces-
sary weight gain or, in obese children, promoting
weight control.
Finally, SMBP should be encouraged. The vari-
ability in BP throughout the day and from day to
day is a major factor associated with underlying
cardiovascular disease. Little is known about the
patterns of BP in children and adolescents. How-
ever, it has been well established that SMBP i s
a reliable and accurate indicator of BP control.
Some studies have demonstrated that it is more
reliable and accurate than in-office measurements,
correlating very well with ambulatory 24-hour
monitoring. The optimal schedule for SMBP is
four tests daily at varying times over a period
of one month. This provides adequate data to
determine whether the therapy is successful and
whether there are any BP patterns that require at-
tention. As with in-office measurements, the goal
is to maintain the patient below the 95th percentile
for both systolic and diastolic BP.
Hypertension Drug Therapy/Adjust
The principal strategy by which SDM operates
is to set a mutual goal with the patient and
family within a set timeframe. Initially, the goal
is to achieve consistent BPs ≤90th percentile (as
measured by SMBP) within 4 weeks and sustain
this over a period of 6 months (Figure 5.29). If
this is accomplished and corroborated by four in-
office BP measurements over the 6 months, t he
patient enters the Maintain Phase of treatment.
The antihypertensive drug therapy can now be re-
examined and slowly withdrawn. SMBP should be
used to confirm that as the medication is reduced
BP values remain within target. The justification
for regular visits during this period is to make
certain that microalbumin levels remain within
the normal range. If they do not, then ACE-I
therapy should continue (see Microalbuminuria
Screening, Detection and Treatment for Children
and Adolescents).
If BP levels do not achieve the initial target,
then consider whether the key factor is adherence
to the regimen. In many cases the initial emotional
stress from the diagnosis may result in both patient
and family dysfunction. This, in turn, may lead to
a lack of adherence to taking medications and to
monitoring BP. Often the root cause is a lack of
understanding about the disease process, the goals
of treatment, and the effect of non-adherence (see
Adherence DecisionPath). The first step is to as-
sess whether the patient and family still agree with
the goals that were mutually established at the first
visit. Often, after a period of time to reflect on the
changes in lifestyle required by treatment and to
METABOLIC SYNDROME IN CHILDREN AND ADOLESCENTS 205
Child or adolescent treated with
antihypertensive therapy
BP р95th percentile for
gender, age, height percentile?
Investigate adherence issues
and assess psychological and
social well being
Patient on clinically
effective dose?
YES
Patient on maximum dose?
YES
Patient remains in Hypertension
Drug Therapy/Adjust
Add second drug from different
class; consider diuretic as adjunct
therapy if edema; continue to
home monitor BP; use this
DecisionPath for follow-up
YES
Patient in Hypertension Drug
Therapy/Maintain
Use this DecisionPath for follow-up
Follow-up
Medical: with marginal elevation
every 3 months; continue to home
monitor BP as indicated
Step Down
If BP has been controlled for Ͼ6 months
and at least 4 visits, antihypertensive
drug therapy may be decreased in a
slow, progressive manner; most success-
ful in patients who also are following
lifestyle modifications; albuminuria may
dictate continued use of ACE inhibitor
or angiotensin II receptor blocker
Patient remains in Hypertension
Drug Therapy/Adjust
Adjust current drug to maximum
clinical effectiveness; consider adding
a second drug from different class;
use this DecisionPath for follow-up
Follow-up
Medical: with marginal elevation,
every 2–6 weeks; continue to home
monitor as indicated
Patient remains in Hypertension
Drug Therapy/Adjust
Increase dose without exceeding max-
imum recommeded for children and
adolescents; use this DecisionPath for
follow-up
Follow-up
Medical: within 2–6 weeks; continue
to home monitor BP as indicated
NO
NO
Figure 5.29 Hypertension drug therapy Ad-
just/Treatment for Children and Adolescents
understand each family member’s responsibilities,
the stresses related to the diagnosis reflect them-
selves in a lack of adherence to the drug and test-
ing regimens. If this occurs consider re-setting the
goals. This requires reducing the number of goals.
Thus, the initial goal may be limited to taking the
ACE-I according to the prescribed schedule with-
out SMBP and MNT. Once this is achieved, then
MNT may be initiated. Finally, the SMBP goals
may be re-instituted.
If adherence is not the principal issue and if the
maximum dose has not been reached, the choice
is to continue to increase the current medication
until the maximum dose is reached or to maintain
the current dose and add a different classification
of antihypertensive agent. In most instances, a cal-
cium channel blocker would be the next drug to
add. Although β-blockers and diuretics are effec-
tive, they present some problems for individuals
with or at risk for diabetes that make them less
optimal. β-blockers interfere with feedback dur-
ing hypoglycemic events (only likely in children
or adolescents treated with insulin) and diuretics
have been associated with increased blood glucose
levels. Thus, in this population, β-blockers and
diuretics should be considered after other drugs
have failed. Each adjustment should be given at
least 2 weeks, but no more than 6 weeks, before
it is re-evaluated. Most drugs allow for four to six
dose adjustments, thus it may take as long as half
a year to reach the maximum dose. If a second
drug is initiated, this may add another half year.
Since the children are growing at the same time
be certain to recalculate the dose based on weight
changes.
If a number of the drugs have been tried, if
MNT has not successfully managed weight, or
if the family remains dysfunctional r elated to
treatment, consider referral to a multi-disciplinary
care team. The management of HTN as part of
the overall metabolic syndrome is very complex
and may require the expertise of specialists, nurse
educators, dietitians, and psychologists to address
each of the underlying issues.
Nephropathy
Nephropathy practice guidelines
Practice guidelines for nephropathy are shown in
Figure 5.30.
Screening, risk factors, and diagnosis. Too
often the development of renal disease in chil-
dren and adolescents is related to other condi-
tions that give rise to their discovery. The pres-
ence of either diabetes or hypertension is often a
signal to screen for microalbuminuria. Nonethe-
less, often these disorders proceed renal disease.
Thus, all children with insulin resistance should
be screened annually. There are however, in addi-
tion to diabetes and hypertension, less apparent
risk factors that increase the chance that renal
disease is present. They are principally related
206 TYPE 2 DIABETES AND METABOLIC SYNDROME IN CHILDREN AND ADOLESCENTS
Office visit during adjust phase (weekly phone contact may be necessary)
Urinalysis with dipstick test for proteinuria; determine HbA
1c
Serum creatinine and blood urea nitrogen (BUN) annually in patients with
albuminuria; if macroalbuminuria present, consider consult with pediatric
endocrinologist, diabetologist, of nephrologist
Screening
See Microalbuminuria Screening, Detection and Treatment Guidelines
Diagnosis
Incipient
Nephropathy
Overt
Nephropathy
Hypertension
Glomerular
Disease
Persistent microalbuminuria (on 2 out of 3 occasions)
Random urine collection 30–300 mg albumin/g creatinine
Macroalbuminuria (proteinuria indicated by a positive dipstick test)
Random urine collection Ͼ300 mg albumin/g creatinine
Note: albumin/creatinine ratio not sensitive when urine protein Ͼ2–3 g/24 hours
Average systolic and diastolic Ͼ95th percentile for age, gender, and height
percentile
Evidence includes mesengial cell matrix expansion, increased basement membrane
thickness, and loss of glomerular capillary surface area
Risk Factors
•
•
•
•
•
•
HbA
1c
Ͼ2 percentage points
above upper limit of normal
Sibling with nephropathy
Smoking
Duration of diabetes Ͼ5 years
Family history of hypertension
and/or dyslipidemia
American Indian or Alaska Native;
African-American; Asian; Native Hawaiian
or other Pacific Islander; Hispanic
Treatment
Options
Hypertension
Dyslipidemia
If hyperglycemia, intensify metabolic control
Medical nutrition and activity therapy; ACE inhibitors; angiotensin II receptor
blockers; calcium channel blockers; low-dose diuretics; b -blockers
Medical nutrition and activity therapy; bile acid sequestrants (for other
medication therapies refer to a pediatric specialist)
Targets
Near euglycemia; BP Ͻ95th percentile for age, gender, and height percentile;
glomerular filtration rate (GFR) decrease Ͻ0.2 mL/minute/month acceptable
Monitoring
Self-monitoring of blood pressure (SMBP) and SMBG daily while adjusting treatment
Follow-up
Monthly
Every 3 Months
Yearly
Figure 5.30 Nephropathy Practice Guidelines for Children and Adolescents
to the genetic predisposition in some minority
groups to insulin resistance, notably American In-
dian, African-American, and Hispanic. Diagnosis
is confirmed by repeated albumin/creatinine (A/C)
ratio after ruling out possible transient and benign
causes. Incipient nephropathy is defined by an
A/C ratio of 30–300 mg/g, while overt nephropa-
thy (macroalbuminuria) is >300 mg/g.
Treatments and targets. The treatment of
nephropathy in the presence of diabetes and hy-
pertension coordinates medical nutrition therapy
and anti-hyperglycemia and anti-hypertensive reg-
imens to assure optimization of each approach and
to reduce redundancies. Thus, generally therapy
begins with an ACE-I and intensive control of
blood glucose most likely using insulin. In the
absence of HTN and diabetes, an ACE-I is still
used along with some alteration in diet either for
obesity or protein.
Monitoring and follow-up. For children with
diabetes, close surveillance using SMBG is funda-
mental to long-term management. When the dis-
ease is complicated by HTN close monitoring by
METABOLIC SYNDROME IN CHILDREN AND ADOLESCENTS 207
SMBP is also necessary. In all situations, annual
dipstick urinalysis and serum creatinine should be
measured. As with all children and adolescents
with insulin resistance an annual evaluation for
all co-morbidities should be undertaken.
Microalbuminuria screening, detection and
treatment
In children and adolescents with insulin resis-
tance, renal disease may occur prior to the earliest
sign of hyperglycemia (see Figure 5.31). Further-
more, BP measurements may not be sufficiently
accurate to signal possible underlying kidney in-
volvement. Thus, it is imperative that screening
for microalbuminuria (by either semiquantitative
or quantitative methods) be undertaken annually
in asymptomatic persons. If the screening is
Child with metabolic syndrome
or type 2 diabetes; do annual routine screening
in office with semiquantitative test strip or
quantitative (lab) test
If dipstick positive, do quantitative test using
the following method
A/C ratio
(preferably first morning
specimen)*
Microalbuminuria?
Transient?
Due to fever, stress
dehydration, exercise?
Repeat A/C ratio within
one month
Persistent?
Ͼ30 mg albumin/g on 2 of
3 occasions. Obtain complete
urinalysis and A/C ratio, if
not already obtained
Obtain serum albumin,
creatinine, electrolytes and
fasting lipid profile
Start ACE inhibitor
Normal: Ͻ30 mg/g
albumin/g creatinine
Microalbuminuria: 30–300
mg/g albumin/g creatinine
Macroalbuminuria: Ͼ300
mg albumin/g creatinine
Repeat screen in one year
Repeat random A/C ratio when
asymptomatic and/or decreased
exercise
In children у Tanner Stage II:
Obtain first morning spot A/C
ratio and repeat spot A/C ratio in
afternoon.
If total protein 2 or more times
greater in the afternoon, diagno-
sis of orthostatic proteinuria.
Orthostatic proteinuria is a
benign condition with no recom-
mended treatment.
Consider: renal ultrasound,
serum C3/C4 complement,
antinuclear antibody, hepatitis
B, C and HIV serologies if
indicated, cardiac ultrasound. If
positive, refer to pediatric
endocrinologist
*Urine specific gravity should be у1.020
YES
NO
YES
NO
YES
Figure 5.31 Microalbuminuria Screening, Detec-
tion and Treatment in Children and Adolescents
positive, an A/C ratio should be performed on
a first morning urine specimen. Children are
subject to the same criteria as adults for albu-
min/creatinine: normal (<30 mg/g), microalbu-
minuria (30–300 mg/g), and macroalbuminuria
(>300 mg/g). The finding of microalbuminuria re-
quires ruling out such causes as physical activity,
stress, dehydration, or fever. Thus, repeat the A/C
ratio within one month of resolving these possible
causes. Otherwise, repeat the A/C ratio within a
month of the original measurement.
In children ≥ Tanner Stage 2 the explanation
for a positive A/C ratio may be a benign condition
called orthostatic proteinuria, which is determined
by comparing the first morning urine sample with
an afternoon sample. If the afternoon total pro-
tein is more than twice the morning value then
the diagnosis is confirmed and no treatment is re-
quired. Referral to a pediatric nephrologist should
be considered to verify the diagnosis.
If orthostatic proteinuria has been ruled out,
obtain serum creatinine, electrolytes, and a fast-
ing lipid profile. An ACE-I should be initiated
immediately along with SMBP. Because this con-
dition is serious in children with insulin resistance,
it is further recommended that r enal ultrasound,
serum C3/C4 complement, and cardiac ultrasound
be considered. Referral to a pediatric endocri-
nologist, nephrologist, or cardiologist is also ad-
vised.
Ongoing treatment for microalbuminuria de-
pends a great deal as to whether HTN and/or
diabetes (or any hyperglycemia) is present. With
regards to diabetes, the fundamental treatment is
to aim for euglycemia without any significant
BG excursions. Mean BG as well as significant
variations from the mean are closely associated
with progression of renal disease. If type 2 di-
abetes is present then follow the children and
adolescent DecisionPaths. Since intensive treat-
ment of type 2 diabetes (HbA
1c
<7 per cent)
is required, and because metformin is contraindi-
cated when there is renal disease, initiating in-
sulin therapy should be considered. Modifications
in MNT for diabetes may also be necessary as
diets low in protein have been shown to have
208 TYPE 2 DIABETES AND METABOLIC SYNDROME IN CHILDREN AND ADOLESCENTS
renoprotective effects and to slow the progres-
sion of overt diabetic nephropathy (macroalbu-
minuria). Although no conclusive evidence has
shown that low-protein diets slow the progression
from incipient diabetic nephropathy to overt dia-
betic nephropathy, it is hypothesized that excess
protein in the diet causes glomerular hyperfiltra-
tion, renal vasodilatation, and changes in intra-
glomerular pressure, all of which are associated
with proteinuria. Reduction in the proportion of
total daily calories comprised of protein to 15 per
cent initially, and to 10 per cent if overt diabetic
nephropathy is present, is recommended. Where
possible, vegetable based protein should be used
in place of animal protein.
With respect to BP management, once again
intensive management is necessary. The target
should be set for between the 30th and 60th
percentile BPs based on age, gender and height.
SMBP should be used. If significant excursions of
more than 10 mmHg appear in systolic or diastolic
BP on three consecutive days at the same hour,
or at different hours on the same day, consider
altering the timing of the agent by splitting the
dose or adding a second anti-hypertensive agent
from another classification. Consider consultation
with a pediatric nephrologist or cardiologist as
needed for more complex cases.
Dyslipidemia
Dyslipidemia Practice Guidelines
Dyslipidemia is a common co-morbidity of insulin
resistance and is most often found in those chil-
dren and adolescents with obesity, diabetes, and
HTN. There are, in general, no overt signs of dys-
lipidemia that would be readily recognized by the
patient or caregiver. Additionally, total cholesterol
is often normal. Because of this, it is important to
maintain a program of careful evaluation by lipid
profiles of those individuals at high risk. SDM
has established practice guidelines for t he detec-
tion and treatment of dyslipidemia in children and
adolescents (Figure 5.32).
Screening, risk factors, and diagnosis of
dyslipidemia.
Screening is generally limited to
children greater than 2 years of age with at least
two risk factors associated with coronary artery
disease. Along with the co-morbidities of insulin
resistance the principal risk factor is genetic. If
the family history is positive for CAD and the
child is insulin resistant then he/she should be
evaluated. Because the type of dyslipidemia often
found in these children is characterized by nor-
mal cholesterol, low HDL, and high triglycerides,
SDM recommends using the screening as the ba-
sis for diagnosis by using a fasting fractionated
lipid profile. The diagnostic criteria are based on
the A merican Diabetes Association recommenda-
tions for management of dyslipidemia in children
and adolescents with diabetes:
15
• LDL-cholesterol ≥100 mg/dL (2.6 mmol/L)
• HDL-cholesterol ≤35 mg/dL (0.9 mmol/L)
• triglyceride level ≥150 mg/dL (1.7 mmol/L)
Since any abnormal value is diagnostic and
since LDL or triglyceride levels may be abnormal
even when the total cholesterol level is normal a
fasting fractionated lipid profile for diagnosis is
recommended. The National Cholesterol Educa-
tion Program has recognized that very low lev-
els of HDL increase the risk of vascular disease.
Therefore, low HDL is also a lipid abnormality.
Treatment options and targets. The current
therapies are based on severity of the dyslipi-
demia, presence of diabetes, and/or HTN and are
age dependent. In the presence of diabetes or
HTN control of BG and BP is essential. Generally
treatment for dyslipidemia begins with medical
nutrition therapy aimed at weight reduction by al-
teration of the proportion of fats in the diet. If this
fails or if LDL >160 mg/dL (4.1 mmol/L) then
bile acid sequestrants (cholestyramine, colestipol,
colesevelam) are recommended. For initiation of
other lipid lowering agents such as statins or eze-
timibe, it is recommended that the patient be re-
ferred to a pediatric specialist. The goal is to r each
the ‘normal range for children’ within one year of
initiation of therapy.
METABOLIC SYNDROME IN CHILDREN AND ADOLESCENTS 209
Screening
Risk Factors
Diagnosis
Symptoms
Treatment
Options
Targets
Monitoring
Follow-up
Monthly
Every 3 Months
Yearly
(in addition to
3–4 month visit)
Screen for dyslipidemia with a fasting lipid profile for all children starting at age 2 annually
who have 2 or more risk factors for CAD
•
•
•
•
•
•
•
•
•
•
•
Overweight BMI Ͼ85th percentile for age and gender (see BMI Tables )
Waist-to-hip ratio Ͼ1.0
Hypertension
Elevated mean LDL concentration
Increased saturated fats/cholesterol in diet
Nephrotic syndrome
Elevated glucose
Use of anticonvulsant medication
Smoking
Positive family history of CAD with symptom onset р55 years of age; MI, angina pectoris,
PVD, cerebrovascular disease, sudden cardiac death, type 2 diabetes or metabolic
syndrome
Unobtainable family history or parents with unknown cholesterol levels
LDL у100 mg/dL (2.6 mmol/L), Triglycerides у150 mg/dL (1.7 mmol/L),
HDL р35 mg/dL (0.9 mmol/L)
Often none, corneal arcus, skin xanthomata
•
•
•
•
Achieve blood glucose control first in patients with diabetes
Ages 2–10 years: with BMI Ͼ85th percentile for gender and age
Age Ͼ10 years; with BMI Ͼ85th percentile for gender and age: weight management and
medical nutrition therapy and pharmacologic agents after 6 months–1 year trial of
diet alone
With LDL Ͼ160 mg/dL (4.1 mmol/L) start bile acid sequestrants (if considering statins,
refer to pediatric diabetes specialist)
LDL Ͻ100 mg/dL (2.6 mmol/L), Triglycerides Ͻ150 mg/dL (1.7 mmol/L),
HDL Ͼ35 mg/dL (0.9 mmol/L)
Medical nutrition and activity therapy alone: appropriate growth for age, fasting lipid
profile every 3 months
Pharmacologic agents: baseline liver function tests, CPK, family planning/contraception for
sexually active females due to unknown use in pregnancy; if pregnancy is planned р18 years
of age discontinue therapy
Phone or office contact until lipid targets met
Fasting lipid profile until targets reached, then at provider discretion
History and physical; screen for albuminuria; dental examination; medical nutrition and
activity therapy continuing education; fasting lipid profile; glucose screening;
preconception planning for females of childbearing age as indicated
Figure 5.32 Dyslipidemia Practice Guidelines for Children and Adolescents
Monitoring and follow-up. Fundamentally,
close surveillance of adherence to the medical
nutrition and pharmacological therapies requires
evaluation of BG, BP, and weight in children and
adolescents with co-morbidities. At 3 month inter-
vals a lipid profile is recommended. For children
without HTN and/or diabetes, annual reassess-
ment is necessary. Since most drugs for dyslipi-
demia are contraindicated in pregnancy, make cer-
tain that sexually active adolescent females are
using birth control.
Dyslipidemia/Diagnosis and Start Treatment
The discovery of lipid abnormalities in children
and adolescents with insulin resistance, frank type
2 diabetes, or HTN is generally characterized by
elevated triglyceride level, l ow HDL, and normal
to moderately elevated LDL-cholesterol. The tar-
gets for treatment of children and adolescents with
diabetes and/or the metabolic syndrome are:
• LDL-cholesterol <100 mg/dL (2.6 mmol/L)