Diagnosis and Management of Pituitary Disorders - part 5 docx
Bạn đang xem bản rút gọn của tài liệu. Xem và tải ngay bản đầy đủ của tài liệu tại đây (833.8 KB, 47 trang )
Chapter 12 / Intensive Insulin Therapy in T2DM 185
insulin without significant hypoglycemia but at the expense of progressive weight gain (7). All these studies
clearly demonstrate the efficacy of various insulin regimens and the adverse consequences of such therapy.
PREMIXED INSULIN REGIMENS
Combinations of rapid-acting insulin analogs and intermediate acting insulins are manufactured as premixed
insulin formulations. Premixed regimens are not appropriate for patients with type 1 diabetes and for most thin,
insulin sensitive patients with T2DM; however, they can be effective for obese insulin resistant patients with
T2DM. One such insulin preparation is Humalog Mix 75/25, which is a fixed-ratio mixture of 25% rapid-acting
insulin lispro and 75% novel protamine-based intermediate-acting insulin called neutral protamine lispro (NPL).
NPL was developed to solve the problem of instability with prolonged storage that occurs with NPH combined
with short acting insulin. Studies of the pharmacokinetic and pharmacodynamic profiles of NPL show they are
comparable to those of NPH insulin (8).
Humalog Mix 75/25 was compared to premixed human insulin 70/30 in patients with T2DM in a 6-mo
randomized, open-label, 2-period crossover study (9). Twice-daily injections of Humalog Mix 75/25 resulted
in improved postprandial glycemic control after the morning and evening meals, reduced rate of nocturnal
hypoglycemia, similar overall glycemic control, and the added convenience of administration immediately before
meals. Humalog Mix 50/50 is also now available for those patients whose post prandial glucose values are not
adequate on the 75/25 and 70/30 combinations.
Insulin aspart, another rapid-acting insulin analog, is available in a premixed formulation with a protamine-
retarded insulin aspart called Novolog Mix 70/30 (70% insulin aspart protamine suspension and 30% insulin
aspart). A comparison study (10) of the pharmacokinetic and pharmacodynamic parameters of the Novolog Mix
70/30 and human insulin 70/30 in healthy patients showed that the faster onset and greater peak action of insulin
aspart was preserved in the aspart mixture.
Another study (11) compared premixed aspart mixture 70/30 with premixed human insulin 70/30 administered
twice daily in a randomized 12-wk open-label trial in 294 patients with type 1 or T2DM. Treatment with twice-
daily premixed aspart mixture 70/30 resulted in similar overall glycemic control; yet postprandial control improved
without additional hypoglycemia and with injections immediately before meals compared with premixed human
insulin 70/30 given 30 min before the meal.
PREMIXED INSULIN TWICE DAILY INJECTIONS VERSUS BASAL INSULIN ALONE
Premixed insulins have been compared to regimens consisting of basal insulins alone in several clinical trials
(12–16). The titration scheme that may have relevance to clinical practice used in the study is shown in (Table 2).
To begin therapy, 12 U Novolog Mix 70/30 were given to insulin-naïve patients. For insulin-users, those on < 30 U
Table 2
Titration algorithm for Novolog Mix 70/30 used up to 3 times a day (17)
Blood glucose measure Blood glucose measure
Predinner (for OD and BID Novolog Mix 70/30) Prelunch (for TID Novolog Mix 70/30)*
Prebreakfast (for BID Novolog Mix 70/30)
mg/dL mmol/L Insulin dose mg/dL mmol/L Insulin dose
adjustment (U) adjustment (U)
<80 <4.4 −3 n/a n/a n/a
80–110 4.4–6.1 0 <100 4.4–6.1 –3
111–140 6.2–7.8 +3 100–140 6.2–7.8 0
141–180 7.83–10 +6 141–180 7.83–10 +3
>180 >10 +9 >180 >10 +6
*People using Novolog Mix 70/30 TID could also adjust breakfast and dinner doses, but it was not recommended that more than 1 dose
be adjusted at a time.
186 Edelman
were transferred to the identical unit dose of Novolog Mix 70/30; for those on 31–60 U, the Novolog Mix 70/30
dose was started at 70% of the previous insulin dose. The dose was titrated based on average plasma glucose
values from 3 previous days. In two separate studies, both Novolog Mix70/30 or Humalog Mix 75/25 given twice
daily in conjunction with metformin, allowed more patients to reach target glucose control, than glargine of basal
insulin administered once-daily with metformin (12,13).
More recently, a treat-to-target trial in 100 patients poorly controlled with oral agents with or without insulin
utilized the stepwise addition of premixed insulin until glycemic targets were attained (14). Using only 1 injection
of Novolog Mix 70/30 daily, a total of 41% of patients were able to reach the ADA target of HbA1c < 7.0%
and 21% reached the AACE/IDF target of ≤6.5%. This increased to 70% and 52% of subjects when twice-daily
injections were used (among those not achieving HbA
1c
≤6.5% with once-daily therapy), and 77% and 60% when
the small number of patients requiring 3 times daily administration was accounted for. This was accomplished
without increasing the frequency of major or minor hypoglycemic episodes over that reported for once- or
twice-daily use.
In a different 24-wk study, 364 insulin-naïve patients with a baseline A1c of 8.84% on both a sulfonylurea
and metformin were either continued on oral agents, and given glargine once daily, or given human premixed
insulin twice daily (before breakfast and dinner) with discontinuation of oral agents (15). After 6 mo, the glargine
plus oral agents group had a significantly greater reduction in A1c (−1.64%) compared to the human premixed
insulin alone without oral agents twice daily group (−1.30%), p < 0.0005. In addition the glargine group used
less insulin, had fewer documented hypoglycemic reactions and less weight gain.
As demonstrated in three studies, the comparison of basal insulin vs. premixed can result in very different
outcomes and conclusions depending on protocol design. When oral agents are continued, glargine at bedtime
did better in terms of glycemic control than premix twice a day without oral agents. The ultimate results of these
comparison studies depend on the patient characteristics, use of analog mixtures, continuation of oral agents, and
number of injections per day.
BASAL BOLUS INSULIN REGIMENS
Basal–bolus insulin strategies, which can be used in patients with either T1DM or T2DM incorporates the
concept of providing continuous basal insulin levels in addition to brief increases in insulin at the time of meals
via bolus doses (16).
The goals of therapy should be tailored to each patient individually. Candidates for intensive management
should be motivated, compliant, educable, and be without other medical conditions or physical limitations that
preclude accurate and reliable home glucose monitoring (HGM), continuous glucose monitoring (CGM), or insulin
administration. Caution is advised in elderly patients or those with hypoglycemic unawareness in whom the goals
of therapy may need to be relaxed. High titers of insulin antibodies, especially in patients with a history of
intermittent use of impure insulins of animal origin may also impede insulin therapy.
It has been estimated that 50% of the day to day variation in glucose values is owing to intra-subject variation
in absorption and time course of action. Consistency is important to reduce fluctuations in glucose values. The
site of injection may alter insulin pharmacokinetics and absorption, especially if lipohypertrophy is present. The
periumbilical area is the preferred site to inject insulin because of the rapid and consistent absorption kinetics
observed at this location; however, rotating the injection site is usually advised. It is also advisable to inject in
the same body location for a certain meal time (i.e., triceps fat pad for breakfast, abdomen for lunch, and upper
thighs for dinner).
Selecting Patients for Intensive Insulin Therapy
Insulin-naive patients with T2DM who are unable to achieve or maintain glycemic goals on oral agents can
advance therapy to basal insulin plus oral agents and then advance to basal-prandial therapy in a stepwise manner.
Prandial insulin is added to the regimens of patients not achieving glycemic goals despite well-controlled FBG
after 3 mo of basal insulin (19). Initially, prandial insulin therapy may only need to be provided with the largest
meal of the day, or whichever meal produces the greatest postprandial glucose excursions from baseline.
Chapter 12 / Intensive Insulin Therapy in T2DM 187
Certain patients with newly diagnosed T2DM may benefit from early initiation of basal-prandial insulin therapy,
including those with glucose toxicity or LADA. LADA is caused by immune-mediated destruction of the insulin-
producing pancreatic -cells, similar to type 1 diabetes, but typically is diagnosed in patients aged 30–60 yr (the
diagnosis is confirmed by blood tests for the presence of glutamic acid decarboxylase antibodies). Patients with
LADA generally do not respond adequately to oral agents, and will require insulin therapy at an earlier stage than
other patients with T2DM (17,18).
Newly diagnosed patients with A1C >10.0% require more than a 3.0% reduction in A1C to achieve target
glucose levels recommended by the ADA (19). Because reductions in A1C of this magnitude generally will not
be achieved with oral agents alone, especially in the face of glucose toxicity, such patients who are symptomatic
should be started on insulin immediately. Once insulin has successfully reversed glucose toxicity, many of these
newly diagnosed patients can then be controlled on oral agents alone (20).
BASIC CONCEPTS OF BASAL BOLUS STRATEGIES
An individualized regimen may incorporate insulins of varying onset of action, peak, and duration (Table 3).
The use of premeal regular insulin with bedtime NPH as the basal insulin has been a common strategy for intensive
insulin therapy in the United States over the past decade. Because regular insulin should be administered 30 to 45
min before meals, a short term risk of hypoglycemia exists if the meal is delayed, and there is a risk of delayed
hypoglycemia because of the overlap of pharmacodynamics of regular and NPH insulin. As a result, use of
regular insulin may be complicated by high postprandial glucose levels and delayed hypoglycemia. An alternative
strategy is the mealtime administration of rapid acting insulin analogs in combination with long-acting basal
insulin, such as glargine or detemir (21–23). Regimens that use multiple doses of intermediate acting insulin such
as NPH (usually only 2) can be associated with unpredictable nocturnal hypoglycemia and day-to-day instability
of blood glucose patterns, in part because of intra-patient variability in the peak action profile of NPH. NPH,
which is commonly given twice daily exhibits its peak action ∼4 to 8 h after administration, has also been used
in combination with rapid-acting insulin analogs, Because of its time to peak action, NPH should ideally be given
every6hor4times per day to be effective as a true basal insulin. NPH given 4 times a day would be difficult
to implement and is not needed with the availability of long-acting insulin analogs.
Improved mealtime glucose control with the rapid-acting analogs has exposed the gaps in basal insulin coverage
provided by therapy with the traditional intermediate insulin preparations. Taking a long-acting basal insulin
analog (e.g., glargine or detemir) with a relatively constant and flat pharmacokinetic profile once or twice a
day will result in a more physiologic pattern of basal insulin replacement. Insulin glargine has been available in
the United States since 2000 and in combination with a rapid-acting insulin analog has demonstrated effective
glycemic control and a lower incidence of nocturnal hypoglycemia than other insulin preparations currently used
for basal insulin supplementation (28,30,31).
In a 22-wk randomized trial, 395 people with T2DM were randomized to a regimen using insulin aspart +insulin
detemir, the newest basal insulin to become available, versus regular human insulin + NPH (24). Basal insulins
were given once or twice daily, in accordance with prior treatment, and oral agents were discontinued. Treatment
Table 3
Comparison of human and analogue insulins
∗
Insulin preparations Onset of action Peak Duration of action
Lispro Aspart Glulisine 5−15 minutes 45−90 mins 3−5 hours
Human Regular 30−60 minutes 2−4 hours 6−8 hours
Human NPH 2−3 hours 6−8 hours 10−18 hours
Detemir 1−2 hours ∼12−16 hours; relatively flat Up to 24 hours
Glargine 1−2 hours Peakless ∼24 hours
Ref (7)
∗
The time course of action of any insulin may vary in different individuals depending on the degree of obesity, site of injection and
ambient glucose level at the time of injection.
188 Edelman
with insulin detemir + aspart produced equivalent glycemic control to a similar regimen using NPH + regular
insulin (HbA1c 7.46 versus 7.52%, respectively), but with less weight gain (0.52 versus 1.13 kg, p = 0.038)
and less within-person variability in HGM (SD 21.6 versus 27.7 mg/dL, p < 0.001). Safety profiles were similar
between the 2 treatments.
PRACTICAL RECOMMENDATIONS FOR INITIATION OF BASAL PRANDIAL INSULIN
Initiation of basal insulin is normally an important first clinical maneuver in patients failing oral agents. Some
patients with T2DM may have enough endogenous basal insulin secretion to allow for improved glycemic control
with prandial insulin alone. This phenomenon was seen with an inhaled insulin study that will be discussed below.
Nonetheless, initiation of basal insulin is normally key to a successful intensive insulin regimen (25). The options
for initiating basal insulin include: 1) insulin glargine given once daily, 2) insulin detemir once or twice daily, or
3) NPH given 2–4 times daily depending on HGM results. Patients should not experience hyper or hypoglycemia
while fasting if the basal insulin dose is adjusted properly. A typical starting dose is 10 units of basal insulin,
however most obese patients with T2DM will need approximately 40–60 units per day. Frequent follow-up to
review HGM data is required to make the proper adjustments.
If A1C goals are not achieved after a period of 3–6 mo of treatment with basal insulin plus oral agents, patients
should be instructed to monitor glucose preprandially and/or 1–2 h after each meal on a rotating basis to identify
the main meal that is contributing to hyperglycemia. Once identified, 5–10 U or 0.1 units/100Kg body weight of
rapid-acting insulin should be administered before this meal. Adjustment of the dose is made on HGM results
within 1 to 2 h after the meal or simply the blood glucose results before the next meal, or bedtime. If A1C
goals are still not reached after 3–6 mo of basal insulin, oral agents, and 1 prandial insulin injection at the main
meal, prandial insulin can be added before other meals based on home glucose monitoring as described above.
Rapid-acting insulin doses should continue to be titrated according to home glucose monitoring data (either post
prandial values or the glucose value before the subsequent meal). The amount of increase in the dose will depend
on the total daily insulin dose (basal and prandial) in addition to the glucose levels. If the total daily insulin dose
is less than 50 units then increase in the prandial dose should be in increments of 3 to 5 units at a time (< 10%).
For patients on large daily doses of insulin changes of 5 to 10 units (40%) may be more appropriate. As the
patient’s blood glucose levels approach goal, the changes in insulin doses should be more modest. Caution should
also be taken in the elderly and in patients with hypoglycemia unawareness. Continuous glucose monitoring can
help determine the correct dose safely.
IMPLICATIONS OF BASAL-PRANDIAL REGIMENS FOR EXISTING ORAL AGENTS
As a general rule the oral agent regimen should be continued until the addition of insulin achieves glycemic
control goals. As glycemic control is established (A1C < 7.0%), the oral agents should be evaluated (reduced
dose or discontinue) in patients on basal-prandial insulin therapy. Doses of sulfonylurea should be discontinued
or reduced by ≥50% as necessary, especially if hypoglycemia occurs. If subsequent monitoring clearly shows
prompt loss of control, the original dose of oral agent should be resumed or upward titration of the insulin. For
patients receiving metformin, thiazolidinediones, and/or DPP4 inhibitors, the decision to continue and/or adjust
doses may be left to the discretion of the physician. Typically, if significant glycemic benefit with the oral agent
was achieved before starting insulin therapy it may be beneficial to continue the drug.
EXTERNAL INSULIN PUMP THERAPY
External insulin pump therapy or continuous subcutaneous insulin infusion (CSII) has been used traditionally
in patients with type 1 diabetes. However, insulin pump therapy is extremely valuable in patients with T2DM
who require insulin but who have not achieved glycemic control with subcutaneous injections or who are seeking
a more flexible lifestyle (26). As seen in T1DM, insulin pump therapy allows for increased flexibility in meal
timing and amounts, increased flexibility in the timing and intensity of exercise, improved glucose control while
reducing the daily variability of blood glucose values and incidence of hypoglycemia. Although not documented
well in clinical trials, many experts believe that because of the more physiologic delivery of insulin, glucose
Chapter 12 / Intensive Insulin Therapy in T2DM 189
control is achieved with less insulin than that needed in a subcutaneous insulin regimen. This may be caused by a
reduction in glucose toxicity and improvement of insulin resistance and beta-cell secretory function as a result of
improved glycemic control with pump therapy. Weight gain may be lessened if the patient requires less insulin
than was used before insulin pump therapy. In addition, with the reduction of hypoglycemic events, there is less
overeating to compensate for excessive insulin.
Because pumps deliver constant infusions of regular or fast-acting insulin, there is no peaking or waning of
activity of injected intermediate- and long-acting insulins, which do not provide as constant a basal rate owing to
variable absorption and pharmacokinetics. Insulin pump therapy may allow for more reliable insulin absorption
and pharmacokinetic profile, resulting in improved reproducibility in insulin availability and reduced fluctuations
in glycemic control (27).
Presently, there is a paucity of clinical trials using insulin pumps in T2DM, but pump therapy is a viable option
in insulin-requiring patients with T2DM who are unable to achieve adequate glycemic control with multiple-
injection regimens. Although some studies demonstrate metabolic benefits of pump therapy in T2DM, all are
limited by a relatively short period of evaluation and a small number of heterogeneous subjects. Interpretation
of these studies is further confounded by the random assignment of subjects to dissimilar conventional insulin
regimens, making comparison between studies difficult.
Garvey et al (28) studied the effect of intensive insulin therapy on insulin secretion and insulin action before
and after 3 wk of CSII therapy in 14 patients with T2DM (age 50 +/−3 yr, duration of diabetes 7.8 +/− 2.1 yr,
and 119% ideal body weight). In 3 wk of therapy, the mean fasting plasma blood glucose and HbA1c values fell
46% and 38%, respectively. The mean daily insulin dose was 110 units/d, and there was a 74% increase in the
insulin-stimulated glucose disposal rate, and a 45% reduction in hepatic glucose output to mean levels similar
to those of normal subjects. In addition, there were significant improvements in both endogenous insulin and
C-peptide secretion. This study demonstrates that pump therapy is feasible and effective at improving metabolic
control and reversing glucose toxicity in these poorly controlled subjects with T2DM.
In another recent study (29), 132 CSII naive type 2 diabetic patients were randomized to the pump or multiple
daily injections (MDI). This study showed that pump therapy provided efficacy and safety equivalent to MDI
therapy. Lower pre and post meal blood glucose values were shown by the CSII group at most time points (values
were only significant 90 min after breakfast; 167 +/−47.5 mg/dL versus 192 +/− 65.0 mg/dL for CSII and MDI,
respectively; p = 0.019).
In summary, insulin pump therapy has not been fully evaluated in patients with T2DM. From published studies,
however, it is apparent that CSII therapy can safely improve glycemic control while limiting hypoglycemia. CSII
may be particularly useful in treating patients with T2DM who do not respond satisfactorily to more conventional
insulin treatment strategies.
INHALED INSULIN
Insulin therapy is often delayed or suboptimally implemented in patients with T2DM. Although several factors
contribute to poor implementation of insulin therapy, the inconvenience and complications, such as weight gain
and poor patient acceptability, of a daily regimen of multiple injections, and psychological resistance may all play
a role. These problems are being addressed by the ongoing development of alternate insulin delivery systems,
including the inhaled and intranasal routes, as well as molecular modifications that may allow oral therapy.
The first alternate insulin delivery system, inhaled human insulin powder (Exubera) (30–34), did become
available, but was removed from the US market because of poor sales and reduced demand for the product.
SUMMARY AND RECOMMENDATIONS
Type 2 diabetes is a common disorder often accompanied by numerous metabolic abnormalities, leading
to increased rates of cardiovascular morbidity and mortality. Improved glycemia will delay or prevent the
development of microvascular disease and reduce many or all of the acute and subacute complications that
worsen the quality of daily life. In selected patients, intensive insulin therapy can be a successful adjunct to diet
and exercise for control of hyperglycemia (Table 5). This is best achieved in a multidisciplinary setting using
complementary therapeutic modalities that include a combination of diet, exercise, and pharmacologic therapy.
190 Edelman
Table 5
Levels of evidence for insulin therapy in type 2 diabetes
Recommendation Level of evidence
Combination therapy (oral agents during the day in addition to a basal insulin) is an effective
way to improve glucose control and minimize weight gain
1A
Split mixed or premixed insulin given 2 to 3 times a day can effectively get patients with type 2
diabetes safely to goal (A1c<7%)
1B
Basal bolus or mutiple daily injection regimens in type 2 diabetes is an effective way to achieve
glycemic goals.
1C+
Patients with type 2 diabetes may only need 1 injection of a fast acting insulin with their largest
meal in addition to a basal insulin instead of before all meals
1C+
Patients with type 2 diabetes can be treated effectively with CSII (continuous subcutaneous
insulin infusion) pumps
1C
Emphasis should be placed on diet and exercise initially, and throughout the course of management as well,
because even modest success with these therapies will enhance the glycemic response to both oral antidiabetic
agents and insulin. With the development of newer insulin analogues, inhaled insulin, and pramlintide, increasing
flexibility is available to tailor insulin regimens for successful use in individual patients.
REFERENCES
1. American Diabetes Association. Clinical Practice Recommendations 2007 Diabetes Care. 30(1), 2007.
2. Colwell JA. Controlling T2DM: are the benefits worth the cost? JAMA (2006).
3. Tuomi T, Groop LC, Zimmet PZ, Rowley MJ, Knowles W, Mackay IR. Antibodies to glutamic acid decarboxy – lase reveal latent
autoimmune diabetes mellitus in adults with a non-insulin dependent onset of disease. Diabetes 1993;42:359.
4. American Diabetes Association. Diabetes Dictionary. 2004. Available at dictionary.jsp. Accessed on
October 4, 2003.
5. Yu A, Wu PS, Edelman SV. The natural history of non-insulin dependent diabetes mellitus in a Filipino migrant population. Presented
at the 3
rd
International Diabetes Federation, Western Pacific Regional Congress: Hong Kong; September 25–28, 1996.
6. Henry RR, Gumbiner B, Ditzler T, Wallace P, Lyon R, Glauber HS. Intensive conventional insulin therapy for type 2 diabetics.
Metabolic effects duringa6mooutpatient trial. Diabetes Care 1993;161(1):21–31.
7. Kuddlacek S, Schernthaner G. The effect of insulin treatment on HbA1c, body weight and lipids in type 2 diabetic patients with
secondary failure to sulfonylureas. A five-year follow-up study. Horm Metab Res 1992;24:478.
8. Roach P, Woodworth JR. Clinical Pharmacokinetics and pharmacodynamics of insulin lispro mixtures. Clini Pharmacokinet
2002;41(13):1043–1057.
9. Roach P, Yu L, Arora V for the Humalog Mix25 Study Group. Improved postprandial glycemic control during treatment with Humalog
Mix25, a novel protamine-based insulin lispro formulation. Diabetes Care 1999;22:1258–1261.
10. Jacobsen LV, Sogaard B, Ris A. Pharmacokinetics and pharmacodynamics of a premixed formulation of soluble andprotamine-retarded
insulin aspart. Eur J Clin Pharmacol 2000;56(5):399–403.
11. Boehm BO, Home PD, Brehend C, Kamp NM, Lindholm A. Premixed insulin aspart 30 versus premixed human insulin 30/70 twice
daily: a random mixed trial in type 1 and type 2 diabetic patients. Diabet Med 2002;19:393–399.
12. Malone JK, Kerr LF, Campaigne BN, Sachson RA, Holcombe JH; Lispro Mixture-Glargine Study Group. Combined therapy with
insulin lispro Mix 75/25 plus metformin or insulin glargine plus metformin: a 16-week, randomiized, open label, crossover study in
patients with T2DM beginning insulin therapy. Clin Ther 2004;26:2034–2044.
13. Raskin P, Allen E, Hollander P, Lewin A, Gabbay, RA, Hu P, Bode B, Garber A; INITIATE Study Group. Initiating insulin therapy
in T2DM: a comparison of biphasic and basal insulin analogs. Diabetes Care 2005;28:260–265.
14. Garber AJ, Wahlen J, Wahl T, Bressler P, Braceras R, Allen E, Jain R. Attainment of glycemic goals in T2DM with once-, twice-, or
thrice-daily dosing with biphasic insulin aspart 70/30 (The 1-2-3 Study. Diabetes Obes Metab 2006;8:58–66.
15. Janka HU, Plewe G, Riddle MC, Kliebe-Frisch C, Schweitzer MA, Yki-Jarvinen H. Initiation of Insulin in patients with Type 2
diabetes failing oral therapy. Diabetes Car. 2005;28:254–259.
16. DeWitt DE, Hirsch IB. Outpatient insulin therapy in type 1 and T2DM mellitus scientific review. JAMA 2003;289:2254–2264.
17. Naik RG, Palmer JP. Latent autoimmune diabetes in adults (LADA). Rev Endocr Metab Disord 2003;4:223–241.
18. Pozzilli P, Di Mario U. Autoimmune diabetes not requiring insulin at diagnosis (latent autoimmune diabetes of the adult): definition,
characterization, and potential prevention. Diabetes Care 2001;24:1460–1467.
19. American Diabetes Association. Standards of medical care in diabetes. Diabetes Care 2005;28 Suppl 1:S4–S36.
20. American Association of Clinical Endocrinologists. The American Association of Clinical Endocrinologists Medical Guidelines for the
Management of Diabetes Mellitus: The AACE System of Intensive Diabetes Self-Management – 2002 Update. Endocr Prac 2002;8
Suppl 1:40–82.
Chapter 12 / Intensive Insulin Therapy in T2DM 191
21. Yki-Jarvinen H, Dressler A, Ziemen M for the HOE 901/3002 Study Group. Less nocturnal hypoglycemia and better post-dinner
glucose control with bedtime insulin glargine compared with bedtime NPH insulin during insulin combination therapy in T2DM.
Diabetes Care 2000;23:1130–1136.
22. Heinemann L, Linkeschova R, Rave K, Hompesch B, Sedlak M, Heise T, et al. Time-action profile of the long-acting insulin analog
insulin glargine (HOE 901) in comparison with those off NPH insulin and placebo. Diabetes Care 2000;23:644–649.
23. Rosenstock J, Park G, Ziimmerman J; US insulin glargine (HOE 901) Type I Diabetes Investigator Group. Basal insulin glargine (HOE
901) versus NPH insulin in patients with type 1 ddiabetes on multiple daily insulin regimens. Diabetes Care 2000;23:1137–1142.
24. Raslova K, Bogoev M, Raz I, Leth G, Gall MA, Hancu N. Insulin detemir and insulin aspart: a promising basal-bolus regimen for
T2DM. Diabetes Res Clin Pract 2004;66:193–201
25. Riddle MC, Rosenstock J, Gerich J, the Insulin Glargine Study Investigators. The Treat to Target Trial: randomized addidtion of
glargine or human NPH insulin to oral therapy of type 2 diabetic patients. Diabetes Care 2003;26:3080–3086
26. Plodkowski RA, Edelman SV. The State of Insulin Pump Therapy-2002. Current Opinion in Endo and Diabetes. Vol 9:4 2002.
27. Plodkowski, RA, Edelman, SV, Physiologic Insulin Replacement with Continuous Subcutaneous Insulin Infusion: Insulin Pump
Therapy. Clinical Diabetes 2006; 429–441.
28. Garvey WT, Olefsky JM, Griffin J, Hamman RF, Kolterman OG. The effect of insulin treatment on insulin secretion and insulin
action in T2DM mellitus. Diabetes 1985;34:222.
29. Raskin P, Boode BW, Marks JB, Hirsch IB, Weinstein RL, McGill JB, Peterson GE, Mudaliar SR, Reinhardt RR. Continuous
subcutaneous insulin infusion and multiple daily injection therapy are equally effective in T2DM: a randomized, parallel-group,
24-week study. Diabetes Care 2003;26(9):2598–2603.
30. EXUBERA (Package insert). New York, NY, Pfizer, Inc.
31. Rave K, Bott S, Heinemann L, et al. Time-action profile of inhaled insulin in comparison with subcutaneously injected insulin lispro
and regular human insulin. Diabetes Care. 2005;28:1077–1062.
32. Hollander PA, Blonde L, Rowe R, et al. Efficacy and safety of inhaled insulin (Exubera) compared with subcutaneous insulin therapy
in patients with type 2 diabetes. Results of a 6-month, randomized, comparative trial. Diabetes Care. 2004;27:2356–2356.
33. Dreyer M, for the Exubera Phase 3 Study Group. Efficacy and 2-year pulmonary safety data of inhaled insulin as adjunctive
therapy with metformin or glibenclamide in type 2 diabetes patients poorly controlled with oral monotherapy. Diabetologia. 2004;
47(suppl 1): A44.
34. Fineberg SE, Kawabata T, Finco-Kent D, et al. Antibody responses to inhaled insulin in patients with type 1 and type 2 diabetes.
J Clin Endocrinol Metabol. 2005;90:3287–3294.
13
Hypoglycemia in Type 2 Diabetes
Philip E. Cryer
CONTENTS
Hypoglycemia in Diabetes: The Clinical Problem
Frequency of Hypoglycemia
Physiology and Pathophysiology of Glucose Counterregulation
Risk Factors for Hypoglycemia
Prevention of Hypoglycemia: Risk Factor Reduction
Treatment of Hypoglycemia
Perspective
Acknowledgments
References
Summary
Iatrogenic hypoglycemia is the limiting factor in the glycemic management of diabetes. It can be caused by sulfonylureas or other
insulin secretagogues, and perhaps by metformin, as well as by insulin. Hypoglycemia is less frequent overall in type 2 diabetes (T2DM),
compared with type 1 diabetes (T1DM). However, it becomes a progressively more frequent problem, ultimately approaching that in
T1DM, in advanced (i.e., insulin deficient) T2DM because of compromised glucose counterregulation – the syndromes of defective glucose
counterregulation and hypoglycemia unawareness, the components of hypoglycemia-associated autonomic failure – analogous to that which
develops early in the course of T1DM. Clearly, prevention of hypoglycemia is preferable to its treatment. By practicing hypoglycemia risk
reduction – addressing the issue, applying the principles of aggressive glycemic therapy and considering both the conventional risk factors
and those indicative of compromised glucose counterregulation – the therapeutic goal is to reduce mean glycemia as much as can be
accomplished safely in a given patient at a given stage of T2DM. Particularly in view of the growing array of glucose-lowering drugs that
can be used to optimize therapy, hypoglycemia should not be used as an excuse for poor glycemic control. Nonetheless, better methods,
such as those that would provide plasma glucose regulated insulin secretion or replacement, are needed for people with T2DM, as well as
those with T1DM, if euglycemia is to be maintained over a lifetime of diabetes.
Key Words: Hypoglycemia; barrier to glycemic control; therapy with sulfonylureas; therapy with metformin; therapy with insulin; insulin
analogues; glucagon; epinephrine; defective glucose counterregulation; hypoglycemia unawareness; hypoglycemia-associated autonomic;
failure.
HYPOGLYCEMIA IN DIABETES: THE CLINICAL PROBLEM
Iatrogenic hypoglycemia is the limiting factor in the glycemic management of diabetes (1–3). It causes
recurrent morbidity in most people with type 1 diabetes (T1DM) and many with type 2 diabetes (T2DM),
and is sometimes fatal. The barrier of hypoglycemia—its reality and its possibility—precludes maintenance of
euglycemia over a lifetime of diabetes and thus full realization of the vascular benefits of glycemic control
(4–6). Importantly, episodes of hypoglycemia, even asymptomatic episodes, impair physiological and behavioral
defenses against subsequent hypoglycemia by causing hypoglycemia-associated autonomic failure (the clinical
syndromes of defective glucose counterregulation and hypoglycemia unawareness) and thus a vicious cycle of
recurrent hypoglycemia (1–3).
From: Contemporary Endocrinology: Type 2 Diabetes Mellitus: An Evidence-Based Approach to Practical Management
Edited by: M. N. Feinglos and M. A. Bethel © Humana Press, Totowa, NJ
193
194 Cryer
Table 1
American Diabetes Association Workgroup on Hypoglycemia recommended classification of hypoglycemia
in people with diabetes (8)
Severe Hypoglycemia. An episode requiring the assistance of another person to raise the plasma glucose concentration
resulting in resolution of symptoms, with or without a measured low plasma glucose concentration.
Documented Symptomatic Hypoglycemia. Symptoms consistent with hypoglycemia with a measured plasma glucose concen-
tration <
70 mg/dL (3.9 mmol/L).
Asymptomatic Hypoglycemia. A measured plasma glucose concentration <
70 mg/dL (3.9 mmol/L) in the absence of
symptoms.
Probable Symptomatic Hypoglycemia. Typical symptoms of hypoglycemia without a measured plasma glucose concentration.
Relative Hypoglycemia. Typical symptoms of hypoglycemia with a measured plasma glucose concentration >70 mg/dL (3.9
mmol/L) but approaching that level. (Such episodes occur in people with poorly controlled diabetes.)
Episodes of iatrogenic hypoglycemia cause both physical and psychological morbidity. The physical morbidity
ranges from unpleasant neurogenic symptoms (e.g., sweating, hunger, anxiety, palpitations, and tremor) and
neuroglycopenic manifestations (e.g. behavioral changes and cognitive impairment) to expressions of severe
neuroglycopenia such as seizure and coma. Transient focal neurological deficits sometimes occur. Although
seemingly complete neurological recovery is the rule, severe, prolonged hypoglycemia can result in permanent
neurological damage, and even death (7). At the very least, an episode of hypoglycemia is a nuisance and a
distraction. It can be embarrassing and lead to social ostracism. The additional psychological morbidity includes
fear of hypoglycemia, guilt about that rational fear and high levels of anxiety that can be an impediment to
glycemic control. The performance of critical tasks, such as driving, is measurably impaired, as is judgement.
Because the glycemic thresholds for the manifestations of hypoglycemia are dynamic—they shift to higher
than normal plasma glucose concentrations in poorly controlled diabetes and to lower than normal plasma glucose
concentrations in well controlled diabetes, as discussed later—it is not possible to specify a plasma glucose
concentration that defines hypoglycemia in people with diabetes. The diagnosis is made most convincingly by
documentation of Whipple’s Triad: symptoms consistent with hypoglycemia, a low plasma glucose concentration,
and relief of those symptoms after the plasma glucose concentration is raised to (or above) normal. Nonetheless,
the American Diabetes Association Workgroup on Hypoglycemia (8) recommended that people with diabetes
should become concerned, and consider defensive actions, at a plasma glucose concentration <
70 mg/dL (3.9
mmol/L). That plasma glucose level approximates the lower limit of the postabsorptive plasma glucose concen-
tration range and the glycemic threshold for activation of glucose counterregulatory (plasma glucose-raising)
systems, as well as the upper level at which an antecedent low plasma glucose concentration results in reduced
glucose counterregulatory responses to subsequent hypoglycemia, in nondiabetic individuals. The Workgroup also
recommended a classification of hypoglycemia in people with diabetes (Table 1).
On this background of the clinical problem of hypoglycemia in diabetes, the incidence and pathophysiology of,
and risk factors for, hypoglycemia in T2DM and clinical approaches to its prevention and treatment are discussed
in this chapter. The premises are that iatrogenic hypoglycemia becomes progressively more limiting to glycemic
control as patients approach the insulin deficient end of the spectrum of T2DM, that the pathophysiology of
glucose counterregulation becomes similar to that in T1DM as patients progress across that spectrum, and that
it is possible to both improve glycemic control and reduce the risk of hypoglycemia even in advanced, insulin
deficient T2DM, just as it is in T1DM (1–3).
FREQUENCY OF HYPOGLYCEMIA
During aggressive glycemic therapy, the average patient with T1DM suffers plasma glucose concentrations
<50 mg/dL (2.8 mmol/L) approx 10% of the time, symptomatic hypoglycemia about twice a week and severe,
at least temporarily disabling, hypoglycemia about once a year (1). Valid estimates of the frequencies of
these hypoglycemias (i.e., those based on controlled studies designed to include treatment to near euglycemia)
during aggressive glycemic therapy of T2DM are limited (1). Ascertainment of hypoglycemia in T2DM is a
Chapter 13 / Hypoglycemia in Type 2 Diabetes 195
Table 2
Cumulative prevalence of hypoglycemia (percent of patients affected) in T2DM over 6 yr
in the United Kingdom Prospective Diabetes Study (9)
Therapy* n HbA
1C
(%) % with Any Hypoglycemia Major**
Diet 379 8 3 015
Sulfonylurea 922 7145 33
Insulin 689 7176 112∗∗∗
Diet 297 822804
Metformin 251 7417624
* Taking assigned medication.
** Requiring medical assistance or admission to hospital.
*** Compared with severe hypoglycemia (that requiring the assistance of another individual) in
65% of T1DM over 6.5 yr in the Diabetes Control and Complications Trial.
major challenge. Event rates for asymptomatic hypoglycemia are virtually unknown and those for symptomatic
hypoglycemia are undoubtedly minimum estimates. Those for severe hypoglycemia, a memorable event albeit
reflecting only a small fraction of the hypoglycemic experience, are most reliable. Overall, however, hypoglycemia
is less frequent in T2DM than it is in T1DM. That likely reflects intact defenses against falling plasma glucose
concentrations early in the course of the disease, but compromised defenses later.
Iatrogenic hypoglycemia occurs during treatment with a sulfonylurea or insulin, or perhaps with metformin,
even in patients with T2DM treated with these drugs from the time of diagnosis. For example, although adjudicated
hypoglycemia event rates in the UKPDS have not been published, self-reported data from the United Kingdom
Prospective Diabetes Study (UKPDS) (9) indicate that, compared with diet alone, therapy with metformin,
sulfonylurea or insulin was associated with a 6-fold, 22-fold and 75-fold increased risk, respectively, of the
proportion of patients suffering major hypoglycemia over the first 6 yr of diagnosed T2DM (Table 2).
Iatrogenic hypoglycemia becomes a progressively more frequent clinical problem as patients approach the
insulin deficient end of the spectrum of T2DM. Insulin secretion decreases progressively (9) and hypoglycemia
becomes more limiting to glycemic control over time (10). Indeed, in one series, the frequency of severe
hypoglycemia was similar in T2DM and T1DM matched for duration of insulin therapy (11). Population-based
data indicate that the incidence of hypoglycemia in insulin treated T2DM approaches that in T1DM. For example,
data from Tayside, Scotland indicate that the event rates for any hypoglycemia and for severe hypoglycemia
in insulin treated T2DM were 38% and 30%, respectively, of those in T1DM (12). Similarly, in insulin treated
T2DM the event rates for hypoglycemia requiring emergency treatment in hospital regions of known total and
diabetic populations have been reported to be 40% (13) or even 100% (14) of those in T1DM.
The fact that hypoglycemia becomes a progressively more frequent clinical problem as patients approach the
insulin deficient end of the spectrum of T2DM (9–14) is explicable on the basis of the pathophysiology of glucose
counterregulation in the insulin deficient state.
PHYSIOLOGY AND PATHOPHYSIOLOGY OF GLUCOSE COUNTERREGULATION
The critical components of the physiology of glucose counterregulation (15)—the redundant, hierarchical
mechanisms that normally prevent or rapidly correct hypoglycemia—are: 1) A decrease in pancreatic -cell
insulin secretion that occurs as plasma glucose concentrations decline within the physiological range and favors
increased endogenous hepatic (and renal) glucose production and decreased glucose utilization by insulin sensitive
tissues such as muscle. 2) An increase in pancreatic -cell glucagon secretion, which occurs as plasma glucose
concentrations fall just below the physiological range and stimulates hepatic glucose production. 3) An increase
in adrenomedullary epinephrine secretion, which also occurs as plasma glucose concentrations fall just below the
physiological range and which both stimulates hepatic (and renal) glucose production and limits glucose utilization
by insulin sensitive tissues. Although demonstrably involved, epinephrine is not normally critical; however, it
becomes critical when glucagon is deficient.
196 Cryer
All 3 of these key defenses against falling plasma glucose concentrations are compromised in insulin deficient
(T1DM and advanced T2DM) diabetes (1–3). In such patients, iatrogenic hypoglycemia is the result of the interplay
of relative or absolute insulin excess, which must occur occasionally because of the pharmacokinetic imperfections
of all insulin replacement regimens, and compromised glucose counterregulation. When endogenous insulin
secretion is deficient, as plasma glucose concentrations fall the plasma insulin concentration does not decrease,
because it is a function of the absorption and clearance of administered insulin, and glucagon concentrations
do not increase. The latter is also likely the result of endogenous insulin deficiency, because a decrease in
intraislet insulin, in concert with a fall in plasma glucose, is normally a signal to increase glucagon secretion
during hypoglycemia (16). In addition, the increase in plasma epinephrine concentrations as plasma glucose
concentrations fall is typically attenuated; the glycemic threshold for sympathoadrenal responses is shifted to lower
plasma glucose concentrations. The latter, a critical feature of the pathophysiology of glucose counterregulation,
is generally the result of recent antecedent iatrogenic hypoglycemia, although sleep, and to some extent prior
exercise, have the same effect (2,3).
In the setting of absent insulin and glucagon responses, an attenuated epinephrine response to falling plasma
glucose concentrations causes the clinical syndrome of defective glucose counterregulation (1–3). Affected patients
are at 25-fold or greater increased risk for severe iatrogenic hypoglycemia during aggressive glycemic therapy. An
attenuated sympathoadrenal response (largely an attenuated sympathetic neural response (17)) causes the clinical
syndrome of hypoglycemia unawareness (1–3). Affected patients are at about 6-fold increased risk for severe
iatrogenic hypoglycemia during aggressive glycemic therapy.
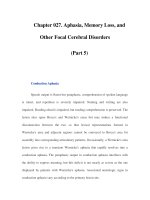
The unifying concept of hypoglycemia-associated autonomic failure (HAAF) (Fig. 1) in T1DM (18) and
advanced T2DM (19) posits that recent antecedent iatrogenic hypoglycemia causes both defective glucose counter-
regulation (by reducing epinephrine responses to a given level of subsequent hypoglycemia in the setting of
absent decrements in insulin and absent increments in glucagon) and hypoglycemia unawareness (by reducing
sympathoadrenal and the resulting neurogenic symptom responses to a given level of subsequent hypoglycemia)
and thus a vicious cycle of recurrent hypoglycemia (1–3). The concept has been extended to include sleep-related
and exercise-related HAAF (2,3) (Fig. 1).
The clinical impact of HAAF is well established in T1DM (1–3). Recent antecedent hypoglycemia, even
asymptomatic nocturnal hypoglycemia, reduces sympathoadrenal epinephrine and neurogenic symptom responses
to subsequent hypoglycemia. It also impairs glycemic defense against hyperinsulinemia and impairs detection of
hypoglycemia in the clinical setting. Finally, the finding that as little as 2 to 3 wk of scrupulous avoidance of
hypoglycemia reverses hypoglycemia unawareness, and improves the reduced epinephrine component of defective
glucose counterregulation, in most affected patients provides compelling support for the concept of HAAF. The
clinical impact of HAAF is less well established in T2DM (1–3). However, the glucagon response to hypoglycemia
is lost, and the glycemic thresholds for responses are shifted to lower plasma glucose concentration by recent
E
Hypoglycemia-Associated Autonomic Failur
e
Antecedent
Exercise
Sleep
SNS
Hypoglycemia
Unawareness
Insulin Deficient Diabetes
(Imperfect insulin replacement)
Reduced Sympathoadrenal
Responses to Hypoglycemia
Antecedent Hypoglycemia
)(
glucagoninsulin,No No
Recurrent Hypoglycemia
Defective Glucose
Counterregulation
Fig. 1. Schematic diagram of the pathophysiology of hypoglycemia-associated autonomic failure in T1DM and advanced T2DM.
(Modified from Cryer PE. Diverse causes of hypoglycemia-associated autonomic failure in diabetes. From (2). Copyright 2004,
Massachusetts Medical Society, Boston, MA.)
Chapter 13 / Hypoglycemia in Type 2 Diabetes 197
antecedent hypoglycemia, in advanced, i.e., insulin deficient, T2DM (19), as they are in T1DM. Thus, people
with T2DM are also at risk for HAAF. This may explain why iatrogenic hypoglycemia becomes more limiting to
glycemic control as patients approach the insulin deficient end of the spectrum of T2DM (9–14). In contrast to its
clinical impact, the mechanism(s) of HAAF is largely unknown. Possible mechanisms have been reviewed (3).
This pathophysiology of glucose counterregulation in diabetes leads directly to an understanding of the clinical
risk factors for iatrogenic hypoglycemia.
RISK FACTORS FOR HYPOGLYCEMIA
The conventional risk factors for hypoglycemia in diabetes are based on the premise that relative or absolute
insulin excess is the sole determinant of risk (1–3) (Table 3). Insulin excess occurs when: 1) Insulin (or insulin
secretagogue) doses are excessive, ill-timed or of the wrong type. 2) Exogenous glucose delivery is decreased
(e.g., following missed meals and during the overnight fast). 3) Endogenous glucose production is decreased (e.g.,
following alcohol ingestion). 4) Glucose utilization is increased (e.g., during exercise). 5) Sensitivity to insulin
is increased (e.g., late after exercise, during the night, following weight loss or improved glycemic control).
6) Insulin clearance is decreased (e.g., with renal failure). These are the risk factors that patients and their care
providers must consider when hypoglycemia is recognized to be a problem. However, these conventional risk
factors explain only a minority of episodes of iatrogenic hypoglycemia (20).
Iatrogenic hypoglycemia is more appropriately viewed as the result of the interplay of relative or absolute
insulin excess and compromised glucose counterregulation in insulin deficient—T1DM and advanced T2DM—
diabetes (1–3) (Fig. 1). Risk factors indicative of compromised glucose counterregulation (Table 3) (Fig. 1)
include: 1) Endogenous insulin deficiency that indicates that insulin levels will not decrease and glucagon levels
will not increase as plasma glucose concentrations fall, fundamental features of the clinical syndrome of defective
glucose counterregulation. 2) A history of severe hypoglycemia, hypoglycemia unawareness, or both, or aggressive
glycemic therapy per se (as evidenced by lower HbA
1C
levels, lower glycemic goals, or both) because these either
indicate or imply recent antecedent hypoglycemia. The latter shifts glycemic thresholds for sympathoadrenal
responses to lower plasma glucose concentrations and, therefore, reduces the adrenomedullary epinephrine and
sympathetic neural responses to a given level of subsequent hypoglycemia. These changes result in the clinical
syndromes of defective glucose counterregulation and hypoglycemia unawareness, as discussed earlier. As also
mentioned earlier, sleep, and to some extent prior exercise, also reduce sympathoadrenal responses to subsequent
hypoglycemia (2,3).
PREVENTION OF HYPOGLYCEMIA: RISK FACTOR REDUCTION
Clearly, it is preferable to prevent, rather than treat, iatrogenic hypoglycemia. To practice hypoglycemia risk
factor reduction (1) (Table 4) the provider should: 1) Address the issue of hypoglycemia in every patient contact.
Table 3
Risk factors for iatrogenic hypoglycemia in diabetes
Relative or absolute Insulin Excess
Insulin (or insulin secretagogue) doses that are excessive, ill-timed or of the wrong type
Decreased exogenous glucose delivery (missed meals, overnight fast)
Decreased exogenous glucose production (drugs including alcohol)
Increased glucose utilization (exercise)
Increased sensitivity to insulin (late after exercise, during the night, following
weight loss or improved glycemic control)
Decreased insulin clearance (renal failure)
Compromised Glucose Counterregulation
Endogenous insulin deficiency
History of severe hypoglycemia, hypoglycemia unawareness, or both
Aggressive glycemic therapy per se (lower HbA
1C
, lower glycemic goals, or both)
198 Cryer
Table 4
Hypoglycemia risk reduction
Address the Issue of Hypoglycemia
Apply the Principles of Aggressive Glycemic Therapy
• Patient education and empowerment
• Frequent self-monitoring blood glucose
• Appropriate and flexible insulin (and other drug) regimens
• Individualized glycemic goals
• Ongoing professional guidance and support
Consider Both the conventional Risk Factors and Those Indicative of Compromised Glucose Counterregulation
(Table 3)
• Drug selection and regimen (see text)
• Short-term scrupulous avoidance of hypoglycemia in patients with hypoglycemia-associated autonomic failure
Patients are often reluctant to mention their hypoglycemia, or their fear of hypoglycemia. The problem cannot
be solved if it is not acknowledged. 2) Apply the principles of aggressive glycemic therapy – patient education
and empowerment, frequent self monitoring of blood glucose, appropriate and flexible insulin (and other drug)
regimens, rational individualized glycemic goals, and ongoing professional guidance and support. 3) Consider the
conventional risk factors and adjust the regimen accordingly. 4) Consider the possibility of compromised glucose
counterregulation and seek a history of hypoglycemia unawareness. Given a history of the latter, a 2–3 wk period
of scrupulous avoidance of hypoglycemia is advisable with the expectation that it will reverse hypoglycemia
unawareness (1–3).
Drug selection is an important aspect of the prevention of hypoglycemia in T2DM (1). Among the oral
hypoglycemic agents, monotherapy with insulin sensitizers such as metformin or the thiazoledinediones should
not produce hypoglycemia because those drugs require endogenous insulin secretion, and insulin secretion should
decrease as plasma glucose concentrations decline within the physiological range. Nonetheless, as mentioned
earlier, metformin has been reported to be associated with hypoglycemia (9) (Table 2). Similarly, monotherapy
with GLP-1 receptor agonists or DPP-IV inhibitors should not cause hypoglycemia because the incretin-induced
increase in insulin secretion is largely, although perhaps not entirely, plasma glucose dependent. Again, insulin
secretion should decrease as plasma glucose concentrations decline within the physiological range. However,
monotherapy with any of these agents seldom results in long-term glycemic control. To the extent they have some
glucose-lowering effect they all can increase the risk of hypoglycemia when combined with administration of an
insulin secretagogue or of insulin.
Sulfonylureas, or the nonsulfonylurea insulin secretagogues repaglinide and netaglinide, can produce
hypoglycemia. Among the sulfonylureas, glyburide has a more prolonged hypoglycemic action than glimepiride
(21), and glyburide is more often associated with clinical hypoglycemia (22). Similarly, the frequency of
hypoglycemia appears to be higher with glyburide than with glipizide (23).
Ultimately, most people with T2DM require treatment with insulin to achieve or maintain a degree of glycemic
control. Indeed, it could be reasoned that insulin should be introduced earlier, rather than later. Therapy with oral
hypoglycemic agents alone can be defended as long as it maintains a level of glycemic control comparable to
that which can be achieved by treatment with insulin and does not cause adverse events unique to those agents.
Otherwise, avoidance of insulin therapy is not defensible.
Among insulin preparations, insulin analogs are less likely to cause hypoglycemia, at least nocturnal
hypoglycemia (24). Those include both long-acting, basal insulin analogs (e.g., glargine or detemir compared
with NPH or ultralente) and rapid-acting, prandial insulin analogs (e.g., lispro or aspart compared with regular).
A comparison of escalating doses of glargine and of NPH added to oral hypoglycemic agents in patients with
T2DM and HbA
1C
levels >7.5%, resulting in similar HbA
1C
levels after 24 wk (25), disclosed 2 interesting
findings. First, approx 60% of the patients achieved a HbA
1C
level <7.0%. Thus, a subset of patients, perhaps
those with intact glucose counterregulatory systems, can achieve some degree of glycemic control with the
addition of a basal insulin alone. Presumably the remaining patients could have achieved that degree of glycemic
Chapter 13 / Hypoglycemia in Type 2 Diabetes 199
control with the addition of prandial insulin. Second, overall hypoglycemia rates were significantly lower with
glargine. All symptomatic hypoglycemic episodes were reduced by 21% and those with measured plasma glucose
concentrations <56 mg/dL (3.1 mmol/L) were reduced by 41%. Symptomatic nocturnal hypoglycemic episodes
were reduced by 42%, and those with measured plasma glucose concentrations <56 mg/dL (3.1 mmol/L) were
reduced by 48%. Nonetheless, there were a few more episodes of severe hypoglycemia in the patients treated with
glargine (14 in 2.5% of the patients compared with 9 in 1.8% of the patients treated with NPH). A meta-analysis
of studies comparing glargine and NPH insulins in T2DM (26) indicated that approximately one-third of patients
achieved HbA
1C
levels <7.0% and that episodes of all symptomatic (–11%), nocturnal (–26%), severe (–46%)
and severe nocturnal (–59%) hypoglycemia were less frequent in the patients treated with glargine. Again, the
goal of reducing HbA
1C
levels only to <7.0% is a compromise based in the reality of the barrier of hypoglycemia.
Ideally, the goal should be a nondiabetic HbA
1C
level.
Because of its dosing flexibility, continuous subcutaneous insulin infusion (CSII) should be superior to a
basal-preprandial bolus (multiple daily injection) insulin regimen. However, compelling evidence is lacking. For
example, in a crossover study involving 100 patients with T1DM, nocturnal hypoglycemia event rates were 25%
lower, but daytime hypoglycemia event rates were 37% higher, during CSII with an analog (aspart) than during
a basal-preprandial bolus regimen with analogs (glargine and aspart) (27). In a randomized trial involving 107
patients with T2DM treated over 1 yr to mean HbA
1C
levels of ∼6.5% with a CSII (lispro) or basal-bolus (glargine
and lispro) regimen, there were no significant differences in the rates of self-treated asymptomatic or symptomatic
hypoglycemia or in the rates of severe hypoglycemia (28).
Bedtime snacks are the traditional approach to the prevention of nocturnal hypoglycemia. However, their
efficacy has been questioned; it appears that they only shift episodes of hypoglycemia to later during the night
(29). Experimental approaches to the problem include attempts to produce sustained exogenous glucose delivery
throughout the night, with bedtime oral administration of the slowly digested carbohydrate uncooked cornstarch or
dinner time administration of an a-glucosidase inhibitor to delay carbohydrate digestion, or to produce sustained
endogenous glucose production throughout the night, with bedtime administration of the glucagon stimulating
amino acid alanine or the epinephrine simulating
2
-adrenergic agonist terbutaline (29,30). The latter has been
shown to prevent nocturnal hypoglycemia in aggressively treated T1DM (29), but in the dose used it also raised
plasma glucose concentrations the following morning.
TREATMENT OF HYPOGLYCEMIA
Episodes of asymptomatic hypoglycemia and the vast majority of episodes of mild-moderate symptomatic
hypoglycemia are self-treated with oral carbohydrates—glucose tablets or candy, beverages or food (Table 5). A
dose of 20 g is appropriate (30). The initial increase in the plasma glucose concentration occurs in about 15 min,
the maximum increase in about 30 min. The effect lasts only about 2 h. Therefore, the patient should monitor the
plasma glucose level and eat a more substantial snack or meal after the glucose level is raised.
Severe hypoglycemia—that requiring the assistance of another person—can also be treated with oral carbohy-
drates if that is practical. However, parenteral therapy is necessary if the patient is unable or unwilling (because of
Table 5
Treatment of a hypoglycemic episode
Oral Carbohydrates (20 g)
• Transient increase in plasma glucose (∼2h)
• Monitor glucose levels
• Snack or meal after glucose levels are raised
Parenteral Therapies: Glucagon (1.0 mg, 15 μg/kg in children, subcutaneously
or intramuscularly) may be less effective in T2DM. Glucose (25 g intravenously).
• Monitor glucose levels
• Infuse glucose intravenously as necessary
• Snack or meal after glucose levels are raised
200 Cryer
Table 6
Grades of recommendations for key treatment points
1A* Iatrogenic hypoglycemia can be caused by treatment with insulin, a sulfonylurea, or repaglinide or nateglinide.
1B** Metformin might cause hypoglycemia.
1A* Insulin analogues are less likely to cause hypoglycemia, at least nocturnal hypoglycemia.
1C*** Given a history of hypoglycemia unawareness, a 2–3 wk period of scrupulous avoidance of hypoglycemia is
advisable.
* Clear risk/benefit, randomized trials without important limitations
** Clear risk/benefit, randomized trial with important limitations
*** Clear risk/benefit, observational studies
neuroglycopenia) to take carbohydrates orally. Glucagon, 1.0 mg (15 μg/kg in children), can be injected subcuta-
neously or intramuscularly by nonmedical individuals suchasaspouse,a parent or an associate; it can also be injected
intravenously by medical personnel. In T1DM, the glucose-raising effect lasts about 3 h (30). However, because it
also stimulates insulin secretion in patients with residual -cell function, glucagon is less effective in T2DM. The
standard glucagon dose can cause vomiting. Smaller doses, repeated if necessary, have been used to avoid vomiting in
children (31). Parenteral, as well as oral, terbutaline also raises plasma glucose concentrations in people with insulin
deficient diabetes (30), but its use in T2DM has not been assessed. It might well be that it, like glucagon, would
be less effective in patients with residual -cell function. Clearly, the preferable parenteral treatment is intravenous
glucose. The standard dose is 25 g initially in adults. The plasma glucose concentration should be monitored serially,
glucose infused as necessary andasnack or meal provided as soon as thatispractical. The duration of a hypoglycemic
episode is a function of the pharmacodynamics of the drug that induced it. Episodes caused by asulfonylureaareoften
prolonged and require prolonged observation and therapy.
PERSPECTIVE
Given the steady progress in the glycemic management of diabetes, including the growing array of plasma
glucose lowering drugs that can be used to optimize therapy, the barrier of hypoglycemia—its possibility and
its reality—should not be used as an excuse for poor glycemic control in people with diabetes. The benefits of
near euglycemia, i.e., partial glycemic control, are well established (4–6). Nonetheless, the benefits of a lifetime
of euglycemia would undoubtedly be greater. Clearly, better methods, such as those that would provide plasma
glucose regulated insulin secretion or replacement, are needed for people with T2DM, as well as those with
T1DM, if the goal of long-term euglycemia is to be achieved.
ACKNOWLEDGMENTS
The author’s work cited was supported, in part, by United States National Institutes of Health grants
R37 DK27085, M01 RR00036, and P60 DK20579 and a fellowship award from the American Diabetes Associ-
ation. The staff of the Washington University General Clinical Research Center provided skilled assistance with
those studies. This manuscript was prepared by Ms. Janet Dedeke.
REFERENCES
1. Cryer PE, Davis SN, Shamoon H. Hypoglycemia in diabetes. Diabetes Care 2003;26:1902–1912.
2. Cryer PE. Diverse causes of hypoglycemia-associated autonomic failure in diabetes. N Engl J Med 2004;350:2272–2279.
3. Cryer PE. Mechanisms of hypoglycemia-associated autonomic failure and its component syndromes in diabetes. Diabetes 2005;
54:3592–3601.
4. The Diabetes Control and Complications Trial Research Group. The effect of intensive treatment of diabetes on the development and
progression of long-term complications in insulin-dependent diabetes mellitus. N Engl J Med 1993;329:977–986.
5. The United Kingdom Prospective Diabetes Study (UKPDS) Group. Intensive blood-glucose control with sulfonylureas or insulin
compared with conventional treatment and risk of complications in patients with type 2 diabetes (UKPDS 33). Lancet 1998;352:
837–853.
Chapter 13 / Hypoglycemia in Type 2 Diabetes 201
6. The United Kingdom Prospective Diabetes Study (UKPDS) Group. Effect of intensive blood-glucose control with metformin on
complications in overweight patients with type 2 diabetes (UKPDS 34). Lancet 1998;352:854–865.
7. Laing SP, Swerdlow AJ, Slater SD, Botha JL, Burden AC, Waugh NR, Smith AW, Hill RD, Bingley PJ, Patterson CC, Qiao Z,
Keen H. The British Diabetic Association Cohort Study II. Cause-specific mortality in patients with insulin-treated diabetes mellitus.
Diabetic Med 1999;16:466–471.
8. Workgroup on Hypoglycemia, American Diabetes Association. Defining and reporting hypoglycemia in diabetes. Diabetes Care
2005;28:1245–1249.
9. The United Kingdom Prospective Diabetes Study (UKPDS) Group. Overview of 6 yr’ therapy of type II diabetes: a progressive disease
(UKPDS 16). Diabetes 1995;44:1249–1258.
10. The United Kingdom Prospective Diabetes Study (UKPDS) Group. A 6-yr, randomized, controlled trial comparing sulfonylurea,
insulin and metformin therapy in patients with newly diagnosed type 2 diabetes that could not be controlled with diet therapy (UKPDS
24). Ann Intern Med 1998;128:165–175.
11. Hepburn DA, MacLeod KM, Pell AC, Scougal IJ, Frier BM. Frequency and symptoms of hypoglycaemia experienced by patients
with type 2 diabetes treated with insulin. Diabet Med 1993;10:231–237.
12. Donnelly LA, Morris AD, Frier BM, et al for the DARTS/MEMO Collaboration. Frequency and predictors of hypoglycaemia in type
1 and insulin-treated type 2 diabetes: a population-based study. Diabetic Med 2005;22:749–755.
13. Holstein A, Plaschke A, Egberts EH. Clinical characterization of severe hypoglycaemia – a prospective population-based study. Exp
Clin Endocrinol Diabetes 2003;111:364–369.
14. Leese GP, Wang J, Broomhall J, et al for the DARTS/MEMO Collaboration. Frequency of severe hypoglycemia requiring emergency
treatment in type 1 and type 2 diabetes: a population-based study of health service resource use. Diabetes Care 2003;26:1176–1180.
15. Cryer PE. The prevention and correction of hypoglycemia. In: Jefferson LS, Cherrington AD, eds. Handbook of Physiology. Section
7. The endocrine System. Volume II, The Endocrine Pancrease and Regulation of Metabolism. Oxford University Press, New York,
2001, pp. 1057–1092.
16. Raju B, Cryer PE. Loss of the decrement in intraislet insulin plausibly explains loss of the glucagon response to hypoglycemia in
isulin deficient diabetes. Diabetes 2005;54:757–764.
17. DeRosa MA, Cryer PE. Hypoglycemia and the sympathoadrenal system: Neurogenic symptoms are largely the result of sympathetic
neural, rather than adrenomedullary, activation. Am J Physiol Endocrinol Metab 2004;287:E32–E41.
18. Dagogo-Jack SE, Craft S, Cryer PE. Hypoglycemia-associated autonomic failure in insulin dependent diabetes mellitus. Recent
antecedent hypoglycemia reduces autonomic responses to, symptoms of, and defense against subsequent hypoglycemia. J Clin Invest
1993;91:819–828.
19. Segel SA, Paramore DS, Cryer PE. Hypoglycemia-associated autonomic failure in advanced type 2 diabetes. Diabetes 2002;51:
724–733.
20. The Diabetes Control and Complication Trial Research Group. Epidemiology of severe hypoglycemia in the Diabetes Control and
Complications Trial. Am J Med 1991;90:450–459.
21. Szoke E, Gosmanov NR, Sinkin JC, et al. Effects of glimepiride and glyburide on glucose counterregulation and recovery from
hypoglycemia. Metabolism 2006;55:78–83.
22. Davis SN. The role of glimepiride in the effective management of type 2 diabetes. J Diabetes Complications 2004;18:367–376.
23. Shorr RI, Ray WA, Daugherty JR, Griffin MR. Individual sulfonylureas and serious hypoglycemia in older people. J Am Geriatr Soc
1996;44:751–755.
24. Hirsch IB. Insulin analogues. N Engl J Med 2005;352:174–183.
25. Riddle MC, Rosenstock J, Gerich J; Insulin Glargine 4002 Study Investigators. The treat-to-target trial: randomized addition of glargine
or human NPH insulin to oral therapy of type 2 diabetic patients. Diabetes Care 2003;26:3080–3086.
26. Rosenstock J, Dailey G, Messi-Benedetti M, Fritsche A, Lin Z, Salzman R. Reduced hypoglycemia risk with insulin glargine: a
meta-analysis comparing insulin glargine with human NPH insulin in type 2 diabetes. Diabetes Care 2005;28:950–955.
27. Hirsch IB, Bode BW, Garg S, et al for the Insulin Aspart CSII/MDI Comparison Study Group. Continuous subcutaneous insulin
infusion (CSII) of insulin aspart versus multiple daily injection of insulin aspart/insulin glargine in type 1 diabetic patients previously
treated with CSII. Diabetes Care 2005;28:533–538.
28. Herman WH, Ilag LL, Johnson SL, et al. A clinical trial of continuous subcutaneous insulin infusion versus multiple daily injections
in older adults with type 2 diabetes. Diabetes Care 2005;28:1568–1573.
29. Raju B, Arbelaez AM, Breckenridge SM, Cryer PE. Nocturnal hypoglycemia in type 1 diabetes: an assessment of preventive bedtime
treatments. J Clin Endocrinol Metab 2006;91:2087–2092.
30. Wiethop BV, Cryer PE. Alanine and terbutaline in treatment of hypoglycemia in IDDM. Diabetes Care 1993;16:1131–1136.
31. Haymond MW, Schreiner B. Mini-dose glucagon rescue for hypoglycemia in children with type 1 diabetes. Diabetes Care 2001;24:
643–645.
14
Type 2 Diabetes and Concomitant Illness
The Prepared Practice
Kathleen Dungan, Elizabeth Harris, and Susan S. Braithwaite
CONTENTS
Hyperglycemia and Concomitant Illnesses in Ambulatory Medicine
Specific Intercurrent Conditions in the Ambulatory Setting
Treatment of Type 2 Diabetes During Concomitant Illness
Summary
References
Summary
Prospective randomized trials have established the importance of glycemic control for the patient with type 2 diabetes with respect to
both the outcomes of critical illness treated in the hospital and chronic microvascular complications of diabetes. For other conditions initially
recognized in the ambulatory setting, the caregiver is called upon to determine not only whether intensification of antihyperglycemic
management is required, but also within what timeframe it must be achieved, and in what setting care will be conducted. Despite the
paucity of data on the potential importance of strict glycemic control to concomitant ambulatory conditions other than the classic tissue
complications of diabetes, we will attempt to review those conditions for which some evidence exists on the following questions: Does
risk of development of the condition correlate with the presence of diabetes? Does risk of development of the condition correlate with
glycemic control? Do outcomes of the condition correlate with glycemic control? Do outcomes of the condition correlate with the presence
of diabetes? Does the co-morbidity itself affect diabetic control or risk of developing diabetes? Strategies for outpatient care during
intercurrent illness are suggested, with remarks about preadmission and postdischarge hospital care.
Key Words: Hyperglycemia; ambulatory care; type 2 diabetes; infectious diseases; malignancy; endocrinopathy; insulin therapy.
HYPERGLYCEMIA AND CONCOMITANT ILLNESSES IN AMBULATORY MEDICINE
Introduction
In the management of stable ambulatory patients having type 2 diabetes, the established targets for glycemic
control are based on the evidence from clinical trials in both type 2 and type 1 diabetes regarding risk for
microvascular disease in relation to glycemic control (1–11). For patients with type 2 diabetes whose blood
glucose is not critically elevated, the timeframe for intensification of antihyperglycemic therapy to achieve these
targets usually spans months or years. The need for intensification of treatment is progressive, the approach is
nonemergent, and commonly there is failure to attain or maintain target range control (1,2,12–16).
Although published guidelines address management of diabetes-associated comorbidities such as hypertension,
dyslipidemia, cardiovascular disease, and microvascular complications (11), in the ambulatory setting practitioners
treat many additional comorbidities. Although there is a paucity of established literature on appropriate glycemic
Manuscript submitted October 31, 2006.
From: Contemporary Endocrinology: Type 2 Diabetes Mellitus: An Evidence-Based Approach to Practical Management
Edited by: M. N. Feinglos and M. A. Bethel © Humana Press, Totowa, NJ
203
204 Dungan et al.
management, it is likely that benefits accruing from intensification of glycemic control have not been fully realized
under present day practice patterns, nor have these putative benefits been adequately studied either on general
hospital wards or in the ambulatory setting. It is the goal of this chapter to outline the rationale for aggressive
recommendations concerning glycemic management during the evolution of certain ambulatory comorbidities in
the presence of type 2 diabetes.
Mechanisms of Destabilization of Glycemic Control during Concomitant Illness
Under normal conditions, insulin works through the insulin receptor and signaling cascades to balance glucose
production and peripheral glucose utilization. In patients with type 2 diabetes, as hyperglycemia fails to suppress
hepatic glucose production and peripheral glucose uptake declines, this balance is lost (17).
Most of the data on metabolic and hormonal responses to hyperglycemia in animals and humans has been
obtained from experimental studies using clamp techniques (18–20). During acute illness or injuries as listed in
Table 1, physiologic counter regulatory hormone and cytokine responses are abnormal in patients with underlying
inflammatory and metabolic abnormalities such as type 2 diabetes (21,22). Acute illness is characterized by a
hypercatabolic state with relative insulin deficiency, increase of catecholamines, and stimulation by tumor necrosis
factor- (TNF-) of lipolysis, resulting in increased plasma free fatty acids. Proinflammatory cytokines including
TNF- and interleukin (IL) 6 increase in both acute and chronic stress-related conditions. In cultured murine
adipocytes, elevation of TNF- interferes with insulin signaling through the insulin receptor (23). Downstream of
the insulin receptor, serine phosphorylation (pS) of insulin receptor substrate (IRS) molecules prevents tyrosine
phosphorylation (pY) of IRS, thus blocking normal insulin action in murine hepatocytes (24). The result is
lipolysis with release of free fatty acids (FFA) from adipocytes. It is hypothesized that a cycle ensues with
TNF-a induction of lipolysis and release of FFA from adipocytes, causing insulin resistance in muscle, liver, and
adipocytes and further release of FFAs (25).
Free fatty acids dose dependently cause insulin resistance in skeletal muscle and liver (26). In human skeletal
muscle, FFAs inhibit insulin-stimulated glucose uptake through inhibition of glucose transport with diminished
phosphorylation activity (27). In rat hepatic tissue, FFAs increase activity of PKC-delta (26,28). FFAs also
increase activation of the proinflammatory NFkB pathway and increase expression of inflammatory cytokines
including TNF- in hepatic rat tissue (26). The induction of hepatic insulin resistance leads to hyperglycemia and
contributes to the perpetuation of the inflammatory response (26).
Mechanisms of Harm during Hyperglycemia and Benefit from Glycemic Control
Improving glycemic control in the surgical and medical intensive care unit has been shown to improve outcomes
(22,29–41). Van den Berghe treated hyperglycemia with insulin in the acute intensive care setting and demonstrated
reduction of mortality and morbidity even in patients without apparent diabetes. While 99% of the intensive
therapy group (n = 765) and 39% of the control group (n = 783) received intravenous insulin infusion in the trial
of Van den Berghe and colleagues, the difference in blood glucose levels was only 50 mg/dL. Among patients
treated in the DIGAMI I trial for myocardial infarction and Portland coronary artery bypass surgery studies, the
survival advantage during intensive glycemic management was attributed largely to reduction in death owing
to arrhythmia, pump failure, and reinfarction (30,34), whereas among patient in the Leuven, Belgium studies
of glycemic control in the surgical ICU the improvement in mortality rate was owing to a reduction of septic
Table 1
Factors contributing to destabilization of glycemic
control during intercurrent illness
Altered caloric and carbohydrate exposure
Altered physical activity
Drugs
Organ dysfunction
Trauma
Infection
Inflammation
Chapter 14 / Type 2 Diabetes and Concomitant Illness 205
Table 2
Putative physiologic and tissue targets for protection
with effective insulin therapy used to control
hyperglycemia during critical illness
• Coagulation pathway
• Inflammatory pathway
– Proinflammatory transcription factors
– Gene products
(a) Adhesion molecules (ICAM-1, E-selectin)
(b) Matrix metalloproteinases
(c) PAI-1
(d) Other
• Hepatic iNOS, plasma NO metabolites
• Endothelium
– Vessel wall inflammatory processes
– Vasomotor tone
• Heart
• Host defenses against infection
• Fuel and energy metabolism
– Glucose
– Free fatty acids
– Reactive oxygen species
– Nutritional status
• Fluid and electrolyte balance
deaths (29). The reduction of morbidities included duration of ventilator dependency, transfusion requirement,
acute renal failure, and unit neuropathy. Although the mechanism by which insulin improves outcomes is still not
well defined, it is thought to involve both metabolic effects of lowering blood glucose as well as direct effects of
insulin on inflammatory cytokines, nitric oxide, free fatty acids, and transcription of glucose transporters (25,42).
In Table 2, the target pathways, tissues, and pathogenetic mechanisms suspected to be important among critically
ill patients, and possibly benefited by intensive intravenous insulin therapy, are listed. Speculative pathways of
injury focus on endothelial function and include concepts that also are proposed as mechanisms contributory to
macrovascular disease. Ambulatory patients having infectious diseases and other concomitant conditions at some
point cross a threshold of severity of illness such that some of these putative “inpatient” mechanisms of injury
might apply during evolution of outpatient illness and become operative before admission to a hospital. Cardiac
function, host defenses against infection, fuel and energy metabolism, and fluid and electrolyte balance are at
risk in both the inpatient and the ambulatory setting. In fact, blood glucose upon admission may be a prognostic
indicator for the outcome of hospitalization (43–49).
Coagulation, the Inflammatory Pathway, Nitric Oxide, and the Endothelium
TNF- is implicated in inflammation, cell apoptosis and survival, cytotoxicity, production of IL-1 and IL-6,
and induction of insulin resistance in numerous clinical settings (50). Proinflammatory cytokines such as TNF-
stimulate corticotrophin-releasing hormone, with eventual elevation in cortisol (51). In addition to inducing
hyperglycemia and insulin resistance, glucocorticoids exert an anti-inflammatory effect through reduction of
the proinflammatory transcription factor NFkB preventing initiation of the inflammatory process. Insulin has
been shown to have similar anti-inflammatory effects at the cellular and molecular level. Insulin infusions in
mononuclear cells of obese nondiabetic subjects reduce NFkB, subsequent transcription of proinflammatory
cytokines, adhesion molecules and enzymatic mechanisms that cause ROS generation (52). Despite marked
differences in glycemic response, corticosteroids and insulin have similar anti-inflammatory effects.
Insulin has a direct effect on nitric oxide synthesis from vascular endothelium through its effects on nitric
oxide synthase (eNOS) (53–55). The eNOS gene transcription and activity are upregulated by insulin. Nitric
oxide generated by eNOS causes vasodilation and antiaggregation effect on platelets (56,57). Thus, it is not
206 Dungan et al.
surprising that nitric oxide increases blood flow to the upper and lower extremities as well as cause dilation of
the carotid artery (54,58,59).
An hepatic isoform of nitric oxide synthetase, iNOS, can generate higher levels of circulating nitric oxide
concentrations that can be proinflammatory and evoke organ damage in ischemia (60). In a large, randomized
controlled study using intensive insulin in critically ill patients, prevention of hyperglycemia with intensive insulin
therapy suppressed iNOS gene expression and lowered circulating nitric oxide levels. The authors concluded that
these effects on the endothelium statistically explained a significant part of the improved patient outcome with
insulin therapy (60).
Host Defenses against Infection
A number of observational studies and postinterventional comparisons to historical series support the concept
that among hospitalized patients infection is less likely to occur or progress with stringent glycemic control
(33,38,47,61–64). There is impaired neutrophil function in the presence of hyperglycemia, with evidence from
some studies suggesting reversibility upon correction of hyperglycemia and with the use of insulin (65–71). Host
defense against mucormycosis is reduced in diabetes, especially in the presence of acidosis (72,73).
Nutrition, Flux of Metabolites, Hydration, and Electrolyte Status
Increased free fatty acids have been shown in a prospective long term study to be an independent risk factor for
sudden death (74). Increasing concentrations of free fatty acids cause endothelial dysfunction in a dose-dependent
relationship in healthy, nonobese subjects (55) and are arrhythmogenic. Although insulin is known to inhibit
free fatty acids, the changes in insulin-induced free fatty acid suppression with insulin treatment in different
degrees of illness have not been studied (50). In the setting of hyperglycemic hyperosmolar state, the severity
of hyperglycemia and dehydration on admission are important prognostic indicators, along with the nature and
severity of the underlying inciting illness (75–84).
Populations at Risk
Elderly
The geriatric population is at risk for complications of diabetes during acute illness. With increasing age,
insulin secretory reserve, insulin sensitivity, and thirst mechanisms decrease. Thus, infection and illness make
the elderly patient particularly vulnerable to hyperglycemia and dehydration (84). Diabetic hyperosmolar state
is defined by serum glucose greater than 600 mg/dL and serum osmolarity greater than 320 Osm/L. Increasing
age, nursing home residence, and infection are predisposing factors, and mortality figures are reported as 10 to
20%. In addition, increasing age and associated illness are also risk factors for increased mortality in diabetic
hyperosmolar state (75–84).
Socioeconomically Disadvantaged
Low-income patients are also at increased risk for complications during acute illness. A cross-sectional analysis
of administrative claims over 2 yr of 9,453 patients aged 65–75 yr demonstrated that Medicare/Medicaid status
was independently associated with not receiving diabetes care, including annual HgbA1C, biennial eye exam,
and biennial lipid testing. Membership in a minority race and increased visits to the emergency department were
significantly associated with lack of diabetes care in the Medicare/Medicaid population, and adverse outcomes in
minority populations, although multifactorial, may hinge in part on access to health care resources (85–89).
A population-based cohort study of 600,000 diabetic patients in Canada demonstrated that individuals in the
lowest income quintile were 44% more likely than those in the highest income quintile to have one or more
hospitalizations or emergency department visits for hyperglycemia or hypoglycemia. This relationship existed
after adjusting for age, sex, urban versus rural residence, comorbidity, frequency of physician visits, continuity of
care, physician specialty, and geographic region. Reasons for admission that were not amenable to outpatient care,
including appendicitis and hip fracture, were not affected by socioeconomic status. Even when diabetic patients
have access to health care, lower socioeconomic status is associated with increased number of acute visits for
causes that might be avoided by optimal ambulatory care (90).
Chapter 14 / Type 2 Diabetes and Concomitant Illness 207
SPECIFIC INTERCURRENT CONDITIONS IN THE AMBULATORY SETTING
Diabetes is associated with higher risk for many illnesses. In some cases, this risk may be related to glycemic
control. Although hyperglycemia may increase the likelihood of illness, the illness itself may also lead to
hyperglycemia. Perhaps causality can be inferred by measuring HbA1c. In addition, there is evidence that many
illnesses have worse outcomes in the presence of diabetes and this finding may also be related to glycemic control.
There is increasing data that establishing normoglycemia will improve outcomes, particularly in the intensive care
unit, but this has not yet been vigorously studied in outpatients. In the outpatient setting there is little data from
randomized, prospectively conducted studies to demonstrate the directionality of the role of hyperglycemia with
respect to causation of many illnesses. Much of the evidence relies on observational or epidemiological studies.
A discussion of the relationship between diabetes and glycemic control follows, with a discussion of evidence
that may suggest impact upon the incidence and severity of various intercurrent illnesses and how those illnesses
may, in turn, affect glycemic control.
Infection
General Comments on Infection
The problem of infection and diabetes has been comprehensively studied and reviewed (91–98). Progression
of infectious illnesses and, for some specific infectious disorders, the initial occurrence of the infection probably
should be added to the list of diabetes complications (3,92,93,97–172). Several studies have determined that the
incidence of overall infection is increased in patients with diabetes, as shown in Table 3 (96–98). A prospective
cohort study included 6,712 patients with type 2 diabetes (98). Compared to hypertensive controls, the incidence
of infections and the risk for recurrence was equal to or greater in those with diabetes. Infection with specific
microorganisms such as Klebsiella, Staphylococcus aureus, Salmonella enteritidiis, Candida, and Mycobacterium
tuberculosis, and specific uncommon infections such as endophthalmitis or liver abscess, are strongly associated
with diabetes; these problems have been reviewed elsewhere (93,94,100).
The risk of any infection may be related to glycemic control (Table 4). In the outpatient setting, prospectively
randomized trials for the impact of glycemic control upon specific infections have not been conducted. However,
in a retrospective study, Rayfield and colleagues reviewed the charts of 241 patients with diabetes in an outpatient
setting (92). There were 282 infections documented in 114 patients. There was a significant correlation ( p < 0.001)
between mean plasma glucose and the overall incidence of infection. This was not associated with patient age, type
of therapy, duration of diabetes, or comorbidities. The relationship of hyperglycemia to infection was assumed
to be causal rather than a marker of acute illness because glucose levels were obtained on occasions when no
suspicion of infection existed. A prospective observational matched-pair cohort analysis (97) did not find an
association with HbA1c, although the narrow range of HbA1cs among subjects (median HbA1c 7.4%, range
6.6–8.2%) may have precluded such an analysis. Patients developed 79% more infections overall, but this was a
result of multiple episodes in affected patients rather than an increase in overall risk.
In many instances, patients with diabetes have worse outcomes overall (Table 5). NHANES II (95) examined
533 adults with diabetes and 8,675 without diabetes. Over 12–16 yr, there were 301 deaths related to infection.
Patients with diabetes were at higher risk compared to controls for all-cause and infection-related mortality
(age-adjusted RR 1.9, 95%CI 1.5–2.3 and RR 2.4, 95%CI 1.2–4.7 for women respectively and RR 1.7, 95%CI
1.4–2.1 and RR 1.7, 95%CI 0.8–4.7 for men respectively). In addition, a retrospective Ontario cohort of 513,749
patients with diabetes found an increased relative risk for infectious disease hospitalization (RR1.21, 99% CI
1.20–1.22) (96). In particular, the risk for admission with sepsis, postoperative infections, biliary tree infections,
and peritonitis was increased in the presence of diabetes (96). Furthermore, the risk for admission was greater for a
large number of specific infections that sometimes are treated in the ambulatory setting, including upper respiratory
tract infections, cystitis, pneumonia, cellulitis, enteric infections, otitis externa, mycoses, genital infections, herpes
zoster, viral hepatitis, pyelonephritis, tuberculosis, osteomyelitis, mononucleosis, rectal abscess, and infectious
arthritis (96). There was a significantly increased rate of death attributable to infectious disease (1.0% vs. 0.6%
of age-matched controls). However, applying this data to the outpatient setting may be complicated, as a subset
of patients was obtained from hospital records.
208 Dungan et al.
Table 3
Association of infectious diseases with diabetes or hyperglycemia
Increased risk for developing conditions
Any infection Shah 2003 (96) RR 1.21 (1.20–1.22)
Davis 2005 (97) 75 infections in patients with DM vs. 42 in
controls ( p = 0.0005)
Bacteremia Bryan 1985 (101) 19.4/1000 in DM vs. 9.4/1000 in controls
( p <0.0001)
MacFarlane 1986 (99) DM present in 29.2% of bacteremic patients vs.
10% of general hospital population ( p <0.001)
Pneumococcal bacteremia Thomsen 2004 (102, 103) OR 1.9 (1.4–2.6)
Otitis externa Doroghazi 1981 (105) DM present in 115/129 patients (89%) in literature
search
Shah 2003 (96) RR 1.14 (1.09–1.18)
Invasive fungal sinusitis Blitzer 1980 (104) DM present in 126/179 patients (79%)
Sohail 2001 (106) DM present in 5/9 patients (55.6%)
Parikh 2004 (107) DM present in 10/45 patients (22%)
Hosseini 2005 (108) DM present in 9/10 patients (90%)
Shah 2003 (96) RR 1.38 (1.32–1.44)
Periodontal disease Khader 2006 (113) Plaque index D = 0.218 (0.098–0.33, p = 0.003),
Gingival index D = 0.147 (0.012–0.281, p = 0.331),
Probing pocket depth D = 0.346 (0.194–0.498,
p <0.0001), clinical attachment loss D = 0.612
(0.462–0.761, p <0.001); Plaque index, bleeding
to probing and plaque extent NS
Upper respiratory tract infection Shah 2003 (96) RR 1.18 (1.17–1.19)
Muller 2005 (98) T1DM: adjusted OR 0.95 (0.72–1.26); T2DM:
adjusted OR 1.05 (0.95–1.18)
Pneumonia Shah 2003 (96) RR 1.46 (1.42–1.49)
Muller 2005 (98) T1DM: adjusted OR 1.42 (0.96–2.08); T2DM:
adjusted OR 1.32 (1.13–1.53)
Tuberculosis Shah 2003 (96) RR 1.12 (1.03–1.23)
Enteric infection Shah 2003 (96) RR 1.50 (1.46–1.54)
Viral hepatitis Zein 2005 (129) HCV: 14.5% with DM vs. 7.8% without DM
( p = 0.0008)
Kwon 2005 (128)
HCV: 43.2% with DM vs. HBV: 19.7% with DM
( p <0.00001)
Shah 2003 (96) RR 1.49 (1.39–1.60)
Biliary infections Edinburgh 1958 (130) Emphysematous cholecystitis: 12/50 patients
(24%) with DM
Garcia-Sancho Tellez 1999 (131) Emphysematous cholecystitis: 11/20 patients
(55%) with DM
Shah 2003 (96) RR 1.60 (1.39–1.83)
Peritonitis Shah 2003 (96) RR 1.94 (1.58–2.37)
Chow 2005 (144) Median peritonitis free time 49.0 vs. 82.3 mo in
DM vs. no DM ( p = 0.0019)
UTI Boyko 2002 (134) OR 2.2 (1.6–3.0)
Shah 2003 (96) RR 1.39 (1.36–1.42)
Hu 2004 (137) OR 2.78 (1.78–4.35)
Boyko 2005 (138) RR 1.8 (1.2–2.7)
Muller 2005 (98) T1DM: adjusted OR 1.96 (1.49–2.58); T2DM:
adjusted OR 1.24 (1.10–1.39)
Pyelonephritis Scholes 2005 (139) OR 4.1 (1.6–10.9)
Shah 2003 (96) RR 1.95 (1.78–2.13)
(Continued )
Chapter 14 / Type 2 Diabetes and Concomitant Illness 209
Table 3
(Continued )
Increased risk for developing conditions
Emphysematous pyelonephritis
or cystitis
Wan 1998 (142) 37/38 patients (97%) with DM
Shah 2003 (96) RR 1.95 (1.78–2.13)
GU infection Shah 2003 (96) Males: RR 0.89 (0.86–0.89); Females: RR 1.16
(1.04–1.30)
Dermatophytosis Lugo-Somolinos 1992 (145) Present in 31/100 patients (31%) with DM vs.
33/100 (33%) without DM
Muller 2005 (98) T1DM: adjusted OR 1.34 (0.97–1.84); T2DM:
adjusted OR 1.44 (1.27–1.63)
Romano 2001 (148) 7/171 patients (4.1%) with DM vs. 17/276 ( 6.1%)
without DM
Necrotizing fasciitis Pessa 1985 (150) 8/30 patients (26.7%) with DM
Gozal 1986 (151) 5/13 patients (38.5%) with DM
Nisbet 2002 (153) 20/26 patients (76.9%) with DM
Yeniyol 2004 (155) 18/25 patients (72%) with DM
Korkut 2003 (154) 25/45 patients (55.6%) with DM
Cellulitis Muller 2005 (98) T1DM: adjusted OR 1.59 (1.12–2.24); T2DM:
adjusted OR 1.33 (1.15–1.54)
Shah 2003 (96) RR 1.81 (1.76–1.86)
Foot ulcers Currie 1998 (158) OR 7.6 (6.84–8.92)
Leibovici 1996 (93) 9/132 patients (6.8%) with DM vs. 1/383 (2.6%)
without DM ( p = 0.003)
Walters 1992 (157) OR 2.94 (1.58–5.48)
Osteomyelitis Shah 2003 (96) RR 4.93 ( (3.8–5.06)
Discitis Friedman 2002 (167) 11/29 patients (37.9%) had DM
Faella 2002 (168) 4/17 patients (23.5%) had DM
Mann 2004 (169) 20/26 patients (76.9%) had DM
Septic Arthritis Kaandorp 1995 (170) OR 3.3 (1.1–10.1)
Shah 2003 (96) RR 1.72 (1.42–2.08)
Bacterial Meningitis Huang 2002 (172) 47/122 patients (38%) had DM
Durand 1993 (171) 10/253 patients (4.0%) had DM
Shah 2003 (96) RR 1.50 (1.46–1.54)
Where available, risk ratios are followed by confidence intervals in parentheses. Confidence intervals are 95% confidence intervals
except for Shah et al. (96) which reported 99% confidence intervals. Absolute values are followed by measures of statistical significance
( p-values) in parentheses where available. NS, nonsignificant; RR, relative risk; OR, odds ratio.
One study suggests that worse outcomes may be associated with worse baseline glycemic control (93). Among
132 inpatients (26% of the total population studied), diabetes was not an independent predictor of mortality except
in patients with a glycated hemoglobin (GHb) above the median, 10.3% (OR 3.3, 95% CI 1.8–6.2). Table 6
describes several studies that examined the role of glycemic control in infectious disease occurrence or outcome.
Conversely, infection may affect glycemic control. It is the most common precipitant of diabetic ketoacidosis and
nonketotic hyperosmolar state, and infection is an independent predictor for survival in nonketotic hyperosmolar
state (78–81).
The incidence and outcomes of infection among patients with diabetes may depend on the anatomical site and
the pathogen in question. Selected examples are discussed below.
Invasive Fungal Sinusitis
Invasive fungal sinusitis is associated with diabetes, and commonly presents in patients with poor glycemic
control (106,108). It is unclear whether patients with diabetes have higher morbidity or mortality (104,107). This
may depend in part on index of suspicion and rapidity of diagnosis (107).
210 Dungan et al.
Table 4
Association of infectious diseases with glycemic control
Risk for developing conditions associated with glycemic control
Any infection Rayfield 1982 (92) Mean fasting blood glucose prospectively
correlated with infection occurrence ( p <0.001, r
2
not given)
Davis 2005 (97) A1c 7.1% in patients with infection vs. 7.8%
without infection, p =NS
Otitis externa Doroghazi 1981 (105) 3/15 patients (20%) had worsened glucose control
(increased insulin requirement or new 3–4+
glucosuria)
Invasive fungal sinusitis Hosseini 2005 (108) 4/9 patients (44%) with DM presented with
diabetic ketoacidosis
Sohail 2001 (106) 4/5 patients (80%) with DM presented with
diabetic ketoacidosis
UTI Zhanel 1995 (132) A1c 10.9% in patients with bacteruria vs. 13.3% if
no bacteruria ( p = NS)
Geerlings 2001 (133) T1DM: UTI A1c 8.6% vs. no UTI 8.3% ( p = NS);
T2DM: UTI A1c 8.6% vs. no UTI 8.5% ( p = NS)
Boyko 2002 (134) A1c for DM + UTI 10.3% vs. DM + no UTI
10.0% ( p = NS) Multivariate OR for patients with
DM and A1c > 8.0% 2.7 (1.5–4.9) Multivariate
OR for patients with DM and A1c < 8.0% 2.4
(1.3–4.5)
Boyko 2005 (138) All ranges of A1c (including > 8.5%) NS except
for A1c > 7.9%: incidence ratio 2.7 (1.4–4.7)
Emphysematous
pyelonephritis or cystitis
Wan 1998 (142) Mean glucose for survivors 357.35 vs.
nonsurvivors 472.5 mg/dL
Dermatophytosis Romano 1998, 2001
(147,148)
A1c 8.8% for patients with skin infections vs.
8 1% for controls ( p <0.01); Dermatophytosis or
candidiasis accounted for 81% of total skin
infections
Romano 2001 (148) No association with A1c or glucose
Gupta 2005 (149) Mean A1c over previous 3 yr did not predict
occurrence (data not shown)
Oral candidiasis Hill 1989 (146) OR 13 (2.52–67.19) for A1c > 12%
Bacterial meningitis Durand 1993 (171) 11/47 patients (23%) with DM had diabetic
ketoacidosis or hyperglycemic hyperosmoloar
nonketotic syndrome
Where available, risk ratios are followed by confidence intervals in parentheses. Confidence intervals are 95% confidence intervals
except for Shah et al (295), which reported 99% confidence intervals. Absolute values are followed by measures of statistical significance
( p-values) in parentheses where available. RR, relative risk; OR, odds ratio; NS, nonsignificant.
Periodontitis
There may be a relationship between periodontal disease and diabetes, but there are few prospective trials.
A meta-analysis included 21 observational studies and 2 clinical trials, including 4 that examined type 2 diabetes
and 6 that examined a mixed population of type 1 and type 2 diabetes (113). Patients with diabetes had a higher
severity of gingival and periodontal disease but similar extent of involvement as those without diabetes. The study
could not confirm a significant causative effect of poor glycemic control on severity of disease. Conversely, there
is also evidence that the presence of periodontal disease may affect glycemic control. In a study of 113 Pima
Indians with severe periodontal disease and poorly controlled diabetes, treatment with Doxycycline and topical
antimicrobials was associated with a 0.5% to 0.94% reduction in HbA1c ( p < 0.04) compared to placebo (110).
Complications of dental infections may manifest as deep neck infection. Chen et al performed a retrospective
Chapter 14 / Type 2 Diabetes and Concomitant Illness 211
Table 5
Infectious diseases and diseases complicated by infection for which diabetes may worsen outcomes
Outcomes related to presence of diabetes
Any infection Bertoni 2001 (95) RR 2.0 (1.2–3.2)
Shah 2003 (96) RR 1.92 (1.79–2.05)
Bacteremia Bryan 1985 (101) 6.4/1000 for DM vs. 2.8/1000 for
control ( p< 0.001)
MacFarlane 1986 (99) Mortality in 10/49 patients (20%) with
DM vs. 41/119 (34%) with DM
( p = NS)
Leibovici 1991 (100) Septic shock in 14% patients with DM
vs. 7% without DM ( p = 0.01) but
mortality in 28% with DM, 29%
without ( p = NS)
Thomsen 2004 (102, 103) Mortality rate ratio 0.6 (0.3–1.2)
Invasive fungal sinusitis Blitzer 1980 (104) Mortality in 50/126 patients (60%)
with DM vs. 38/53 (72%) without DM
Parikh 2004 (107) Mortality in 4/10 patients (40%) with
DM vs. 4/35 (11%) without DM
Deep neck infections Chen 2000 (111) Complications in 10/30 patients (33%)
with DM vs. 7/75 (9%) without DM
( p = 0.006) Length of stay 12.7 d
with DM vs. 6.7 d without DM
( p = 0.0001)
Huang 2005 (112) Complication in 19/56 patients (34%)
with DM vs. 11/129 (38%) without
DM ( p <0.0001) Length of stay
19.7 d with DM vs. 10.2 d without
DM ( p< 0.0001)
Endocarditis Bishara 2004 (121) Median Survival 33.13 mo with DM
vs. 79.4 mo without DM ( p = NS);
DM NS on multivariate analysis
Chu 2004 (120) OR 2.48 (2.3–7.7)
Influenza Valdez 1999 (117) OR 4.0 (2.3–7.7)
Pneumonia Fine 1997 (115) OR 1.3 (1.1–1.5)
Valdez 1999 (117) OR 4.0 (2.3–7.7)
Falguera 2005 (118) 18 deaths (17%) with DM vs. 40
deaths (8%) without DM ( p = 0.002)
Houston 1997 (116) OR 1.66 (0.54–5.07)
McAlister 2005 (119) OR 1.0 (0.69–1.45)
Hepatitis Huo 2003 {HBV} (123) 5 yr survival in HBV-related HCC
73% without DM vs. 41% with DM
( p = 0.015); in HCV-related HCC
73% without DM vs. 42% with DM
( p = 0.616) Persistent hepatitis 62% of
39 without DM vs. 39% of 39 with
DM ( p
= 0.012)
Huo 2000 (122) OR of cirrhosis 5.2 d (2.0–13.5)
UTI Horcajada 2003 (136) Length of stay 5.2 d for DM vs. 3.9 d
without DM ( p = 0.006)
Leibovici 1991 (100) Mortality in 35/124 patients (28%)
with DM vs. 146/504 (29%) without
DM ( p = NS)
(Continued )