VASCULAR COMPLICATIONS OF DIABETES - PART 1 ppt
Bạn đang xem bản rút gọn của tài liệu. Xem và tải ngay bản đầy đủ của tài liệu tại đây (308.81 KB, 23 trang )
VASCULAR COMPLICATIONS OF DIABETES
CURRENT ISSUES IN PATHOGENESIS AND TREATMENT
Editor Richard Donnelly
MD, PhD, FRCP, FRACP
Division of Vascular Medicine
University of Nottingham
The Medical School
Derby DE22 3DT
UK
Associate Edward Horton MD
Editor Joslin Diabetes Center
One Joslin Place
Boston MA 02215
USA
VASCULAR COMPLICATIONS OF DIABETES
CURRENT ISSUES IN PATHOGENESIS AND TREATMENT
SECOND EDITION
Editor Richard Donnelly MD, PhD, FRCP, FRACP
Division of Vascular Medicine
University of Nottingham
The Medical School
Derby DE22 3DT
UK
Associate Edward Horton MD
Editor Joslin Diabetes Center
One Joslin Place
Boston MA 02215
USA
Supported by an Educational Grant by Eli Lilly & Co
Answers That Matter.
© 2005 by Blackwell Publishing Ltd
Blackwell Publishing, Inc., 350 Main Street, Malden, Massachusetts 02148-5020, USA
Blackwell Publishing Ltd, 9600 Garsington Road, Oxford OX4 2DQ, UK
Blackwell Publishing Asia Pty Ltd, 550 Swanston Street, Carlton, Victoria 3053, Australia
The right of the Author to be identified as the Author of this Work has been asserted in accordance
with the Copyright, Designs and Patents Act 1988.
All rights reserved. No part of this publication may be reproduced, stored in a retrieval system, or
transmitted, in any form or by any means, electronic, mechanical, photocopying, recording or other-
wise, except as permitted by the UK Copyright, Designs and Patents Act 1988, without the prior per-
mission of the publisher.
First published 2002
Second Edition 2005
Library of Congress Cataloging-in-Publication Data
Vascular complications of diabetes: current issues in pathogenesis and
treatment / edited by Richard Donnelly and Ed Horton 2nd ed.
p. ; cm.
Includes bibliographical references and index.
ISBN-13: 978-1-4051-2785-1 (alk. paper)
ISBN-10: 1-4051-2785-6 (alk. paper)
1. Diabetic angiopathies.
[DNLM: 1. Diabetes Complications. 2. Diabetic Retinopathy etiology.
3. Protein Kinase C adverse effects. 4. Vascular Diseases etiology.
WK 835 V3305 2005] I. Donnelly, Richard, 1960- II. Horton, Edward S.
RC700.D5V375 2005
616.1'3 dc22
2005008488
ISBN-13: 978-1-4051-2785-1
ISBN-10: 1-4051-2785-6
A catalogue record for this title is available from the British Library
Set in Branding Serif and Branding Sans
Design and layout by Designers Collective
Printed and bound in the USA by Walsworth Publishing Co., Marceline, Missouri
Commissioning Editor: Alison Brown
Development Editor: Claire Bonnett
Production Controller: Kate Charman
For further information on Blackwell Publishing, visit our website:
The publisher’s policy is to use permanent paper from mills that operate a sustainable forestry policy,
and which has been manufactured from pulp processed using acid-free and elementary chlorine-free
practices. Furthermore, the publisher ensures that the text paper and cover board used have met
acceptable environmental accreditation standards.
CONTENTS
List of contributors . . . . . . . . . . . . . . . . . . . . . . . . . . . . . . . . . . . . . . . . . . . . . . . . . . . . . . . . .v
Preface . . . . . . . . . . . . . . . . . . . . . . . . . . . . . . . . . . . . . . . . . . . . . . . . . . . . . . . . . . . . . . . . . . . .vi
SECTION I MICRO- AND MACROVASCULAR
COMPLICATIONS OF DIABETES
Chapter 1 The public health impact of the diabetes epidemic . . . . .3
Adrian R. Scott
Chapter 2 Risk factors . . . . . . . . . . . . . . . . . . . . . . . . . . . . . . . . . . . . . . . . . . . . . . . . . .13
Adrian R. Scott
Chapter 3 Diabetic nephropathy . . . . . . . . . . . . . . . . . . . . . . . . . . . . . . . . . . . . . .23
Adrian R. Scott
Chapter 4 Coronary heart disease and diabetes . . . . . . . . . . . . . . . . . . . . . .35
Adrian R. Scott
Chapter 5 Diabetes and cerebrovascular disease . . . . . . . . . . . . . . . . . . . . .45
Adrian R. Scott
Chapter 6 Erectile dysfunction . . . . . . . . . . . . . . . . . . . . . . . . . . . . . . . . . . . . . . . . .51
Adrian R. Scott
Chapter 7 Evidence-based interventions to prevent or retard
vascular complications . . . . . . . . . . . . . . . . . . . . . . . . . . . . . . . . . . . . .59
Adrian R. Scott
SECTION II DIABETIC NEUROPATHIES
Chapter 8 Classification and clinical features of neuropathy . . . . . . . . 79
Rayaz A. Malik
Chapter 9 Pathophysiology of diabetic neuropathy . . . . . . . . . . . . . . . . . .85
Rayaz A. Malik
Chapter 10 Epidemiology and natural history of DPN . . . . . . . . . . . . . . . . .91
Rayaz A. Malik
Chapter 11 Detection/Screening/Assessment . . . . . . . . . . . . . . . . . . . . . . . . . .97
Rayaz A. Malik
Chapter 12 Foot ulceration and Charcot arthropathy . . . . . . . . . . . . . . . . .105
Rayaz A. Malik
iii
CONTENTS
iv
Chapter 13 Treatments options . . . . . . . . . . . . . . . . . . . . . . . . . . . . . . . . . . . . . . . .113
Rayaz A. Malik
Chapter 14 Management guidelines for diabetic peripheral
neuropathy and foot ulceration . . . . . . . . . . . . . . . . . . . . . . . . . . .121
Rayaz A. Malik
SECTION III DIABETIC RETINOPATHY AND ASSOCIATED
OPHTHALMIC DISORDERS
Chapter 15 Diabetic retinopathy: epidemiology and risk factors . . . .129
Hean-Choon Chen
Chapter 16 Classification and diagnosis of diabetic retinopathy . . . . .139
Hean-Choon Chen
Chapter 17 Diabetic maculopathy . . . . . . . . . . . . . . . . . . . . . . . . . . . . . . . . . . . . .151
Hean-Choon Chen
Chapter 18 Proliferative diabetic retinopathy . . . . . . . . . . . . . . . . . . . . . . . . .163
Hean-Choon Chen
Chapter 19 Non-retinal diabetic ocular complications . . . . . . . . . . . . . . . .171
Hean-Choon Chen
SECTION IV MECHANISMS OF HYPERGLYCAEMIA INDUCED
VASCULAR DYSFUNCTION
Chapter 20 Pathophysiology and potential targets for therapeutic
intervention . . . . . . . . . . . . . . . . . . . . . . . . . . . . . . . . . . . . . . . . . . . . . . . .179
Richard Donnelly
Chapter 21 Protein kinase C . . . . . . . . . . . . . . . . . . . . . . . . . . . . . . . . . . . . . . . . . . .189
Richard Donnelly
Chapter 22 Protein kinase C activation and vascular permeability . . .197
Richard Donnelly
Chapter 23 Role of protein kinase C activation in cardiovascular
and renal complications of diabetes . . . . . . . . . . . . . . . . . . . . . .205
Richard Donnelly
Chapter 24 Experimental pharmacology using isoform-selective
protein kinase C inhibitors . . . . . . . . . . . . . . . . . . . . . . . . . . . . . . . .213
Richard Donnelly
Chapter 25 Clinical trials with ruboxistaurin . . . . . . . . . . . . . . . . . . . . . . . . . .221
Richard Donnelly
Index . . . . . . . . . . . . . . . . . . . . . . . . . . . . . . . . . . . . . . . . . . . . . . . . . . . . . . . . . . . . . . . . . . . .226
LIST OF CONTRIBUTORS
v
Hean-Choon Chen FRCS, FRCOpath
Consultant Ophthalmologist
Derbyshire Royal Infirmary
Derby, UK
Richard Donnelly MD, PhD, FRCP, FRACP
Professor of Vascular Medicine
University of Nottingham
and Honorary Consultant Physician
The Medical School
Derby, UK
Rayaz A. Malik MB.ChB, PhD, MRCP
Senior Lecturer and Consultant Physician
Academic Department of Medicine
Manchester Royal Infirmary
Manchester, UK
Adrian R. Scott MD, FRCP
Consultant Physician
Diabetes Centre
Northern General Hospital
Sheffield, UK
Diabetes-related cardiovascular complications often cause premature mortal-
ity, as well as disabilities such as blindness, foot ulceration and amputation.
The health care and social care costs of managing these complications are
enormous, but new treatments, devices and clinical management protocols
are steadily improving the longer term outcomes for people with diabetes.
This second edition has been revised and updated to reflect state of the art
clinical practice. In particular, a new section on diabetic neuropathy covers
important aspects of screening and detection, diagnosis and management.
The book is aimed at healthcare professionals involved in the assessment and
surveillance of patients with diabetes complications, and the section on pro-
tein kinase C (PKC) explains the basis of a major new pathway responsible for
hyperglycaemia-induced vascular injury. Recent clinical trials have suggested
that inhibition of PKC-β is an effective therapeutic intervention for improv-
ing the symptoms and outcomes from diabetes-related complications.
Richard Donnelly
vi
PREFACE
SECTION I
MICRO- AND
MACROVASCULAR
COMPLICATIONS OF
DIABETES
Vascular Complications of Diabetes: Current Issues in Pathogenesis and Treatment, Second Edition
Edited by Richard Donnelly, Edward Horton
Copyright © 2005 by Blackwell Publishing Ltd
CHAPTER 1
THE PUBLIC HEALTH IMPACT OF THE
DIABETES EPIDEMIC
Adrian R. Scott MD, FRCP
3
INTRODUCTION
The 21
st
century will see diabetes emerge as the world’s commonest chronic
disease. Whilst the bulk of this will be type 2 diabetes (90%) the incidence has
been rising in both types.
The direct and indirect costs of diabetes and its complications, plus the
associated reduction in quality and quantity of life, will have considerable
economic consequences. This effect will be most noticeable in developing
countries which are going to see a disproportionate increase in the prevalence
of diabetes over the next few decades. It has been estimated that the world-
wide prevalence of diabetes will double between 1990 and 2010.
Epidemiological studies in the USA have shown that the number of people
with known diabetes has increased from around 1.5 million in 1958 to 10.5 mil-
lion in 1998. Most states in the US report a prevalence of over 8% and this fails
to take into account those people with undiagnosed diabetes. Most screening
studies indicate that at least 50% of people found to have diabetes were silent-
ly undiagnosed for sometime.
THE NATURAL HISTORY OF TYPE 1 DIABETES
Although onset is predominantly in childhood or young adulthood, a signif-
icant proportion will be diagnosed over the age of 30 years. The peak ages for
onset, however, are around puberty and between 4–6 years old. Life expectan-
cy is reduced, though there is some evidence that this is improving.
The British Diabetic Association Cohort study (1972–1993), a prospective
follow-up of insulin-treated patients with diabetes diagnosed under the age of
30, showed increased mortality at all ages. Avoidable metabolic complications
such as hypoglycaemia and diabetic ketoacidosis accounted for most of the
excess mortality among those under 30 years but after 20 years of diabetes the
impact of atherosclerotic macrovascular complications steadily increases. The
prognosis is particularly disturbing for children diagnosed with type 1 dia-
betes under the age of 10 years; previous reports have indicated that 60% were
dead within 40 years of diagnosis. With increasing duration of diabetes, the
prevalence of retinopathy, nephropathy and neuropathy is highest in those
with poor glycaemic control and lowest in those with good control. The
Diabetes Control and Complications Trial (DCCT 1995) established quite
clearly that good glycaemic control in type 1 diabetes can reduce the incidence
and progression of microvascular complications but the risk of a vascular
event increases with duration of diabetes and the presence of nephropathy.
Vascular Complications of Diabetes: Current Issues in Pathogenesis and Treatment, Second Edition
Edited by Richard Donnelly, Edward Horton
Copyright © 2005 by Blackwell Publishing Ltd
SECTION I • MICRO- AND MACROVASCULAR COMPLICATIONS OF DIABETES
4
The DCCT was under-powered, and the patients too young, to be sure if
improved glycaemia reduced the risk of macrovascular complications, how-
ever, the trend was for good control to be associated with a reduction in vas-
cular events.
EPIDEMIOLOGY OF TYPE 1 DIABETES
The worldwide variation in incidence is considerable though the pattern of
presentation is similar. The incidence is showing signs of increasing at all ages
but most noticeably in the under 5s. In under 16s, Northern Europe (Finland,
Scotland, Sweden) has the highest rates with up to 30–35 cases per 100,000 of
the population aged <16 years per year. Japan, China and Korea have rates
that are as low as 0.5–2 cases per 100,000 per year. It is tempting to think that
this is due mainly to genetic differences but there are different incidences in
genetically similar countries such as Norway and Iceland, suggesting that
environmental factors have a very significant influence. Whilst the patho-
physiology of islet cell destruction has been well defined, the trigger for this
process remains uncertain. Despite the relatively sudden onset of symptoms,
family studies have shown there is a long prodromal period of immune acti-
vation. Viruses and cow’s milk protein are currently the main contenders that
may initiate this process in the genetically susceptible.
THE NATURAL HISTORY OF TYPE 2 DIABETES
People with type 2 diabetes often have established complications at the time of
diagnosis. In the UK Prospective Diabetes Study (UKPDS), for example, 36% of
newly diagnosed patients had retinopathy, 12% neuropathy and 2% proteinuria
at recruitment. This may well be an underestimate, because in UKPDS patients
with established vascular disease or retinopathy requiring laser therapy were
excluded. Using prospective studies which have studied the rate of progression
of retinopathy, it is estimated that at diagnosis of type 2 diabetes patients will
likely have had their diabetes for between 8 and 12 years and, prior to diabetes,
impaired glucose tolerance for very much longer. Death from ischaemic heart
disease, stroke or lower extremity ischaemia occurs in over 60% of patients.
EPIDEMIOLOGY OF TYPE 2 DIABETES
Although there is good evidence that type 2 diabetes is a heterogeneous con-
dition with a number of genetic sub-groups, the current view supports the
idea that for the majority of people this is a metabolic disorder in the geneti-
cally susceptible, precipitated by lifestyle changes which have led to a seden-
tary lifestyle and obesity. Essentially it is a failure of adaptation to a new envi-
ronment which has changed in the course of a few generations. Elliot Joslin
CHAPTER 1 • THE PUBLIC HEALTH IMPACT OF THE DIABETES EPIDEMIC
went to study the Pima Indians at the start of the 20
th
century because of their
low prevalence of diabetes. By the end of the century they ranked alongside
the Pacific Micronesians from Nauru for having the highest prevalence of
type 2 diabetes in the world.
The ‘thrifty gene’ hypothesis postulates that humans evolving in a harsh
environment, where famine and high physical activity was the norm, may have
developed fuel efficient systems, which, when faced with limitless supplies of
food and a sedentary lifestyle, leads to the metabolic disturbances now charac-
terized as the Metabolic Syndrome (central obesity, hypertension, hyperlipi-
daemia and glucose intolerance). Underlying this is insulin resistance, which
partly relates to fat distribution – the greater the proportion of intra-abdomi-
nal fat compared to the total, the greater the degree of insulin resistance. The
distribution of fat deposition is genetically determined and there is evidence
that there are ethnic differences in body composition. This may explain insulin
sensitivity studies which, despite matching for age and BMI, demonstrate sig-
nificant differences between ethnic groups. BMI tables have been based on the
weights and heights of white Europeans and recent studies from India and
New Zealand suggest they are not applicable to all ethnic groups. For example,
in Indian populations it is suggested that accumulation of intra-abdominal fat
begins at a BMI of around 23 and this (rather than 25 in white populations)
should be the cut-off between ‘normal’ and ‘overweight’. In part, this may
explain the wide variation in prevalence of type 2 diabetes across the world.
Nauruans and Pimas have already been mentioned, but other high risk groups
include South Indians, Polynesians, Maori of New Zealand, native American
Indians, Mexican Americans and African Americans, all of whom have a high-
er prevalence of diabetes than Whites. This is despite the epidemic of obesity
which affects all ethnic groups in the developed world. Recent work has
demonstrated defective mitochondrial function in the muscles of relatives of
people with type 2 diabetes, though whether this is present in all ethnic groups
has yet to be determined. There is also an inverse relationship with poverty,
but this is insufficient to explain all the population differences in prevalence.
Unlike infections or cancer which are either present or not, the prevalence
of metabolic disturbances depends very much on the definition, which may
change over time. This has certainly been true for the diagnosis of type 2 dia-
betes and the associated metabolic syndrome, where the dilemma has been to
produce a workable definition that could be applied to large groups of people,
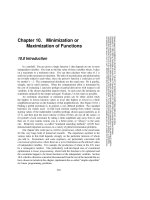
in order to distinguish those at high risk of complications (Fig. 1.1). Recently,
abnormalities of glucose tolerance have been re-defined by the American
Diabetes Association (ADA) and World Health Organisation (WHO) (Table
1.1) and for diabetes the diagnostic cut-off for fasting plasma glucose (FPG) has
been lowered from 7.8 to 7 mmol/l. For epidemiological studies and for routine
5
SECTION I • MICRO- AND MACROVASCULAR COMPLICATIONS OF DIABETES
6
clinical practice the ADA recommended using fasting glucose testing alone, and
the use of the two hour oral glucose tolerance test (OGTT) was not recom-
mended. Subsequent investigations have shown that fasting and two hour glu-
cose criteria do not identify the same group of individuals. The DECODE
study, which combined the results of 13 prevalence studies in nine European
countries, found that there was a distinct sex difference in the prevalence of dia-
betes, impaired fasting glucose (IFG) and impaired glucose tolerance (IGT).
Undiagnosed diabetes and IFG were more common in men than in women at
30–69 years of age. IGT was higher in women than in men and was particular-
ly high in the over 70s. In the USA, the NHANES III study (2000), confirmed
that diagnosed diabetes is most prevalent in the middle-aged (6%) and elderly
(11%) compared to only 1.5% of 18–44 year olds (Fig. 1.1). The incidence is
increasing in childhood and is related to obesity.
Table 1.1 Criteria for the diagnosis of diabetes mellitus (WHO classification 1999).
Note that the American Diabetes Association defines IFG as FPG 5.6–6.9 mmol/l.
People with IFG and IGT are considered to have “pre-diabetes”. An OGTT (75g) may
be indicated in people with IFG if considered at high risk of diabetes.
Criteria for the diagnosis of diabetes mellitus
Plasma venous
glucose concentration
(mmol/l)
Diabetes Mellitus:
Fasting or
> 7.0
2hr post glucose load
> 11.1
Impaired Glucose Tolerance (IGT):
Fasting (if measured) and
< 7.0 and
2hr post glucose load
> 7.8
Impaired Fasting Glycaemia (IFG):
Fasting
> 6.1 and < 7.0
And (if measured)
2hr post glucose load
< 7.8
Normal Fasting Plasma Glucose (FPG) < 5.6
For epidemiological or population screening purposes, the fasting or 2hr value after 75g
oral glucose may be used alone. For clinical purposes, the diagnosis of diabetes should
always be confirmed by repeating the test on another day unless there is unequivocal
hyperglycaemia with acute metabolic decompensation or obvious symptoms.
CHAPTER 1 • THE PUBLIC HEALTH IMPACT OF THE DIABETES EPIDEMIC
THE COST OF DIABETES
There is considerable morbidity associated with diabetes and calculating the
cost can at best be an imprecise estimate. Diabetes is the leading cause of
blindness, end-stage renal failure and lower-extremity amputation. People
with diabetes experience high rates of macrovascular complications at least
twice that of those without diabetes.
In the UK, estimates of the cost of diabetes were first attempted in 1989
using 1984 data and this suggested that 4–5% of all UK healthcare expendi-
ture went on people with diabetes. More recent data suggest the figure is
more like 8%, and that one third of total expenditure on diabetes is spent
on those aged 0 to 24 years. Based on 1999 figures, it was estimated that it
might cost £100 million, in England alone, to implement the findings of the
UKPDS, in terms of intensive treatment of glycaemic control and blood
pressure. The difficulties, however, are that it is difficult to cost episodes in
patients with multiple pathologies and coding has been shown to under-
7
Fig 1.1 Prevalence of diabetes, impaired fasting glucose, and impaired glucose
tolerance in US adults: From the Third National Health and Nutrition Examination
Survey 1988–1994.
Diabetes Care 1998; 21: 518–524.
Impaired fasting glucose
Undiagnosed diabetes
Diagnosed diabetes
25
15
10
5
0
20
Non-
Hispanic
white
Age-standardized per cent
Non-
Hispanic
black
Men
Mexican
American
Non-
Hispanic
white
Non-
Hispanic
black
Women
Mexican
American
SECTION I • MICRO- AND MACROVASCULAR COMPLICATIONS OF DIABETES
8
record secondary diagnoses such as diabetes. Most economic assessments
concentrate on direct costs, though clearly indirect costs, such as time off
work, and intangible costs, such as what might have been, will inflate the
figures considerably.
Surveys from the USA suggest that health care expenditure was over
$11,000 per year per person with diabetes compared to $2,600 for people
without diabetes. Over 60% was due to inpatient hospitalization.
Nevertheless, there are effective strategies for the prevention or delay of
complications associated with diabetes and both the DCCT in type 1 dia-
betes and the UKPDS in type 2 diabetes has demonstrated the effectiveness
of intensification of treatment. An economic model has been used to
analyse the costs of DCCT, enabling calculation of the costs of preventing
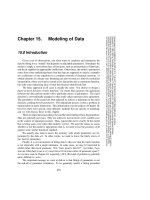
end-stage complications. The model predicted that intensive therapy
would result in approximately 15 years free from the first major complica-
tions of type 1 diabetes and additional years of life free from blindness,
ESRF and lower-extremity amputation (Fig. 1.2). It was projected that
intensive therapy would prolong life by about 5 years and the cost was
approximately $29,000 per year of life gained.
Similar economic modeling has looked at the cost-effectiveness of ‘com-
prehensive’ or intensive care of type 2 diabetes (Table 1.2). Such models are
predicting the likelihood of complications developing in a diabetic popula-
tion. One such model suggests that with standard care (non-intensive) over
a life-time, 19% of subjects would become blind, 17% would develop ESRF
and 16% would require lower-extremity amputation. With intensification
of glucose control these figures could be reduced by up to 75% (but with no
effect on cardiovascular outcome), with increased survival by 1.3 years. The
average lifetime cost was $40,000 more than with standard care. Of course,
these models are limited because they have only looked at the cost and ben-
efits of intensification of glycaemic control and clearly there are many other
interventions available to reduce macrovascular risk.
These somewhat daunting economic assessments of diabetes care can be
viewed from different perspectives. For politicians and public health spe-
cialists, it provides an incentive to invest now in primary prevention of
type 2 diabetes, as treatment costs are unsustainable given the epidemic of
diabetes that is sweeping the developed and developing worlds. For clini-
cians, the challenge is to develop cost-effective strategies and deliver high
quality diabetes services that reach the majority rather than the minority.
Examples of affordable interventions with proven benefits are: compre-
hensive eye-screening; ensuring everyone at high vascular risk receives low
dose aspirin; and annual foot assessments, but these are not made available
to all people with diabetes, even in the more affluent societies. The phar-
maceutical industry must not forget that it remains part of the society in
CHAPTER 1 • THE PUBLIC HEALTH IMPACT OF THE DIABETES EPIDEMIC
9
Fig. 1.2 For people receiving standard care, the model predicts sharply increasing
cumulative incidence of complications, including blindness (a), ESRD (b), and lower-
extremity amputation (LEA) (c) with increasing duration of type 2 diabetes. The
model predicted a substantially lower incidence of these long-term complications
with a program of comprehensive care. Eastman, et al. Diabetes Care 1998; 21
(Suppl 3): C19–C24.
30
Cumulative incidence of blindness (%)
20
10
0
30
Cumulative incidence of ESRD (%)
20
10
0
30
Cumulative incidence of IEA (%)
20
10
0
0 8 16 24 32 40 48 56 64
0 8 16 24 32 40 48 56 64
0 8 16 24 32
Years after diagnosis of diabetes
40 48 56 64
Standard care
Comprehensive care
(a)
(b)
(c)
SECTION I • MICRO- AND MACROVASCULAR COMPLICATIONS OF DIABETES
10
which it operates and has a social responsibility. The challenge is to devel-
op and market safe therapies which generate enough profit to encourage
future shareholders to invest, but not so much that only the wealthy can
afford them.
Table 1.2 Predicted reduction in life time costs of end-stage complications through
comprehensive care for type 2 diabetes. Data are averages per person per life time.
Cost savings are indicated in parentheses.
Predicted reduction in life time costs of end-stage complications
through comprehensive care for type 2 diabetes
Cost elements Standard care Comprehensive care Difference
Present value costs (3% discount rate)
General and diabetes-related
medical care ($) 32,365 58,312 25,947
Eye disease ($) 3,128 1,536 (1,592)
Renal disease ($) 9,437 960 (8,477)
Neuropathy/lower-extremity
amputations ($) 4,381 1,469 (2,912)
New coronary heart disease ($) 13,458 14,414 956
Total costs ($) 62,769 76,922 13,922
QALY (undiscounted) 16.04 18.03 1.9
QALY (discounted 3%) 11.43 12.30 0.87
Life-years (undiscounted) 17.05 18.37 1.32
Incremental cost/QALY gained — — 16,002
CHAPTER 1 • THE PUBLIC HEALTH IMPACT OF THE DIABETES EPIDEMIC
11
CURRENT ISSUES
• Population screening for type 2 diabetes is not widespread and may not
be cost-effective but targeted opportunistic screening of high risk
individuals (such as women with prior gestational diabetes, first degree
relatives, high-risk ethnic groups, the obese) will identify 70% of those with
undiagnosed diabetes. With the increase of obesity in childhood this may
mean screening young people in their teens if they are from a family in
which type 2 diabetes is common.
• Finnish and American randomized studies have demonstrated that
interventions such as weight loss and exercise programs in patients with
impaired glucose tolerance have a role in delaying or preventing the
progression to frank diabetes by over 50%. Metformin used in this context
reduces progression from IGT to diabetes by 30%. Studies of the early use
of insulin sensitizers in IGT are ongoing.
• The epidemic of obesity affects all ages and consequently the emergence
of type 2 diabetes in childhood is increasingly apparent. The prognosis is
likely to be particularly bad in this age group and a high incidence of
nephropathy and early onset cardiovascular disease is to be expected in
South Indians, Maori and other indigenous populations.
• Effective prevention and treatment strategies for obesity are urgently
required. Studies from the UK have shown that simple messages such as
discouraging intake of high sugar carbonated drinks can reduce the
development of excess weight gain and obesity in adolescents.
Scandinavian countries have introduced bans on television advertising to
children for ‘energy-rich/nutrition-poor’ (junk) foods and New Zealand is
trying to introduce a ‘fat-tax’ which would tax snack foods and soft drinks.
FURTHER READING
DCCT research group. Resource utilization and costs of care in the DCCT. Diabetes Care
1995; 18:1468–1478.
Haffner SM, Stern MP, Hazuda HP, Pugh JA, Patterson JK. Hyperinsulinaemia in a popu-
lation at high risk for non-insulin dependent diabetes mellitus. N Engl J Med 1986;
315: 220–224.
Rubin RJ, Altman WM, Mendelson DN. Health care expenditures for people with diabetes
mellitus, 1992. J Clin Endocrinol Metab 1994; 78: 809A–809F.
The Worldwide Burden of Diabetes. Proceedings of a workshop. Phoenix, Arizona, USA.
Diabetes Care 1998; 21: Suppl 3.
Tuomilehto J, Linström J, Eriksson JG et al. Prevention of type 2 diabetes mellitus by
changes in lifestyle among subjects with impaired glucose tolerance. N Engl J Med 2001;
344: 1343–50.
CHAPTER 2
RISK FACTORS
Adrian R. Scott MD, FRCP
13
INTRODUCTION
Prior to the use of glycosylation products such as glycosylated haemoglobin
and fructosamine in the late 1970s, estimates of glucose control relied on self-
reported urine tests, random blood sugars measured in the outpatient setting
and other surrogate measures such as frequency of hypoglycaemia, or meas-
urement of 24 hour urinary glucose excretion. Despite these difficulties, the
association between duration of diabetes, the degree of hyperglycaemia and
the severity of microvascular and neuropathic complications had long been
observed in both type 1 and type 2 diabetes. It was also clear that the rela-
tionship between glycaemic control and macrovascular disease was not
straight forward since people with mild degrees of hyperglycaemia such as
those with impaired glucose tolerance had twice the risk of developing coro-
nary heart disease as those with normal glucose tolerance. In addition, the
association of diabetes (particularly type 2) with multiple vascular risk factors
such as hypertension and dyslipidaemia was apparent but it has taken until
this last decade or so to realize that it is the interaction of these factors that so
alters risk and that each must be viewed in this context, not in isolation. This
chapter looks at the influence of hyperglycaemia and other factors on the
development of microvascular and macrovascular complications.
HYPERGLYCAEMIA
In a prospective personal series of 4,400 patients with diabetes, observed
between 1947 and 1973, Pirart showed that poor glycaemic control was clear-
ly related to a higher prevalence of retinopathy, nephropathy and neuropathy
compared with patients with better control. With the discovery of glycosylat-
ed haemoglobin the association between long-term hyperglycaemia and com-
plications was confirmed. Retinopathy and microalbuminuria are good
markers of microvascular disease and indicative of a generalized vasculopa-
thy. The numerous studies that have looked at the relationship between gly-
caemic control and both the onset and progression of microvascular compli-
cations have produced remarkably consistent results. For example, The Berlin
Retinopathy Study was an observational report on children and adolescents
with type 1 diabetes who were followed between 1977 and 1993. At that time
Berlin was politically and geographically isolated and most young people with
type 1 diabetes were followed up by a single centre. Glycosylated haemoglo-
bin (HbA1
C
) was available from 1980 onwards and urine for microalbumin
was tested from 1987 onwards. Data has been published on 346 patients (190
males) who were followed up to the age of 18–22 years. The rate of onset of
Vascular Complications of Diabetes: Current Issues in Pathogenesis and Treatment, Second Edition
Edited by Richard Donnelly, Edward Horton
Copyright © 2005 by Blackwell Publishing Ltd
SECTION I • MICRO- AND MACROVASCULAR COMPLICATIONS OF DIABETES
14
background retinopathy rose with increasing HbA1
C
from 0.7 events per 100
patient years in the group with a long-term HbA1
C
of < 7% to 7.3 events per
100 patient years when the long-term HbA1
C
was > 11%. The incidence of
retinopathy increased steeply when the HbA1
C
was above 9% (Fig. 2.1) and
was similar to the results seen in the Diabetes Control and Complications
Trial (DCCT).
Surprisingly, glycaemic control did not appear to influence the time to
development of retinopathy, except in those with very poor control
(HbA1
C
>13%). In all other groups the median time to onset of background
diabetic retinopathy was approximately 12 years. Patients with microalbu-
minuria, however, developed retinopathy after a mean of 11.5 years com-
pared to 14.7 years in those with normoalbuminuria. The chance of
remaining free from background retinopathy after 12 years was < 25% in
patients with microalbuminuria compared to 81% in patients without
microalbuminuria.
In the DCCT study 1,441 highly selected patients aged 13–39 years were
randomly assigned to intensive or conventional treatment. Approximately
half of those randomized had been selected as free of retinopathy and with
normal urinary albumin excretion. The other half had mild to moderate
retinopathy and urine albumin excretion <200mg per 24 hours. This group
Fig. 2.1 Rate of development of background retinopathy per 100 patient years in
different classes of HbA1
C
. Berlin Retinopathy Study. Diabetes Care 1994; 17(12):
1390–96.
Rate of background retinopathy
(per 100 patient years)
0
<7 7–8 8–9 9–10
Glycated haemoglobin (%)
10–11 >11
2
4
6
8
10
CHAPTER 2 • RISK FACTORS
was similarly randomized into a secondary intervention arm. The intensive-
ly treated group sustained a 2% drop in HbA1
C
to 7%, but glycaemic control
remained virtually unchanged in the conventional group (approximately 9%
at baseline). There was a 76% adjusted mean risk reduction in the primary
prevention arm for the development of retinopathy. In the secondary pre-
vention arm the estimated risk reduction was 54% with intensive treatment.
The Wisconsin Epidemiological Study of Diabetic Retinopathy
(WESDR) followed a large population of people with diabetes who were liv-
ing in Southern Wisconsin in the US from 1979–1980. There were around
1,200 type 1 diabetic patients originally diagnosed under the age of 30 and
nearly 1,800 older onset patients who were predominately type 2 but around
800 of whom were treated with insulin. Approximately 1,300 of this study
population were followed up at 10 years – the main reason for the dropout
was death before 10 years.
The incidence of retinopathy progression, progression to proliferative
retinopathy and incidence of macula oedema increased from the lowest to
the higher quartile of HbA1
C
. For a given level of HbA1
C
there were few dif-
ferences in incidence or progression of retinopathy among the three groups
(young type 1, older-onset patients on insulin, older-onset patients on
tablets). In addition, there was no evidence of a threshold effect (Figs 2.2 and
2.3). The study group examined whether a change in glycaemic control was
associated with a change in the risk of progression of retinopathy at 10 years.
Using mathematical modelling, it was estimated that a 1.5% decrease in
15
Fig. 2.2 The 10-year incidence of retinopathy by quartile of HbA1
C
at baseline in
younger-onset group taking insulin, the older group taking insulin, and the older-
onset group not taking insulin in WESDR. Diabetes Care 1995; 18: 258–268.
Incidence (%)
100
Younger, P<.0001
Older, insulin P<.005
Older, no insulin P<.0001
80
60
40
20
0
6810
Glycosylated haemoglobin (%)
12 14
SECTION I • MICRO- AND MACROVASCULAR COMPLICATIONS OF DIABETES
16
HbA1
C
from baseline to 4-year follow-up would be expected to lead to a 33%
decrease in the 10-year incidence of proliferative retinopathy in the younger
age group. A similar fall in HbA1
C
produced a 24–40% decrease in incidence
in the older age group. The 10-year incidence of proteinuria and renal fail-
ure was 28.3% and 7.1% in the younger group and 36.5% and 1.8% in the
older onset group. Once again there was a relationship between HbA1
C
and
the incidence of nephropathy (Fig. 2.4).
The WESDR also indicated a relationship between hyperglycaemia and
macrovascular disease. There was an increased risk of amputation in both
younger and older groups and HbA1
C
was associated with increased risk of
death. After correction for age and sex the hazard ratio of dying for the fourth
quartile of HbA1
C
compared to the first quartile of HbA1
C
was 1.9. In the older
group, for example, the 10-year survival in the lowest quartile of HbA1
C
was
62.8% compared with 41.7% of those in the highest quartile (Fig. 2.5).
Interestingly, in WESDR 29% of younger onset patients and 43% of older
onset patients did not manifest proliferative diabetic retinopathy or pro-
teinuria despite being in the third or fourth quartile of hyperglycaemia.
This raises the possibility that some patients are “protected” from compli-
cations or that others are more susceptible. A number of studies of patients
with type 1 diabetes has suggested that as many as 20% of patients do not
Fig. 2.3 The 10-year progression to proliferative diabetic retinopathy by quartile of
HbA1
C
at baseline in the younger-onset group taking insulin, and the older-onset
group not taking insulin, and the older-onset group not taking insulin in the WESDR.
Diabetes Care 1995; 18: 258–268.
PDR (%)
Younger, P<.0001
Older, insulin P<.0005
Older, no insulin P<.0001
60
40
20
0
6810
Glycosylated haemoglobin (%)
12
CHAPTER 2 • RISK FACTORS
17
Fig. 2.4 The incidence of gross proteinuria in people with insulin-dependent
diabetes mellitus by quartile of HbA1
C
. Diabetes Care 1995; 18: 258–268.
5.4–8.5
8.6–10.0
10.1–11.5
11.6–20.8
P<.0001
P<.0006
50
30
20
10
0
40
Younger Older
Incidence (%)
Fig. 2.5 The 10-year incidence of lower extremity amputation by quartile of HbA1
C
at baseline, in the younger and older onset groups participating in the WESDR.
Diabetes Care 1995; 18: 258–268.
5.4–8.5
8.6–10.0
10.1–11.5
11.6–20.8
P<.01
P<.0006
5
10
15
0
Younger Older
Incidence (%)