Handbook of High Temperature Superconductor Electronics Part 2 pps
Bạn đang xem bản rút gọn của tài liệu. Xem và tải ngay bản đầy đủ của tài liệu tại đây (314.36 KB, 27 trang )
1
Introduction to High-Temperature
Superconductors
Neeraj Khare
National Physical Laboratory, New Delhi, India
1.1 INTRODUCTION
The discovery of superconductivity in copper oxide perovskite (1) has opened a
new era of research in superconducting materials. This class of materials not only
show high-temperature superconductivity but also show properties that are differ-
ent from classical superconductors. This offers a great challenge to understanding
the basic phenomenon that causes superconductivity in these materials and to de-
veloping the appropriate preparation methods so that these can be exploited for a
wide range of applications. During the last one and half decades after the discov-
ery of high-T
c
materials, several high-T
c
superconductors have been discovered
which show superconductivity at temperatures higher than liquid-nitrogen tem-
perature (77 K). There has also been great progress in understanding the proper-
ties of these materials, developing different methods of preparation, and realizing
superconducting devices which use these superconductors.
This chapter will give a brief description of the historical developments in
raising the transition temperature (T
c
) of the superconductors, preparation, and
structure of the material. Different properties of the high-T
c
materials such as crit-
ical magnetic field, penetration depth, coherence length, critical current density,
weak link, and so forth are also discussed.
Copyright © 2003 by Marcel Dekker, Inc. All Rights Reserved.
1.2 RAISING THE TRANSITION TEMPERATURE
Superconductivity is the phenomenon in which a material loses its resistance on
cooling below the transition temperature (T
c
). Superconductivity was first discov-
ered in mercury by Onnes (2) in 1911. The temperature at which mercury becomes
superconducting was found to be close to the boiling point of liquid helium (4.2
K). Subsequently, many metals, alloys, and intermetallic compounds were found
to exhibit superconductivity. The highest T
c
known was limited to 23.2 K (3) in
the Nb
3
Ge alloy; however, in September 1986, Bednorz and Muller (1) discovered
superconductivity at 30 K in La–Ba–Cu–O. The phase responsible for supercon-
ductivity was identified to have nominal composition of La
2Ϫx
Ba
x
CuO
4Ϫy
(x ϭ
0.2). The discovery of high-temperature superconductivity in ceramic cuprate ox-
ides by Bednorz and Muller led to unprecedented effort to explore new supercon-
ducting oxide material with higher transition temperatures. The value of T
c
in
La
2Ϫx
Ba
x
CuO
4
was found to increase up to 57 K with the application of pressure
(4). This observation in La
2Ϫx
Ba
x
CuO
4
material raised the hope of attaining even
higher transition temperatures in cuprate oxides. This, indeed, turned out to be true
when Chu and co-workers (5) reported a remarkably high superconductivity tran-
sition temperature (T
c
) of 92 K on replacing La by Y in nominal composition
Y
1.2
Ba
0.8
CuO
4Ϫy
. Later, different groups identified (6–8) that the superconduct-
ing phase responsible for 90 K has the composition YBa
2
Cu
3
O
7Ϫy
.
The discovery of superconductivity above the boiling point of liquid nitro-
gen led to extensive search for new superconducting materials. Superconductivity
at transition temperatures of 105 K in the multiphase sample of the
Bi–Sr–Ca–Cu–O compound was reported by Maeda et al. (9) in 1988. The high-
est T
c
of 110 K was obtained in the Bi–Sr–Ca–Cu–O compound having a compo-
sition Bi
2
Sr
2
Ca
2
Cu
3
O
10
(10,11). Sheng and Hermann (12) substituted the non-
magnetic trivalent Tl for R in R-123, where R is a rare-earth element. By reducing
the reaction time to a few minutes for overcoming the high-volatility problem as-
sociated with Tl
2
O
3
, they detected superconductivity above 90 K in TlBa
2
Cu
3
O
x
samples in November 1987. By partially substituting Ca for Ba, they (13) discov-
ered a T
c
ϳ 120 K in the multiphase sample of Tl–Ba–Ca–Cu–O in February
1988. In September 1992, Putillin et al. (14) found that the HgBa
2
CuO
x
(Hg-1201)
compound with only one CuO
2
layer showed a T
c
of up to 94 K. It was, therefore,
rather natural to speculate that T
c
can increase if more CuO
2
layers are added in
the per unit formula to the compound. In April 1993, Schilling et al. (15) reported
the detection of superconductivity at temperatures up to 133 K in HgBa
2
Ca
2
Cu
3
O
x
. The transition temperature of HgBa
2
Ca
2
Cu
3
O
x
was found to increase
to 153 K with the application of pressure (16).
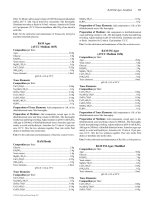
Figure 1.1 depicts the evolution in the transition temperature of supercon-
ductors starting from the discovery of superconductivity in mercury. The slow but
steady progress to search for new superconductors with higher transition temper-
2 Khare
Copyright © 2003 by Marcel Dekker, Inc. All Rights Reserved.
atures continued for decades until superconductivity at 30 K in La–Ba–Cu–O ox-
ide was discovered in 1986. Soon after this, other cuprate oxides such as
Y–Ba–Cu–O, Bi–Sr–Ca–Cu–O, Tl–Ba–Ca–Cu–O with superconductivity above
the liquid-nitrogen temperature were discovered.
Table 1.1 gives a list of some of high-T
c
superconductors with their respec-
tive transition temperature, crystal structure, number of Cu–O layers present in
unit cell, and lattice constants. Transition temperature has been found to increase
as the number of Cu–O layer increases to three in Bi–Sr–Ca–Cu–O,
Tl–Ba–Ca–Cu–O, and Hg–Ba–Ca–Cu–O compounds. In all of the cuprate super-
conductors described so far, the superconductivity is due to hole-charge carriers,
except for Nd
2Ϫx
Ce
x
CuO
4
(T
c
ϳ 20 K), which is an n-type superconductor (17).
The superconductor Ba
0.6
K
0.4
BiO
3
, which does not include Cu, was reported by
Cava et al. (18) in 1988 exhibiting T
c
ϳ 30 K. A homologous series of compounds
(Cu,Cr)Sr
2
Ca
nϪ1
Cu
n
O
y
[Cr12(nϪ1)n] has been synthesized under high pressure.
Introduction to High-Temperature Superconductors 3
FIGURE 1.1 The evolution of the transition temperature (T
c
) subsequent to
the discovery of superconductivity.
Copyright © 2003 by Marcel Dekker, Inc. All Rights Reserved.
In the Cr series, the value of n can be changed from 1 to 9, with a maximum T
c
of
107 K at n ϭ 3. The Pr(Ca)Ba
2
Cu
3
O
y
compound has also been synthesized under
high pressure, showing a transition temperature of 97 K (19).
1.3 CRYSTAL STRUCTURE OF HIGH-T
c
SUPERCONDUCTORS
The structure of a high-T
c
superconductor is closely related to perovskite struc-
ture. The unit cell of perovskite consists of two metal (A, B) atoms and three oxy-
gen atoms, with the general formula given as ABO
3
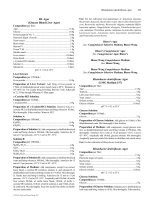
. The ideal perovskite struc-
ture is shown in Fig. 1.2a. Atom A, sitting at the body-centered site, is coordinated
by 12 oxygen atoms. Atom B occupies the corner site and the oxygen atom occu-
pies the edge-centered position.
4 Khare
TABLE 1.1 Transition Temperature (T
c
), Crystal Structure and Lattice Constants of
Some High-T
c
Superconductors
High-T
c
superconductors
T
c
Crystal
Formula Notation (K) n
a
structure Lattice constants (Å)
La
1.6
Ba
0.4
CuO
4
214 30 1 Tetragonal a ϭ 3.79, c ϭ 13.21
La
2Ϫx
Sr
x
CuO
4
214 38 1 Tetragonal a ϭ 3.78, c ϭ 13.23
YBa
2
Cu
3
O
7
123 92 2 Orthorhombic a ϭ 3.82, b ϭ 3.89,
c ϭ 11.68
YBa
2
Cu
4
O
8
124 80 2 Orthorhombic a ϭ 3.84, b ϭ 3.87,
c ϭ 27.23
Y
2
Ba
4
Cu
7
O
14
247 40 2 Orthorhombic a ϭ 3.85, b ϭ 3.87,
c ϭ 50.2
Bi
2
Sr
2
CuO
6
Bi-2201 20 1 Tetragonal a ϭ 5.39, c ϭ 24.6
Bi
2
Sr
2
CaCu
2
O
8
Bi-2212 85 2 Tetragonal a ϭ 5.39, c ϭ 30.6
Bi
2
Sr
2
Ca
2
Cu
3
O
10
Bi-2223 110 3 Tetragonal a ϭ 5.39, c ϭ 37.1
TlBa
2
CuO
5
Tl-1201 25 1 Tetragonal a ϭ 3.74, c ϭ 9.00
TlBa
2
CaCu
2
O
7
Tl-1212 90 2 Tetragonal a ϭ 3.85, c ϭ 12.74
TlBa
2
Ca
2
Cu
3
O
9
Tl-1223 110 3 Tetragonal a ϭ 3.85, c ϭ 15.87
TlBa
2
Ca
3
Cu
4
O
11
Tl-1234 122 4 Tetragonal a ϭ 3.86, c ϭ 19.01
Tl
2
Ba
2
CuO
6
Tl-2201 80 1 Tetragonal a ϭ 3.86, c ϭ 23.22
Tl
2
Ba
2
CaCu
2
O
8
Tl-2212 108 2 Tetragonal a ϭ 3.86, c ϭ 29.39
Tl
2
Ba
2
Ca
2
Cu
3
O
10
Tl-2223 125 3 Tetragonal a ϭ 3.85, c ϭ 35.9
HgBa
2
CuO
4
Hg-1201 94 1 Tetragonal a ϭ 3.87, c ϭ 9.51
HgBa
2
CaCu
2
O
6
Hg-1212 128 2 Tetragonal a ϭ 3.85, c ϭ 12.66
HgBa
2
Ca
2
Cu
3
O
8
Hg-1223 134 3 Tetragonal a ϭ 3.85, c ϭ 15.78
(Nd
2Ϫx
Ce
x
) CuO
4
T 30 1 Tetragonal a ϭ 3.94, c ϭ 12.07
(Nd, CeSr) CuO
4
T* 30 1 Tetragonal a ϭ 3.85, c ϭ 12.48
a
n represents the number of Cu-O planes in the unit cell.
Copyright © 2003 by Marcel Dekker, Inc. All Rights Reserved.
Figure 1.2b shows the unit cell of La
2Ϫx
Ba
x
CuO
4
, which has a tetragonal
symmetry and consists of perovskite layers separated by rock-salt-like layers made
of La (or Ba) and O atoms. This compound is often termed 214 because it has two
La, one Cu, and four O atoms. The 214 compound has only one CuO
2
plane. Look-
ing at the exact center of Fig. 1.2b, the CuO
2
plane appears as one copper atoms sur-
rounded by four oxygen atoms, with one LaO plane above the CuO
2
plane and one
below it. The entire structure is layered. The LaO planes are said to be intercalated.
The CuO
2
plane is termed the conduction plane, which is responsible for supercon-
ductivity. The intercalated LaO planes are called “charge-reservoir layers.” When
the intercalated plane contains mixed valence atoms, electrons are drawn away from
the copper oxide planes, leaving holes to form pairs needed for superconductivity.
The structure of YBa
2
Cu
3
O
7
is shown in Fig. 1.2c. The unit cell of
YBa
2
Cu
3
O
7
consists of three pseudocubic elementary perovskite unit cells (8).
Each perovskite unit cell contains a Y or Ba atom at the center: Ba in the bottom
unit cell, Y in the middle one, and Ba in the top unit cell. Thus, Y and Ba are
stacked in the sequence [Ba–Y–Ba] along the c-axis. All corner sites of the unit
cell are occupied by Cu, which has two different coordinations, Cu(1) and Cu(2),
with respect to oxygen. There are four possible crystallographic sites for oxygen:
O(1), O(2), O(3), and O(4). The coordination polyhedra of Y and Ba with respect
to oxygen are different. The tripling of the perovskite unit cell (ABO
3
) leads to
nine oxygen atoms, whereas YBa
2
Cu
3
O
7
has seven oxygen atoms accommodat-
Introduction to High-Temperature Superconductors 5
F
IGURE 1.2 Structure of (a) perovskite ABO
3
, (b) (La,Ba)
2
CuO
4
, and (c)
YBa
2
Cu
3
O
7
.
Copyright © 2003 by Marcel Dekker, Inc. All Rights Reserved.
ing the deficiency of two oxygen atoms. Thus, the structure of the 90 K phase de-
viates from the ideal perovskite structure and, therefore, is referred to as an oxy-
gen-deficient perovskite structure. Oxygen atoms are missing from the Y plane
(i.e., z ϭ 1/2 site); thus, Y is surrounded by 8 oxygen atoms instead of the 12 if it
had been in ideal perovskite structure. Oxygen atoms at the top and bottom planes
of the YBa
2
Cu
3
O
7
unit cell are missing in the [100] direction, thus giving (Cu–O)
chains in the [010] direction. The Ba atom has a coordination number of 10 oxy-
gen atoms instead of 12 because of the absence of oxygen at the (1/2 0 z) site. The
structure has a stacking of different layers: (CuO)(BaO)(CuO
2
)(Y)(CuO
2
)(BaO)
(CuO). One of the key feature of the unit cell of YBa
2
Cu
3
O
7Ϫ␦
(YBCO) is the
presence of two layers of CuO
2
. The role of the Y plane is to serve as a spacer be-
tween two CuO
2
planes. In YBCO, the Cu–O chains are known to play an impor-
tant role for superconductivity. T
c
maximizes near 92 K when ␦ Ϸ 0.15 and the
structure is orthorhombic. Superconductivity disappears at ␦ Ϸ 0.6, where the
structural transformation of YBCO occurs from orthorhombic to tetragonal.
The crystal structure of Bi-, Tl-, and Hg-based high-T
c
superconductors are
very similar to each other. Like YBCO, the perovskite-type feature and the pres-
ence of CuO
2
layers also exist in these superconductors. However, unlike YBCO,
Cu–O chains are not present in these superconductors. The YBCO superconduc-
tor has an orthorhombic structure, whereas the other high-T
c
superconductors
have a tetragonal structure (see Table 1.1).
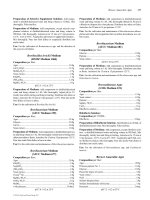
The Bi–Sr–Ca–Cu–O system has three superconducting phases forming a
homologous series as Bi
2
Sr
2
Ca
nϪ1
Cu
n
O
4ϩ2nϩy
(n ϭ 1, 2, and 3). These three
phases are Bi-2201, Bi-2212, and Bi-2223, having transition temperatures of 20,
85, and 110 K, respectively (10,11). The structure of Bi-2201 together with Bi-
2212 and Bi-2223 is shown in Fig. 1.3. All three phases have a tetragonal struc-
ture which consists of two sheared crystallographic unit cells. The unit cell of
these phases has double Bi–O planes which are stacked with a shift of (1/2 1/2 z)
with respect to the origin. The stacking is such that the Bi atom of one plane sits
below the oxygen atom of the next consecutive plane. The Ca atom forms a layer
within the interior of the CuO
2
layers in both Bi-2212 and Bi-2223; there is no Ca
layer in the Bi-2201 phase. The three phases differ with each other in the number
of CuO
2
planes; Bi-2201, Bi-2212, and Bi-2223 phases have one, two, and three
CuO
2
planes, respectively. The c axis of these phases increases with the number
of CuO
2
planes. The lengths of the c axis are 24.6 Å, 30.6 Å, and 37.1 Å respec-
tively for the Bi-2201, Bi-2212, and Bi-2223 phases. The coordination of the Cu
atom is different in the three phases. The Cu atom forms an octahedral coordina-
tion with respect to oxygen atoms in the 2201 phase, whereas in 2212, the Cu atom
is surrounded by five oxygen atoms in a pyramidal arrangement. In the 2223 struc-
ture, Cu has two coordinations with respect to oxygen: one Cu atom is bonded
with four oxygen atoms in square planar configuration and another Cu atom is co-
ordinated with five oxygen atoms in a pyramidal arrangement.
6 Khare
Copyright © 2003 by Marcel Dekker, Inc. All Rights Reserved.
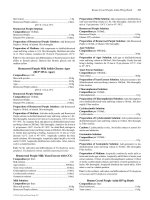
Figure 1.4 shows the unit cells of two series of the Tl–Ba–Ca–Cu–O super-
conductor (20). The first series of the Tl-based superconductor containing one
Tl–O layer has the general formula TlBa
2
Ca
nϪ1
Cu
n
O
2nϩ3
, whereas the second se-
ries containing two Tl–O layers has a formula of Tl
2
Ba
2
Ca
nϪ1
Cu
n
O
2nϩ4
with n ϭ
1, 2, and 3. In the structure of Tl
2
Ba
2
CuO
6
, there is one CuO
2
layer with the stack-
ing sequence (Tl–O) (Tl–O) (Ba–O) (Cu–O) (Ba–O) (Tl–O) (Tl–O). In
Tl
2
Ba
2
CaCu
2
O
8
, there are two Cu–O layers with a Ca layer in between. Similar to
the Tl
2
Ba
2
CuO
6
structure, Tl–O layers are present outside the Ba–O layers. In
Tl
2
Ba
2
Ca
2
Cu
3
O
10
, there are three CuO
2
layers enclosing Ca layers between each
of these. In Tl-based superconductors, T
c
is found to increase with the increase in
CuO
2
layers. However, the value of T
c
decreases after four CuO
2
layers in
TlBa
2
Ca
nϪ1
Cu
n
O
2nϩ3
, and in the Tl
2
Ba
2
Ca
nϪ1
Cu
n
O
2nϩ4
compound, it decreases
after three CuO
2
layers.
The crystal structure of HgBa
2
CuO
4
(Hg-1201), HgBa
2
CaCu
2
O
6
(Hg-
1212), and HgBa
2
Ca
2
Cu
3
O
8
(Hg-1223) is similar to that of Tl-1201, Tl-1212, and
Tl-1223 (Fig. 1.4) with Hg in place of Tl (21). It is noteworthy that the T
c
of the
Hg compound (Hg-1201) containing one CuO
2
layer is much larger as compared
to the one-CuO
2
-layer compound of thallium (Tl-1201). In the Hg-based super-
conductor, T
c
is also found to increase as the CuO
2
layer increases. For Hg-1201,
Hg-1212, and Hg-1223, the values of T
c
are 94, 128, and 134 K respectively, as
shown in Table 1.1. The observation that the T
c
of Hg-1223 increases to 153 K un-
der high pressure (16) indicates that the T
c
of this compound is very sensitive to
the structure of the compound.
Introduction to High-Temperature Superconductors 7
FIGURE 1.3 Unit cells of the Bi
2
Sr
2
Ca
nϪ1
Cu
n
O
x
compound with n ϭ 1, 2, and
3. (Adapted from Ref. 11.)
Copyright © 2003 by Marcel Dekker, Inc. All Rights Reserved.
1.4 PREPARATION OF HIGH-T
c
SUPERCONDUCTORS
High-T
c
superconductors are prepared in the form of bulk, thick films, thin films,
single crystals, wires, and tapes. Fabrication in the form of wires and tapes are re-
quired for high-current applications. On the other hand, thick and thin films are
needed for electronic application. Strict control of the stoichiometry of the com-
position is very much required for preparing high-T
c
superconductors with desir-
able characteristics. Even a small change in oxygen content or a small change in
cation doping level can transform the material from a superconductor to a low-car-
rier-density metal or even to an insulator. The following paragraphs give a brief
8 Khare
FIGURE 1.4 Unit cells of the Tl
1
Ba
2
Ca
nϪ1
Cu
n
O
2nϩ3
compound containing one
Tl–O layer and the Tl
2
Ba
2
Ca
nϪ1
Cu
n
O
2nϩ4
compound containing two Tl–O lay-
ers for n ϭ 1, 2, and 3. (Adapted from Ref. 20.)
Copyright © 2003 by Marcel Dekker, Inc. All Rights Reserved.
description of high-T
c
superconductors in the form of bulk and thick films. The
preparation of high-T
c
thin films is given in more detail in the other chapters of
this book.
The simplest method for preparing high-T
c
superconductors is a solid-state
thermochemical reaction involving mixing, calcination, and sintering. The appro-
priate amounts of precursor powders, usually oxides and carbonates, are mixed
thoroughly using a ball mill. Solution chemistry processes such as coprecipitation,
freeze-drying, and sol–gel methods are alternative ways for preparing a homoge-
nous mixture. These powders are calcined in the temperature range from 800°C to
950°C for several hours. The powders are cooled, reground, and calcined again.
This process is repeated several times to get homogenous material. The powders
are subsequently compacted to pellets and sintered. The sintering environment
such as temperature, annealing time, atmosphere, and cooling rate play a very
important role in getting good high-T
c
superconducting materials. The
(La
1Ϫx
Ba
x
)
2
CuO
4Ϫ␦
high-T
c
superconductor is prepared by heating a mixture of
La
2
O
3
, BaCO
3
, and CuO in a reduced oxygen atmosphere at 900°C. After re-
grinding and reheating the mixtures, the pellet is prepared and sintered at 925°C
for 24 h. The YBa
2
Cu
3
O
7Ϫ␦
compound is prepared by calcination and sintering of
a homogenous mixture of Y
2
O
3
, BaCO
3
, and CuO in the appropriate atomic ratio.
Calcination is done at 900–950°C, whereas sintering is done at 950°C in an oxy-
gen atmosphere. The oxygen stoichiometry in this material is very crucial for ob-
taining a superconducting YBa
2
Cu
3
O
7Ϫ␦
compound. At the time of sintering, the
semiconducting tetragonal YBa
2
Cu
3
O
6
compound is formed, which, on slow
cooling in oxygen atmosphere, turns into superconducting YBa
2
Cu
3
O
7Ϫ␦
. The up-
take and loss of oxygen are reversible in YBa
2
Cu
3
O
7Ϫ␦
. A fully oxidized or-
thorhombic YBa
2
Cu
3
O
7Ϫ␦
sample can be transformed into tetragonal YBa
2
Cu
3
O
6
by heating in a vacuum at temperature above 700°C.
The preparation of Bi-, Tl-, and Hg-based high-T
c
superconductors is
difficult compared to YBCO. Problems in these superconductors arise because
of the existence of three or more phases having a similar layered structure. Thus,
syntactic intergrowth and defects such as stacking faults occur during synthesis
and it becomes difficult to isolate a single superconducting phase. For
Bi–Sr–Ca–Cu–O, it is relatively simple to prepare the Bi-2212 (T
c
ϳ 85 K) phase,
whereas it is very difficult to prepare a single phase of Bi-2223 (T
c
ϳ 110 K). The
Bi-2212 phase appears only after few hours of sintering at 860–870°C, but the
larger fraction of the Bi-2223 phase is formed after a long reaction time of more
than a week at 870°C (11). Although the substitution of Pb in the Bi–Sr–Ca–Cu–O
compound has been found to promote the growth of the high-T
c
phase (22), a long
sintering time is still required.
Toxicity and low vapor pressure of Hg–O and Tl–O make fabrication of Hg-
and Tl-based high-T
c
superconductors much more difficult and one has to follow
special precautions and stringent control on the preparation atmosphere. The Tl-
based superconductor is prepared by thorough mixing of Tl
2
O
3
, BaO, CaO, and
Introduction to High-Temperature Superconductors 9
Copyright © 2003 by Marcel Dekker, Inc. All Rights Reserved.
CuO in appropriate proportions and pressing the powders into a pellet. The pellet
is wrapped in a gold foil and fired at 880°C for 3h in a sealed quartz tube con-
taining 1 atm oxygen to reach superconductivity (20).
For the preparation of a Hg-based high-T
c
superconductor (15), first a pre-
cursor material with the nominal composition Ba
2
CaCu
2
O
5
is obtained from a ho-
mogenous mixture of the respective metal nitrates by sintering at 900°C in oxy-
gen. Dry boxes are used for grinding and mixing of the powders. After regrinding
and mixing with HgO powder, the pressed pellet is sealed in an evacuated quartz
tube. This tube is placed horizontally in a tight steel container and sintered at
800°C for a few hours.
Several techniques such as screen printing (23–27), spin-coating (28) and
spray pyrolysis (29–33) are used in preparing high-T
c
thick films. For the screen
printing or spin-coating method, the first step is to prepare homogenous powders
of high-T
c
materials; this is accomplished by solid-state reaction or by a chemical
route involving mixing, calcination, and sintering of appropriate powders in the
form of oxides or carbonates. After sintering the powders are sieved through a
screen woven from stainless steel or nylon wire. The diameter of the screen wire
and the size of the opening can vary depending on the process requirement. The
opening size is usually given in terms of a standard mesh number that varies from
100 to 400. The fine sieved powders are converted into thick paste by mixing with
an organic solvent such as propylene glycol, octyl alcohol, heptyl alcohol, tri-
ethanolamine, or cyclohexagonal. In the screen-printing technique, thick paste is
used for printing the substrate through the mesh screen and dried at an appropri-
ate temperature. In the spin-coating method, one drop of the paste is put on the
substrate and the substrate is spun to get a uniform coating of the material. The re-
sultant films are fired at a suitable annealing temperature. In general, single-crys-
tal and polycrystalline substrates of magnesium oxide (MgO), strontium titnate
(SrTiO
3
), lanthanum aluminate (LaAlO
3
), yattria-stabilized zirconia (YSZ), and
aluminum oxide (Al
2
O
3
) are used for the high-T
c
thick-film preparation.
For YBCO thick films, the sintering temperature is kept between 940°C and
970°C followed by slow cooling in an oxygen atmosphere (23). In order to achieve
YBCO films with a larger grain size and higher current density, the firing temper-
ature is increased to 1000°C (24). Bi-2212 high-T
c
films are prepared by firing the
films at 880–885°C. It has been found that partial melting and quenching of the Bi-
2212 films from 885°C to room temperature leads to a T
c
as high as 96 K (25). For
high-T
c
films with a Bi-2223 phase, the films are fired at ϳ880°C for a few min-
utes and then annealed at 864°C for a duration of 70–80 h (26). The preparation of
Tl–Ba–Ca–Cu–O thick films requires a two-step process (27). In the first step, a
film of Ba–Ca–Cu–O is prepared, and in the second step, this precursor film is
heated in Tl
2
O
3
vapor followed by slow cooling to room temperature.
Spray pyrolysis is another simple and inexpensive technique for preparing
high-T
c
films (30–33). For YBCO film, an aqueous solution for the spray is pre-
10 Khare
Copyright © 2003 by Marcel Dekker, Inc. All Rights Reserved.
pared by dissolving Y(NO
3
)и6H
2
O, Ba(NO
3
), and Cu(NO
3
)и3H
2
O in triple-dis-
tilled water in a 1 : 2 : 3 stoichiometric ratio (29). The solution is sprayed on a sin-
gle-crystal YSZ or SrTiO
3
substrate through a glass nozzle using oxygen for few
minutes and then slowly cooled to room temperature. The starting solution for de-
positing Bi-2212 film is prepared by mixing aqueous solution of Bi
2
O
3
, SrCO
3
,
CaCO
3
, and CuO in dilute nitric acid (30). A two-step process is used for prepar-
ing Tl- and Hg-based high-T
c
films by the spray pyrolysis technique (31–33). The
first step involves preparation of Ba–Ca–Cu–O precursor films by spraying an
aqueous solution of Ba, Ca, and Cu nitrates on a single-crystal substrate. In the
second step, Tl or Hg is incorporated in the precursor films by annealing the film
in a controlled Tl–O or Hg–O vapor atmosphere.
Different techniques such as sputtering, evaporation, molecular beam epi-
taxy, laser ablation, chemical vapor deposition, and so forth have been used suc-
cessfully to prepare thin films of high-T
c
superconductors. A detailed account of
these techniques is given in Chapter 2. Most of these techniques work in a vacuum
environment and the oxygen partial pressure near the substrate is controlled to ob-
tain a superconducting film. This can be done during the film deposition (in situ
process) or by postdeposition oxygen annealing. The substrate temperature during
the deposition is a crucial parameter that determines microstructural details such
as texture and the degree of epitaxy of the film. Substrate–film interaction such as
interdiffusion can affect the quality of the films. Thus, it is desirable to develop
processes that allow a low substrate temperature.
1.5 PROPERTIES OF HIGH-TEMPERATURE
SUPERCONDUCTORS
A superconducting state is defined by the transition temperature (T
c
) at which ma-
terial exhibits zero resistance on cooling. Apart from the transition temperature,
other properties characterizing the high-T
c
superconductors are critical magnetic
field, penetration depth, coherence length, critical current density and weak link,
energy gap, and so forth. A brief description of these is presented here.
1.5.1 Anisotropy
As described in Section 1.3, the crystal structure of high-T
c
superconductors is
highly anisotropic. This feature has important implications for both physical and
mechanical properties. In high-T
c
superconductors, electrical currents are carried
by holes induced in the oxygen sites of the CuO
2
sheets. The electrical conduction
is highly anisotropic, with a much higher conductivity parallel to the CuO
2
plane
than in the perpendicular direction. Other superconductivity properties such as co-
herence length (), penetration depth (), and energy gap (⌬) are also anisotropic.
The mechanical properties of high-T
c
materials are also very anisotropic. For ex-
Introduction to High-Temperature Superconductors 11
Copyright © 2003 by Marcel Dekker, Inc. All Rights Reserved.
ample, in YBCO, upon cooling, the lattice contracts far more along a-b planes
than along c axis. Torque magnetometry measurements have been made for sev-
eral high-T
c
superconductors for studying anisotropy (34,35). For Tl-2212, an
anisotropy of ϳ10
5
is found for the ratio of the mass along the c axis to that of a-
b plane. A similar large ratio is obtained for the Bi-2212 compound. In Y-123, the
value of this ratio is found to be ϳ25, which is much smaller compared to Bi and
Tl compounds. The anisotropy factor of a high-T
c
superconductor at the optimally
doped composition is related to the interlayer spacing between CuO
2
layers in the
unit cell. It has been also noted that increasing carrier doping or substituting ions
on the blocking layer for certain other ions such as Pb in Bi-2212 reduces
anisotropy without changing the interlayer spacing significantly.
1.5.2 Critical Magnetic Field
The abrupt transition from the normal to superconducting state occurs at a bound-
ary defined not only by the transition temperature (T
c
) but also by the magnetic
field strength. There is a critical value of magnetic field, H
c
, above which the su-
perconductivity is destroyed. If a paramagnetic material is placed in a magnetic
field, then the magnetic lines of force penetrate through the material. However,
when the same material is made superconducting by cooling to a low temperature
below T
c
, then the magnetic lines of force are completely expelled from the inte-
rior of the material. This effect is called the Meissner effect. Based on the Meiss-
ner effect, the superconducting materials are classified as type I and type II su-
perconductors. If there is a sharp transition from the superconducting state to the
normal state, then this type of material is called a type I superconductor. This kind
of behavior is shown, in general, by pure metals. In type II superconductors, there
are two values of the critical field: the lower critical field, H
c1
, and the upper crit-
ical field, H
c2
. For H Ͻ H
c1
, the field is completely expelled from the supercon-
ductor. However, for H Ͼ H
c1
, the magnetic field penetrates the material slowly
and continues up to H
c2
, beyond which the material transforms completely from
the superconducting state to the normal state. The state between H
c1
and H
c2
is
called the vortex or mixed state. Figure 1.5a shows the H–T phase diagram for
conventional low-T
c
superconductors. At low fields, there is Meissner state, and
at high fields, vortices enter the material and form a vortex lattice. Superconduc-
tivity is completely destroyed at H
c2
, for which the density of vortices is such that
the normal cores fill the entire material. For low-T
c
superconductors, this behav-
ior is exhibited, in general, by alloys and compounds. On the other hand, all high-
T
c
superconductors behave as type II superconductors. For high-T
c
superconduc-
tors, the value of H
c1
(0) is low (ϳ100 Oe), whereas the value of H
c2
(0) is quite
high (about few hundred tesla). The value of the critical field is anisotropic
for these materials. For a YBCO single crystal, values of H
c1
(0) in the direction
parallel to the c axis and in the a-b plane are estimated as 850 and 250 Oe,
12 Khare
Copyright © 2003 by Marcel Dekker, Inc. All Rights Reserved.
respectively (36), whereas the value of H
c2
(0) is estimated to be 670 T and 120 T
in the a-b plane and along the c axis, respectively (37).
Cuprate high-T
c
superconductors display a complex H–T phase diagram
(Fig. 1.5b) due to their high-T
c
, short coherence length, layered structure and
anisotropy (38). Apart from H
c1
and H
c2
, there are irreversibility (H
i
) and melting
(H
m
) lines. The melting line separates a vortex lattice and a vortex liquid state. The
irreversibility line occurs in the vicinity of the melting line. This line provides a
boundary between the reversible and irreversible magnetic behavior of a super-
conductor.
The structure of the vortex line in high-T
c
superconductors is different from
the conventional type II superconductors. The individual two-dimensional “pan-
cake” vortices on neighboring layers couple to form three-dimensional vortex
Introduction to High-Temperature Superconductors 13
FIGURE 1.5 H–T phase diagram of (a) low-T
c
type II superconductors and (b)
high-T
c
superconductor.
Copyright © 2003 by Marcel Dekker, Inc. All Rights Reserved.
lines. A weakness of attractive interaction between the “pancakes” from different
layers results in a strong reduction of the shear modulus of the vortex lattice along
the layers as well as a strong influence from thermal fluctuations. The phase dia-
gram of such flexible vortices in the presence of thermal fluctuations and pinning
is a topic of intense study. A better understanding of the dynamics of the vortices
will help to increase the transport critical current density in the material and also
to control the flux noise for electronic applications.
1.5.3 Penetration Depth
Below H
c1
, the external magnetic field is excluded from the bulk of a supercon-
ducting material by a persistent supercurrent in the surface region, which induces
a field that exactly matches the applied field. The depth of this surface is called the
penetration depth () and the external field penetrates the superconductor in an
exponentially decreasing manner. To be more precise, penetration depth is the dis-
tance over which an applied magnetic field decays to 1/e of its value at the sur-
face. For an isotropic superconductor, the lower critical field (H
c1
) is related to the
penetration depth by
H
c1
Ϸ
ᎏ
⌽
2
0
ᎏ
(1)
where ⌽
0
is the flux quantum. The value of the penetration depth can be obtained
from magnetization of the thin superconducting crystal, muon spin rotation, ki-
netic inductance, or microwave measurements. Anisotropy in can be estimated
from flux decoration and magnetic torque experiments. For high-T
c
superconduc-
tors, the penetration depth along the c axis is different than that along the a-b
plane. For the YBCO single crystal, the value of ab(T → 0) is obtained as 1400
Å (39). There has been much interest in studying the temperature dependence of
because it is expected to provide information about the symmetry of the order
parameter of high-T
c
superconductors. The two-fluid model describes the temper-
ature dependence as
(T) ϭ(0)
΄
1 Ϫ
ᎏ
T
T
c
ᎏ
4
΅
Ϫ1/2
(2)
For a weak coupling BCS superconductor, the ⌬ [ϭ(T) Ϫ(0)] varies expo-
nentially with temperature (40). If there are nodes in the energy gap, then (T)
varies linearly with T (41). The results of the temperature dependence of for
high-T
c
superconductors are discussed in Section 1.5.8.
1.5.4 Coherence Length
One of the important parameters determining the performance of a superconduc-
tor is the coherence length (). It is a measure of the correlation distance of the su-
14 Khare
Copyright © 2003 by Marcel Dekker, Inc. All Rights Reserved.
perconducting charge carriers. Coherence length represents the size of the Cooper
pair. In terms of the Fermi velocity (v
F
) and transition temperature T
c
, coherence
length is given as
ϭ
ᎏ
2
h
2
v
k
F
B
T
c
ᎏ
(3)
where k
B
is the Boltzman constant and h is Planck’s constant. The higher value of
T
c
in copper oxide superconductors is expected to lead to a low value for the co-
herence length. Direct measurement of the coherence length is difficult. However,
the value of the coherence length can be extracted from fluctuation contributions
to the specific heat, susceptibility, or conductivity. The value of the coherence
length can also be obtained via measurement of H
c2
using
H
c2
Ϸ
ᎏ
2
⌽
0
2
ᎏ
(4)
The value of the coherence length is found to be highly anisotropic for high-T
c
ma-
terials. The coherence length parallel to the c axis is typically 2–5 Å, and in the a-
b plane, the value is typically 10–30 Å. Thus, perpendicular to the a-b plane, the
superconducting wave function is essentially confined to the few adjacent unit
cells. In conventional low-T
c
, type I superconductors, the coherence length is
1000 Å, which is several orders of magnitude larger than that in high-T
c
super-
conductors. The low value of the coherence length in high-T
c
superconductors
means that the coherence volume contains only a few Cooper pairs, implying that
the fluctuations may be much larger in the high-T
c
superconductors than in the
conventional superconductors. The low values of the coherence length make these
materials very sensitive to the presence of local defects such as oxygen vacancies,
dislocations, and deviation from the stoichiometry.
1.5.5 Flux Quantization
In the classical low-T
c
superconductors, magnetic flux (⌽) trapped in a closed su-
perconducting ring is always an integral multiple of a flux quantum, ⌽
0
:
⌽ϭn⌽
0
(5)
where n is an integer, ⌽
0
ϭ h/2e ϭ 2 ϫ 10
Ϫ7
G/cm
2
, h is Planck’s constant, and
e is the electronic charge; the factor 2 in the denominator shows that the super-
conducting ground state is composed of paired electrons.
Soon after the discovery of light-T
c
superconductors, various experiments
were performed to find out if the superconducting state in high-T
c
superconduc-
tors consisted of paired electrons or of something else. One way to find out is by
measuring a trapped flux in the high-T
c
superconducting ring. Gough and co-
workers (42) performed an experiment to measure the flux through a sintered
Introduction to High-Temperature Superconductors 15
Copyright © 2003 by Marcel Dekker, Inc. All Rights Reserved.
YBCO ring using a weakly coupled superconducting quantum interference device
(SQUID) magnetometer. A small source of noise was applied to induce flux
jumps. The quantized nature of the flux passing in and out of the ring was clearly
observed in the experiment, as shown in Figure 1.6. The value of flux quantum
was obtained as ⌽
0
ϭ (0.97 Ϯ 0.04)h/2e. In another experiment, while studying
flux line arrangement in YBCO single crystals through the magnetic decoration
technique, Gammel et al. (43) found the value of flux quantum as h/2e, which is
similar to that obtained by Gough et al. (42). These observations of flux quantiza-
tion in high-T
c
superconductor clearly indicate that the paired electrons are
responsible for the superconducting state.
1.5.6 Critical Current Density and Weak Links
Similar to the transition temperature (T
c
) and the critical magnetic field (H
c
), the
critical current density (J
c
) is another important parameter which determines the
boundary between superconducting and normal states. Following the discovery of
high-T
c
superconductors, it was found that the critical current density in bulk high-
T
c
materials is remarkably small (ϳ10–100 A/cm
2
) at 77 K and it is strongly de-
pendent on the preparation condition. Very soon, it was realized that natural grain
boundaries behaving as Josephson weak links (44–46) are responsible for the low
value of J
c
in high-T
c
superconductors. Weak links are essentially localized re-
gions in the superconductor where various superconducting properties are de-
graded. The role of weak links in J
c
is quite different in high-T
c
superconductors
as compared to low-T
c
superconductors. In conventional low-T
c
superconductors,
the defect such as grain boundaries increases the pinning and, therefore, enhances
the J
c
. On the other hand, the grain-boundary weak links in polycrystalline high-
T
c
superconductors limit the critical current density.
In epitaxial films, where grain boundaries are completely absent, the J
c
value is found to be as large as 10
6
A/cm
2
at 77 K (47). The weak-link nature of
the grain boundaries was more clearly established by growing YBCO high-T
c
epi-
16 Khare
FIGURE 1.6 Flux jumps as a function of time when the YBCO ring at 4.2 K was
exposed to a local source of electromagnetic noise, causing the ring to jump
between quantized flux states. (Adapted from ref. 42.)
Copyright © 2003 by Marcel Dekker, Inc. All Rights Reserved.
taxial films on a SrTiO
3
bicrystal substrate (48). The bicrystal substrates are fab-
ricated by fusing two single-crystal substrates. When high-T
c
film is grown epi-
taxially on the bicrystal substrate, a single grain boundary is realized. It has been
demonstrated that grain boundaries are, indeed, weak links, which are Josephson
coupled. It has also been found that the critical current across the grain boundary
is a function of misorientation angle between the two crystal (48). A 45° misori-
entation angle formed by rotation about the c axis can reduce the critical current
density by four orders of magnitude from that of the best films. The understand-
ing of the weak-link nature of grain boundary in high-T
c
superconductors has ne-
cessitated the development of single-crystal film technology for electronics appli-
cation. Artificial weak links can be created in an epitaxial high-T
c
film using
bicrystal substrate, edge junction, and so forth. The details of the fabrication and
properties of these artificially prepared weak links in high-T
c
superconductors will
be dealt in more detail in other chapters of this volume.
The weak-link nature of the grain boundaries in high-T
c
superconductors
makes processing of the wires more complicated. The grains have to be aligned
such that the c axis is parallel and the spread of nearest-neighbor orientation is
preferably less than 10° to obtain acceptably high current densities in finite mag-
netic fields. This has been accomplished by following special techniques in wire
preparation (49). For bulk applications where different topological shapes such as
rodes, sheets, blocks, and cylinders are required, the melt processing technique
(50) is used, which minimizes the effect of the weak link and results in samples
with high current densities.
1.5.7 Energy Gap
One of the important features of superconductivity is the existence of a gap in low-
energy excitation. In a superconductor, the external energy (E Ն 2⌬, where ⌬ is
the energy gap) has to be supplied for creating an electron–hole pair close to
the Fermi surface. For a weakly coupled BCS superconductor, the energy gap ⌬ at
0 K is related to T
c
by
ᎏ
2
k
⌬
B
T
(0
c
)
ᎏ
ϭ 3.52 (6)
where k
B
is Boltzman constant.
Tunneling spectroscopy is a widely used technique to study the supercon-
ducting gap. Apart from this, there are many other measurements such as infrared
spectroscopy, photoelectron spectroscopy, inelastic light scattering, nuclear mag-
netic resonance (NMR), nuclear quadrople resonance (NQR), and so forth, which
also provide information on the magnitude and the temperature dependence of en-
ergy gap. Several approaches have been applied to perform tunneling measure-
ments in high-T
c
superconductors, such as point-contact tunneling, break junction
tunneling, and planar junction tunneling.
Introduction to High-Temperature Superconductors 17
Copyright © 2003 by Marcel Dekker, Inc. All Rights Reserved.
For high-T
c
superconductors, a higher value of the energy gap-to-T
c
ratio is
observed as compared to the weakly coupled BCS superconductor. Anisotropy in
the gap value along the c axis and in the a-b plane is also noticed. For YBCO, the
energy gap-to-T
c
ratio [2⌬(0)/k
B
T
c
] has been found to be 3.5 for tunneling per-
pendicular to the Cu–O plane and a value of ϳ6 has been found for tunneling in
the Cu–O plane (51). A similarly higher value of the energy gap-to-T
c
ratio is
also observed for tunneling in the Cu–O plane in Bi–Sr–Ca–Cu–O (52–54),
Tl–Ba–Ca–Cu–O (55,56), and Hg–Ba–Ca–Cu–O (57) superconductors. How-
ever, Nd–Ce–Cu–O and Ba–K–Bi–O showed smaller values of this ratio (ϳ3.9)
(58). Table 1.2 shows values of the energy gap-to-T
c
ratio [2⌬(0)/k
B
T
c
] for some
of high-T
c
superconductors. Angle-resolved photoelectron spectroscopy has been
used to investigate the energy gap in different k directions in Bi-2212, and an
anisotropy of the gap value in the a-b plane was noted (59), which indicates the
possibility of the existence of nodes in the energy gap. Low-temperature scanning
tunneling microscopy in Hg-1201 showed the presence of different gaps to dif-
ferent crystallographic faces, implying a non-BCS electron–electron pairing
mechanism (60).
Nuclear magnetic resonance and photoemission measurements in under-
doped high-T
c
cuprates indicated the presence of a gap in the spin excitation spec-
trum. This pseudogap opening occurs below to a characteristic temperature T*,
well above the T
c
. This spin gap is not found in optimally doped material. The ex-
istence of the spin gap in underdoped samples is found to be a fundamental fea-
ture of high-T
c
superconductors, and two-dimensional charge dynamics, reduced
Drude spectral weight results from the spin gap (61). The existence of the pseu-
dogap also implies that there must be some developing electronic order. However,
the real importance of the existence of the pseudogap and its relation with super-
conducting gap has not yet properly understood.
18 Khare
TABLE 1.2 Values of Energy Gap-to-Transition Temperature Ratio (2⌬/k
B
T
c
)
for Some High-T
c
Superconductors
High-T
c
superconductors T
c
(K) ⌬ (mV) 2⌬/k
B
T
c
Ref.
YBa
2
Cu
3
O
7Ϫ␦
85 20 6 51
Bi
2
Sr
2
CaCu
2
O
8ϩ␦
62 20 7.5 53
Bi
1,7
Pb
0,3
Sr
2
CaCu
2
O
x
96 26 6.3 54
Tl
2
Ba
2
CuO
6
86 25 6.7 55
Tl
2
Ba
2
Ca
2
Cu
3
O
x
114 30 6.1 56
HgBa
2
Ca
2
Cu
3
O
8ϩ␦
132 48 8.5 57
(Nd
2Ϫx
Ce
x
)CuO
4Ϫy
22 3.7 3.9 58
Ba
1Ϫx
K
x
BiO
3
24.5 4.6 3.9 58
Copyright © 2003 by Marcel Dekker, Inc. All Rights Reserved.
1.5.8 Symmetry of the Order Parameter
Flux quantization measurements (42) and observation of the ac–Josephson effect
(44,45,62) in high-T
c
materials have established that the pairing is formed in the
condensed state of superconductors. However, the nature of the pairing still re-
mains to be understood. An important step toward understanding the coupling
mechanism is to know the symmetry of superconducting order parameter.
The order parameter of a superconductor is described by the wave function
of a Cooper pair. It is given as
(r
1
Ϫ r
2
) ϭ
∑
k
g(k) exp[ik(r
1
Ϫ r
2
)] (7)
where r
1
and r
2
are position coordinates of the two electrons and g(k) is the Fourier
transform of the pair amplitude and it is proportional to the energy gap ⌬
k
.
Figure 1.7 shows the variation of the energy gap function corresponding to
isotropic s, anisotropic s, d
x2Ϫy2
, and extended s-wave symmetry of the order pa-
rameter in the momentum space. The thick line represents the Fermi surface and
the thin line shows the variation of gap function. The distance from the Fermi sur-
face gives the amplitude: a positive value for a line lying outside the Fermi sur-
face and a negative value inside the Fermi surface. The zero crossing points are
called nodes. The gap surfaces are represented by the dashed line in Figure 1.7.
Introduction to High-Temperature Superconductors 19
FIGURE 1.7 Variation of gap function in the momentum space for isotropic s,
anisotropic s, d
x2Ϫy 2
, and extended s-wave symmetry of the order parameter.
The Fermi surface is represented by thick lines and the variation of the gap
function is shown by thin lines. The gap nodes surfaces are represented by
the dashed line.
Copyright © 2003 by Marcel Dekker, Inc. All Rights Reserved.
For isotropic s-wave symmetry, ⌬
k
is constant along all directions of k. In
the case of anisotropic s-wave symmetry, ⌬
k
does not remain constant. For d
x2Ϫy2
symmetry, the gap function ⌬
k
varies as k
x2
Ϫ k
y2
which passes through zero
along the |k
x
| ϭ |k
y
| directions. The corresponding real-space-pair wave function
of the d wave has a x
2
Ϫ y
2
spatial symmetry with nodes and sign change upon ro-
tation of 90°. This symmetry function can also be written r
2
cos 2. In the case of
extended s-wave symmetry, the variation of gap function is expressed as ⌬
k
Ϸ [cos(k
x
a) ϩ cos(k
y
a)]. It is evident from Figure 1.7 that for extended s-wave
symmetry, the variation of gap function over a 2 rotation in the momentum space
exhibits eight nodes.
The order parameter has a magnitude and a phase. The magnitude of the or-
der parameter for isotropic s-wave symmetry remains constant, whereas for the
other three symmetries, it is different along different directions of k. The sign of
the phase of the order parameter for isotropic and anisotropic s waves remains
same, whereas for d
x2Ϫy2
symmetry and an extended s wave, the sign of the phase
changes. In the case of d
x2Ϫy2
, the sign changes four times, whereas for the ex-
tended s wave, the sign changes eight times over a rotation of 2 in the momen-
tum space.
Knowledge about the underlying symmetry is important in finding out which
class of theory describes these materials. The BCS theory, which assumes phonon-
mediated coupling, favors an order parameter with isotropic s-wave symmetry. An-
other class of theory assumes that exchange of antiferromagnetic spin fluctuation
can provide a pairing mechanism leading to a pairing state with d
x2Ϫy2
symmetry
(63,64). Chakravarty et al. (65) proposed a theoretical model which assumes elec-
tron–phonon interaction as a dominant mechanism and the interlayer tunneling
leading to an anisotropic s-wave symmetry. Various other theoretical models argue
for generalized s-wave symmetry (66) or for order-parameter symmetry to be a
complex mixture of s and d waves (67) or a complex mixture of d
x2Ϫy2
and d
xy
(68).
Several experimental techniques (69,70) such as NMR studies, temperature
dependence of penetration depth, angle-resolved photoemission, Josephson junc-
tion, and SQUID studies have been carried out to understand the symmetry of the
order parameter in high-T
c
superconductors. NMR studies in YBCO which mea-
sure the relaxation rates and Knight shift supports d-wave symmetry (64). A para-
magnetic effect (71) was observed in some Bi-2212 field-cooled samples which
was interpreted in terms of -junction and d-wave symmetry. For s-wave sym-
metry, the penetration depth is expected to vary exponentially with temperature,
whereas for d-wave symmetry, varies linearly with temperature. Earlier mea-
surements of temperature dependence of supported the s wave (39,72), whereas
several others found that (T) is proportional to T (41) or T
2
(73). An angle-re-
solved photoemission experiment of a Bi-2212 single crystal indicated anisotropy
in superconducting gap in the a-b plane (59). The temperature dependence of the
penetration depth and angular-resolved photoemission studies showed anisotropy
20 Khare
Copyright © 2003 by Marcel Dekker, Inc. All Rights Reserved.
in the energy gap. However, the existence of nodes could not be established be-
cause the magnitude of the order parameter is measured in these experiments. In
order to find the existence of nodes, several phase-sensitive experiments based on
the Josephson junction and SQUID have been performed (55,74–88). Experi-
ments based on a specially designed tricrystal geometry have shown the existence
of nodes by demonstrating the observation of spontaneously generated
0
/2 flux
(81–83). The results of a majority of these experiments supported d-wave sym-
metry; however, an unanimous view about the symmetry of the order parameter
has not yet been accepted.
The symmetry of the order parameter may have implications on the practical
applications of high-T
c
superconductors. For example, the d-wave model predicts a
lower limit to the surface resistance and such a lower limit may constrain those ap-
plications seeking to maximize the Q of superconducting microwave circuits. Sim-
ilarly, the presence of nodes may constrain the design of Josephson junction devices.
1.6 CONCLUSION
During the last one and half decades after the discovery of the high-T
c
supercon-
ductor, more than 100 high-T
c
compounds have been made which exhibit super-
conductivity above 23 K. Several of theses have a T
c
higher than the liquid-nitro-
gen temperature. The highest T
c
of 133 K is observed in HgBa
2
Ca
2
Cu
3
O
y
at
ambient pressure. The superconductivity in high-T
c
cuprates is due to the presence
of CuO
2
planes and the T
c
of the material is found to depend on the number of
CuO
2
planes in the unit cell. High-T
c
superconductors are, in several ways, dif-
ferent from low-T
c
superconductors such as short coherence length, large
anisotropy, grain-boundary weak links, and layered structure. A better under-
standing of the grain boundary has enabled one to improve the quality of high-T
c
films and superconducting wires and led to the development of artificial grain
boundaries for electronic applications. High-T
c
superconductors are extreme type
II superconductors. More understanding of the flux dynamics is required, as these
material exhibit a complex H–T phase diagram.
Similar to low-T
c
superconductors, superconductivity in high-T
c
materials
is due to pairing of electrons, but the mechanism of pairing is still not clear. The
energy gap-to-T
c
ratio in several high-T
c
superconductors show a value larger than
the value predicted for weakly coupled BCS superconductors. Anisotropy in the
gap in the a-b plane is also noted. Several studies on the measurement of penetra-
tion depth, NMR, angle-resolved photoemission, Josephson junction, and SQUID
have been performed to explore the symmetry of the order parameter of high-T
c
superconductors. The majority of these studies revealed d-wave symmetry of the
order parameter. The observation of a spin gap in under doped high-T
c
compounds
at temperature much above the T
c
is very interesting; however, its relationship
with the superconducting energy gap needs to be understood.
Introduction to High-Temperature Superconductors 21
Copyright © 2003 by Marcel Dekker, Inc. All Rights Reserved.
REFERENCES
1. JG Bednorz, KA Muller. Possible high-T
c
superconductivity in Ba–La–Cu–O sys-
tem. Z Phys B: Condensed Matter 64:189–193, 1986.
2. HK Onnes. Akad van Wetenschappen (Amsterdam) 14:818, 1911.
3. JR Gavaler. Superconductivity in Nb–Ge films above 22K. Appl Phys Lett 23:480–
482, 1973.
4. CW Chu, PH Hor, RL Meng, L Gao, ZJ Huang. Superconductivity at 52.5 K in the
lanthanum–barium–copper–oxide system. Science 235:567–569, 1987.
5. MK Wu, JR Ashburn, CJ Torng, PH Hor, RL Meng, L Gao, ZJ Huang, YQ Wang,
CW Chu. Superconductivity at 93 K in a new mixed-phase Y–Ba–Cu–O compound
system at ambient pressure. Phys Rev Lett 58:908–910, 1987.
6. RJ Cava, B Batlogg, RB VanDover, DW Murphy, S Sunshine, T Siegrist, JP Re-
meika, EA Rietman, S Zahurak, GP Espinosa. Bulk superconductivity at 91 K in sin-
gle-phase oxygen-deficient perovskite Ba
2
YCu
3
O
9Ϫ␦
. Phys Rev Lett 58:1676–1679,
1987.
7. CNR Rao, P Ganguly, AK Raychaudhuri, RAM Ram, K Sreedhar. Identification of
the phase responsible for high-temperature superconductivity in Y–Ba–Cu oxides.
Nature 326:856–857, 1987.
8. RM Hazen, LW Finger, RJ Angel, CJ Prewitt, NL Ross, HK Mao, CG Hadidiacos,
PH Hor, RL Meng, CW Chu. Crystallographic description of phases in the
Y–Ba–Cu–O superconductor. Phys Rev B 35:7238–7241, 1987.
9. H Maeda, Y Tanaka, M Fukutomi, T Asano. A new high-T
c
oxide superconductor
without a rare earth element. Jpn J Appl Phys 27:L209–L210, 1988.
10. RM Hazen, CT Prewitt, RJ Angel, NL Ross, LW Finger, CG Hadidiacos, DR Veblen,
PJ Henaey, PH Hor, RL Meng, L Gao, J Bechtold, CW Chu. Superconductivity in the
high-T
c
Bi–Ca–Sr–Cu–O system: Phase identification. Phys Rev Lett 60:1174–1177,
1988.
11. JM Tarascon, WR McKinnon, P Barboux, DM Hwang, BG Bagley, LH Greene, GW
Hull, Y LePage, N Stoffel, M Giroud. Preparation structure and properties of the su-
perconducting compound series Bi
2
Sr
2
Ca
nϪ1
Cu
n
O
y
with nϭ1, 2 and 3. Phys Rev B
38:8885–8892, 1988.
12. ZZ Sheng, AM Hermann. Superconductivity in the rare-earth free Tl–Ba–Cu–O sys-
tem above liquid nitrogen temperature. Nature 332:55–58, 1988.
13. ZZ Sheng, AM Hermann, A EI Ali, C Almasan, J Estrada, T Datta, RJ Matson. Su-
perconductivity at 90 K in the Tl–Ba–Cu–O system. Phys Rev Lett 60:937–940,
1988.
14. SN Putillin, EV Antipov, O Chmaissem, M Marezio. Superconductivity at 94 K in
HgBa
2
CuO
4ϩ␦
. Nature 362:226–228, 1993.
15. A Schilling, M Cantoni, JD Guo, HR Ott. Superconductivity above 130 K in the
Hg–Ba–Ca–Cu–O system. Nature 363:56–58, 1993.
16. CW Chu, L Gao, F Chen, ZJ Huang, RL Meng, YY Xue. Superconductivity above
150 K in HgBa
2
Ca
2
Cu
3
O
8ϩ␦
at high pressure. Nature 365:323–325, 1993.
17. Y Tokura, H Takagi, S Uchida. A superconducting copper oxide compound with
electrons as the charge carriers. Nature 337:345–347, 1989.
22 Khare
Copyright © 2003 by Marcel Dekker, Inc. All Rights Reserved.
18. RJ Cava, B Batlogg, JJ Krajewski, R Farrow, LW Rupp, AE White Jr, K Short, T
Kometani. Superconductivity near 30 K without copper Ba
0.6
K
0.4
BiO
3
Perovskite.
Nature 332:814–816, 1988.
19. YS Yao, YF Xiong, D Jin, JW Li, JL Luo, ZX Zhao. The high-pressure synthesis and
superconductivity of Pr
0.5
Ca
0.5
Ba
2
Cu
3
O
z
. Physica C 282–287:49–52, 1997.
20. SSP Parkin, VY Lee, AI Nazzal, R Savoy, R Beyers, SJ LaPlaca.
Tl
1
Ca
nϪ1
Ba
2
Cu
n
O
2nϩ3
(nϭ1,2,3): A new class of crystal structures exhibiting vol-
ume superconductivity at up to Ӎ 110 K. Phys Rev Lett 61:750–753, 1988.
21. SN Putillin, EV Antipov, M Marezio. Superconductivity above 120 K in
HgBa
2
CaCu
2
O
6ϩ␦
. Physica C 212:266–270, 1993.
22. D Shi, MS Boley, JG Chen, M Xu, K Vandervoort, YX Liao, A Zangvil, J Akujieze,
C Segre. Origin of enhanced growth of the 110 K superconducting phase by Pb dop-
ing in the Bi–Sr–Ca–Cu–O system. Appl Phys Lett 55:699–701, 1989.
23. J Tabuchi, K Utsumi. Preparation of superconducting Y–Ba–Cu–O thick films with
preferred c-axis orientation by a screen-printing method. Appl Phys Lett 53:606–608,
1988.
24. A Bailey, G Alvarez, GJ Russell, KNR Taylor. High current capacity textured thick
films of YBCO on YSZ obtained by melt processing. Cryogenics 30:599–602, 1990.
25. N Khare, S Chaudhry, AK Gupta, VS Tomar, VN Ojha. Superconducting thick films
of Bi
2
Sr
2
CaCu
2
O
8ϩx
with zero resistivity at 96 K. Supercond Sci Technol 3:514–516,
1990.
26. S Chaudhry, N Khare, AK Gupta. Growth kinetics of high T
c
phase in
Bi–Sr–Ca–Cu–O thick films. J Mater Res 7:2027–2033, 1992.
27. V Zeng, Z Zhao, Li Zhang, H Chen, Z Qian, D Wu. Preparation of the
T1–Ba–Ca–Cu–O thick film by processing a screen-printed Ba–Ca–Cu–O film in
Tl
2
O
3
vapor. Appl Phys Lett 56:1573–1575, 1990.
28. CE Rice, RB van Dover, GJ Fisanick. Preparation of superconducting thin films of
Ba
2
YCu
3
O
7
by a novel spin-on pyrolysis technique. Appl Phys Lett 51:1842–1844,
1987.
29. A Gupta, G Koren, EA Giess, NR Moore, EJM O’Sullivan, EI Cooper.
Y
1
Ba
2
Cu
3
O
7ϩ␦
thin films grown by a simple spray deposition technique. Appl Phys
Lett 52:163–165, 1988.
30. DK Walia, AK Gupta, GSN Reddy, ND Kataria, N Khare, VN Ojha, VS Tomar.
Growth of oriented superconducting films of Bi–Sr–Ca–CuO by spray pyrolysis tech-
nique. Mod Phys Lett B 4:393–397, 1990.
31. JA DeLuca, MF Garbauskas, RB Bolon, JG McMullen, WE Balz, PL Karas. The syn-
thesis of superconducting Tl–Ca–Ba–Cu-oxide films by the reaction of spray de-
posited Ca–Ba–Cu-oxide precursors with Tl
2
O vapor in a two-zone reactor. J Mater
Res 6:1415–1423, 1991.
32. N Khare, AK Gupta, AK Saxena, KK Verma, ON Srivastava. Studies on the RF
SQUID effect in Tl–Ca–Ba–Cu–O thin films prepared by the spray pyrolysis tech-
nique. Supercond Sci Technol 7:402–406, 1994.
33. N Khare, AK Gupta, HK Singh, ON Srivastava. Rf-SQUID effect in Hg(Tl)–Ba–
Ca–Cu–O high-T
c
thin film up to 121 K. Supercond Sci Technol 11:517– 519, 1998.
Introduction to High-Temperature Superconductors 23
Copyright © 2003 by Marcel Dekker, Inc. All Rights Reserved.
34. VG Kogan. Uniaxial superconducting particle in intermediate magnetic fields. Phys
Rev B 38:7049–7050, 1988.
35. DE Farrell, RG Beck, MF Booth, CJ Allen, ED Bukowski, DM Ginsberg. Supercon-
ducting effective-mass anisotropy in Tl
2
Ba
2
CaCu
2
O
x
. Phys Rev B 42:6758–6761,
1990.
36. DH Wu, S Sridhar. Pinning forces and lower critical fields in YBa
2
Cu
3
O
y
crystals:
Temperature dependence and anisotropy. Phys Rev Lett 65:2074–2077, 1990.
37. U Welp, M Grimsditch, H You, WK Kwok, MM Fang, GW Crabtree, JZ Liu.
The upper critical field of untwinned YBa
2
Cu
3
O
7Ϫ␦
crystals. Physica C 161:1–5,
1989.
38. G Blatter. Vortex matter. Physica C 282–287:19–26, 1997.
39. L Krusin-Elbaum, RL Greene, F Holtzberg, AP Malozemoff, Y Yeshurun. Direct
measurement of the temperature-dependent magnetic penetration depth in
Y–Ba–Cu–O crystals. Phys Rev Lett 62:217–220, 1989.
40. B Muhlschlegel. Die Thermodynamischen Funktionen des Supraleiters. Z Phys 155:
313–327, 1959.
41. WN Hardy, DA Bonn, DC Morgan, R Liang, K Zhang. Precision measurements of
the temperature dependence of in YBa
2
Cu
3
O
6.95
: Strong evidence for nodes in the
gap function. Phys Rev Lett 70:3999–4002, 1993.
42. CE Gough, MS Colclough, EM Forgan, RG Jordan, M Keene, CM Muirhead, AI M
Rae, N Thomas, J S Abell, S Sutton. Flux quantization in a high-T
c
superconductor.
Nature 362:855–857, 1987.
43. PL Gammel, DJ Bishop, GJ Dolan, JR Kwo, CA Murray, LF Scheemeyer, JV
Waszczak. Observation of hexagonally correlated flux quanta in YBa
2
Cu
3
O
7
. Phys
Rev Lett 59:2592–2595, 1987.
44. JT Chen, LE Wenger, CJ McEwan, EM Logothetis. Observation of the reverse ac
Josephson effect in Y–Ba–Cu–O at 240 K. Phys Rev Lett 58:1972–1975, 1987.
45. AK Gupta, SK Agarwal, B Jayaram, A Gupta, AV Narlikar. Observation of inverse
A.C. Josephson effect in bulk Y–Ba–Cu–O possessing high T
c
. Pramana-J Phys
28:L705–L707, 1987.
46. P Chaudhari, J Mannhart, D Dimos, CC Tsuei, J Chi, MM Oprysko, M Scheuermann.
Direct measurement of the superconducting properties of single grain boundaries in
Y
1
Ba
2
Cu
3
O
7Ϫ␦
. Phys Rev Lett 60:1653–1656, 1988.
47. P Chaudhari, RH Koch, RB Laibowitz, TR McGuire, RJ Gambino. Critical-current
measurements in epitaxial films of YBa
2
Cu
3
O
7Ϫx
compound. Phys Rev Lett
58:2684– 2686, 1987.
48. D Dimos, P Chaudhari, J Mannhart. Superconducting transport properties of grain
boundaries in YBa
2
Cu
3
O
7
bicrystals. Phys Rev B 41:4038–4049, 1990.
49. A Otto, LJ Masur, J Gannon, E Podtburg, D Daly, GJ Yurek, AP Malozemoff. Mul-
tifilamentary Bi-2223 composite tapes made by a metallic precursor route. IEEE
Trans Appl Supercond 3:915–922, 1993.
50. M Murakami, M Morita, N Koyama. Magnetization of a YBa
2
Cu
3
O
7
crystal prepared
by the quench and melt growth process. Jpn J Appl Phys 28:L1125–L1127, 1989.
51. JS Tsai, I Takeuchi, J Fujita, S Miura, T Terashima, Y Bando, K Iijima, K Yamamoto.
Tunneling study of clean and oriented Y–Ba–Cu–O and Bi–Sr–Ca–Cu–O surfaces.
Physica C 157:537–550, 1989.
24 Khare
Copyright © 2003 by Marcel Dekker, Inc. All Rights Reserved.
52. M Boekholt, M Hoffmann, G Guntherodt. Detection of an anisotropy of the super-
conducting gap in Bi
2
Sr
2
CaCu
2
O
8ϩ␦
single crystals by Raman and tunneling spec-
troscopy. Physica C 175:127–134, 1991.
53. L Ozyuzer, JF Zasadzinski, C Kendziora, KE Gray. Quasiparticle and Josephson tun-
neling of overdoped Bi
2
Sr
2
CaCu
2
O
8ϩ␦
single crystals. Phys Rev B 61:3629–3640,
2000.
54. Q Huang, JF Zasadzinski, KE Gray, JZ Liu, H Claus. Electron tunneling study of the
normal and superconducting states of Bi
1.7
Pb
0.3
Sr
2
CaCu
2
O
x
. Phys Rev B 40:9366–
9369, 1989.
55. L Ozyuzer, Z Yusof, JF Zasadzinski, L Wei-Ting, DG Hinks, KE Gray. Tunneling
spectroscopy of Tl
2
Ba
2
CuO
6
. Physica C 320:9–20, 1999.
56. I Takechi, JS Tsai, Y Shimakawa, T Manako, Y Kubo. Energy gap of
Tl–Ba–Ca–Cu–O compounds by tunneling. Physica C 158:83–87, 1989.
57. GT Jeong, JI Kye, SH Chun, S Lee, SI Lee, ZG Khim. Energy gap of the high-T
c
su-
perconductor HgBa
2
Ca
2
Cu
3
O
8ϩ␦
determined by point-contact spectroscopy. Phys
Rev B 49:15,416–15,419, 1994.
58. Q Huang, JF Zasadzinski, N Tralshawala, KE Gray, DG Hinks, JL Peng, RL Greene.
Tunnelling evidence for predominantly electron-phonon coupling in superconducting
Ba
1Ϫx
K
x
BiO
3
and Nd
2Ϫx
Ce
x
CuO
4Ϫy
. Nature 347:369–372, 1990.
59. Z-X Shen, DS Dessau, BO Wells, DM King, WE Spicer, AJ Arko, D Marshall, LW
Lombardo, A Kapitulinik, P Dickinson, S Doniach, J DiCarlo, AG Loeser, CH Park.
Anomalously large gap anisotropy in the a-b plane of Bi
2
Sr
2
CaCu
2
O
8ϩ␦
. Phys Rev
Lett 70:1553–1556, 1993.
60. P Jess, U Hubler, HP Lang, HJ Guntherodt, K Luders, EV Antipov. Energy gap dis-
tribution of HgBa
2
CuO
4ϩx
investigated by scanning tunneling microscopy/spec-
troscopy. J Low Temp Phys 105:1243–1248, 1996.
61. S Uchida. Spin gap effects on the c-axis and in-plane charge dynamics of high-T
c
cuprates. Physica C 282–287:12–18, 1997.
62. J Niemeyer, MR Dietrich, C Politis. AC-Josephson effect in YBa
2
Cu
3
O
␦
/PbSn point
contact junctions. Z Phys B: Condensed Matter 67:155–159, 1987.
63. P Monthoux, AV Balatsky, D Pines. Weak-coupling theory of high-temperature su-
perconductivity in the antiferromagnetically correleated copper oxides. Phys Rev B
46:14,803–14,817, 1992.
64. N Bulut, DJ Scalapino. Analysis of NMR data in the superconducting state of
YBa
2
Cu
3
O
7
. Phys Rev Lett 68:706–709, 1992.
65. S Chakravarty, A Sudbo, PW Anderson, S Strong. Interlayer tunneling and gap
anisotropy in high-temperature superconductors. Science 261:337–340, 1993.
66. DJ Scalapino. The case for d
x
2-
y
2 pairing in the cuprate superconductors. Phys Rep
250:329, 1995.
67. G Kotliar. Resonating valence bonds and d-wave superconductivity. Phys Rev B 37:
3664–3666, 1988.
68. DS Rokhsar. Pairing in doped spin liquids: Anyon versus d-wave superconductivity.
Phys Rev Lett 70:493–496, 1993.
69. N Khare. Symmetry of Order Parameter of High-T
c
Superconductors. In: A Narlikar,
ed. Studies of High Temperature Superconductor vol 20 New York: Nova Science
Publishers, 1996, pp 187–215.
Introduction to High-Temperature Superconductors 25
Copyright © 2003 by Marcel Dekker, Inc. All Rights Reserved.