Introduction to ENVIRONMENTAL TOXICOLOGY Impacts of Chemicals Upon Ecological Systems - CHAPTER 6 docx
Bạn đang xem bản rút gọn của tài liệu. Xem và tải ngay bản đầy đủ của tài liệu tại đây (149.5 KB, 21 trang )
CHAPTER
6
Factors Modifying the Activity of Toxicants
Just as there are a large number of pollutants in our environment, so are there
many factors that affect the toxicity of these pollutants. The major factors affecting
pollutant toxicity include physicochemical properties of pollutants, exposure time,
environmental factors, interaction, biological factors, and nutritional factors. The
parameters that modify the toxic action of a compound are examined in this chapter.
PHYSICOCHEMICAL PROPERTIES OF POLLUTANTS
Characteristics such as whether a pollutant is solid, liquid, or gas; whether the
pollutant is soluble in water or in lipid; organic or inorganic material; ionized or
nonionized, etc., can affect the ultimate toxicity of the pollutant. For example, since
membranes are more permeable to a nonionized than an ionized substance, a non-
ionized substance will generally have a higher toxicity than an ionized substance.
One of the most important factors affecting pollutant toxicity is the concentration
of the pollutant in question. Even a generally highly toxic substance may not be
very injurious to a living organism if its concentrations remain very low. On the
other hand, a common pollutant such as carbon monoxide can become extremely
dangerous if its concentrations in the environment are high. As mentioned earlier,
exposure to high levels of pollutants often results in acute effects, while exposure
to low concentrations may result in chronic effects. Once a pollutant gains entry
into a living organism and reaches a certain target site, it may exhibit an action. The
effect of the pollutant, then, is a function of its concentration at the locus of its
action. For this reason, any factors capable of modifying internal concentration of
the chemical agent can alter the toxicity.
TIME AND MODE OF EXPOSURE
Exposure time is another important determinant of toxic effects. Normally, one
can expect that for the same pollutant the longer the exposure time the more
detrimental the effects. Also, continuous exposure is more injurious than intermittent
© 1999 by CRC Press LLC
exposure, with other factors being the same. For example, continuous exposure of
rats to ozone for a sufficient period of time may result in pulmonary edema. But
when the animals were exposed to ozone at the same concentration intermittently,
no pulmonary edema may be observed. The mode of exposure, i.e., continuous or
intermittent, is important in influencing pollutant toxicity because living organisms
often can recover homeostatic balance during an “off” phase of intermittent exposure
than if they are exposed to the same level of toxicant continuously. In addition,
organisms may be able to develop tolerance after an intermittent dose.
ENVIRONMENTAL FACTORS
Environmental factors such as temperature, humidity, and light intensity also
influence the toxicity of pollutants.
Temperature
Numerous effects of temperature changes on living organisms have been reported
in the literature (Krenkel and Parker 1969). Thermal pollution has been a concern
in many industries, particularly with power plants. Thermal pollution is the release
of effluent that is at a higher temperature than the body of water it is released in.
Vast amounts of water are used for cooling purposes by steam-electric power plants.
Cooling water is often discharged at an elevated temperature causing river water
temperatures to be raised to such an extent that the water may be incompatible for
fish life.
Temperature changes in a volume of water affect the amount of dissolved oxygen
(DO). The amount of DO present at saturation in water decreases with increasing
temperature. On the other hand, the rate at which most chemical reactions occur
increases with increased temperatures. Many enzymes have a peak temperature
range. Above and below that range they are much more inefficient at catalyzing
reactions. An elevated temperature leads to faster assimilation of waste and therefore
faster depletion of oxygen. This depletion also adversely affects the ability of fish
and other animals to survive in these heated waters. Additionally, subtle behavior
changes in fish are known to result from temperature changes too small to cause
injury or death.
Temperature also affects the response of vegetation to air pollution. Generally,
plant sensitivity to oxidants increases with increasing temperature up to 30°C.
Soybeans are more sensitive to ozone when grown at 28°C than at 20°C, regardless
of exposure temperature or ozone doses (Dunning et al. 1974). The response of pinto
bean to a 20 and 28°C growth temperature was found to be dependent on both
exposure temperature and ozone dose.
Humidity
Generally, the sensitivity of plants to air pollutants increases as relative humidity
increases. However, the relative humidity differential may have to be greater than
© 1999 by CRC Press LLC
20% before differences are shown. MacLean et al. (1973) found gladioli to be more
sensitive to fluoride as relative humidity increased from 50 to 80%.
Light Intensity
The effect of light intensity on plant response to air pollutants is difficult to
generalize because of several variables involved. For example, light intensity during
growth affects the sensitivity of pinto bean and tobacco to a subsequent ozone
exposure. Sensitivity increased with decreasing light intensities within the range of
900 to 4000 foot-candles (fc) (Dunning and Heck 1973). In contrast, the sensitivity
of pinto bean to PAN (peroxyacyl nitrate), a gaseous pollutant, increased with
increasing light intensity. Plants exposed to pollutants in the dark are generally not
sensitive. At low light intensities, plant response is closely correlated with stomatal
opening. However, since full stomatal opening occurs at about 1000 fc, light intensity
must have an effect on plant response beyond its effect on stomatal opening.
INTERACTION OF POLLUTANTS
Seldom are living organisms exposed to a single pollutant. Instead, they are
exposed to combinations of pollutants simultaneously. In addition, the effect of
pollutants is dependent on many factors including portals of entry, action mode,
metabolism, and others previously described above. Exposure to combinations of
pollutants may lead to manifestation of effects different from those that would be
expected from exposure to each pollutant separately. The combined effects may be
synergistic, potentiative, or antagonistic, depending on the chemicals and the phys-
iological condition of the organism involved.
Synergism and Potentiation
These terms have been variously used and defined but, nevertheless, refer to
toxicity greater than would be expected from the toxicities of the compounds admin-
istered separately. It is generally considered that, in the case of potentiation, one
compound has little or no intrinsic toxicity when administered alone, while in the
case of synergism both compounds have appreciable toxicity when administered
alone. For example, smoking and exposure to air pollution may have synergistic
effect, resulting in increased lung cancer incidence. The presence of particulate
matter such as sodium chloride (NaCl) and sulfur dioxide (SO
2
), or SO
2
and sulfuric
acid mist simultaneously, would have potentiative or synergistic effects on animals.
Similarly, exposure of plants to both O
3
and SO
2
simultaneously is more injurious
than exposure to either of these gases alone. For example, laboratory work indicated
that a single 2-h or 4-h exposure to O
3
at 0.03 ppm and to SO
2
at 0.24 ppm did not
injure tobacco plants. Exposure for 2 h to a mixture of 0.031 ppm of O
3
and 0.24
ppm of SO
2
, however, produced moderate (38%) injury to the older leaves of Tobacco
Bel W3 (Menser and Heggestad 1966) (Table 6.1).
© 1999 by CRC Press LLC
Many insecticides have been known to exhibit synergism or potentiation. The
potentiation of the insecticide malathion by a large number of other organophosphate
compounds is an example.
Antagonism
Antagonism may be defined as that situation in which the toxicity of two or
more compounds present or administered together, or sequentially, is less than would
be expected when administered separately. Antagonism may be due to chemical or
physical characteristics of the xenobiotics, or it may be due to the biological actions
of the chemicals involved. For example, the highly toxic metal cadmium (Cd) is
known to induce anemia and nephrogenic hypertension as well as teratogenesis in
animals. Zinc (Zn) and selenium (Se) act to antagonize the action of Cd.
Physical means of antagonism can also exist. For example, oil mists have been
shown to decrease the toxic effects of O
3
and NO
2
or certain hydrocarbons in
experimental mice. This may be due to the oil dissolving the gas and holding it in
solution, or the oil containing neutralizing antioxidants.
TOXICITY OF MIXTURES
Evaluating the toxicity of chemical mixtures is an arduous task and direct
measurement through toxicity testing is the best method for making these determi-
nations. However, the ability to predict toxicity by investigating the individual
components and predicting the type of interaction and response to be encountered
is tantamount. These mathematical models are used in combination with toxicity
testing to predict the toxicity of mixtures (Brown 1968, Calamari and Marchetti
1973, Calamari and Alabaster 1980, Herbert and VanDyke 1964, Marking and
Dawson 1975, Marking and Mauck 1975).
Elaborate mathematical models have been used extensively in pharmacology to
determine quantal responses of joint actions of drugs (Ashford and Cobby 1974,
Hewlett and Plackett 1959). Calculations are based on knowing the “site of dosage”,
“site of action”, and the “physiological system” which are well documented in the
pharmacological literature. Additionally, numerous models exist for predicting mix-
ture toxicity but require prior knowledge of pair-wise interactions for the mixture
(Christensen and Chen 1991). Such an extensive database does not exist for most
organisms used in environmental toxicity testing, precluding the use of these models.
Table 6.1 Synergistic Effect of Ozone and Sulfur
Dioxide on Tobacco Bel W3 Plants
Toxicants,
ppm
Duration, h O
3
SO
2
Leaf damage, %
2 0.03 — 0
2 — 0.24 0
2 0.031 +0.24 38
© 1999 by CRC Press LLC
Simpler models exist for evaluating environmental toxicity resulting from chem-
ical mixtures. Using these models, toxic effects of chemical mixtures are determined
by evaluating the toxicity of individual components. These include the Toxic Units,
Additive (Marking 1977), and the Multiple Toxicity Indices (Konemann 1981).
These models, working in combination, will be most useful for the amount of data
that is available for determining toxicity of hazardous waste site soil to standard test
organisms.
The most basic model is the Toxic Unit model which involves determining the
toxic strength of an individual compound, expressed as a “toxic unit”. The toxicity
of the mixture is determined by summing the strengths of the individual compounds
(Herbert and Vandyke 1964) using the following model:
(6.1)
where S represents the actual concentration of the chemical in solution and T
50
represents the lethal threshold concentration. If the number is greater than 1.0, less
than 50% of the exposed population will survive; if it is less than 1.0, greater than
50% will survive.
A toxic unit of 1.0 = incipient LC
50
(Marking 1985).
Building on this simple model, Marking and Dawson devised a more refined
system to determine toxicity based on the formula:
(6.2)
where A and B are chemicals, i and m are the toxicities (LC
50
s) of A and B
individually and in a mixture, and S is the sum of activity. If the sum of toxicity is
additive, S = 1; sums that are less than 1.0 indicate greater than additive toxicity,
and sums greater than 1.0 indicate less than additive toxicity. However, values greater
than 1.0 are not linear with values less than 1.0.
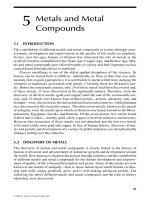
To improve this system and establish linearity, Marking and Dawson developed
a system in which the index represents additive, greater than additive, and less than
additive effects by zero, positive, and negative values, respectively. Linearity was
established by using the reciprocal of the values of S that were less than 1.0, and a
zero reference point was achieved by subtracting 1.0 (the expected sum for simple
additive toxicity) from the reciprocal [(1/S) – 1]. In this way greater than additive
toxicity is represented by index values greater than 1.0. Index values representing
less than additive toxicity were obtained by multiplying the value of S that were
greater than 1.0 by –1 to make them negative, and a zero reference point was
determined by adding 1.0 to this negative value [S(–1)+1]. Therefore, less than
additive toxicity is represented by negative index values (Figure 6.1). A summary
of this procedure is as follows:
=+
P
P
Q
Q
S
T
S
T
50 50
A
A
B
B
S
m
i
m
i
+=
© 1999 by CRC Press LLC
(6.3)
(6.4)
(6.5)
Although the toxic units and additive index are useful in determining toxicity in
some cases, they have disadvantages. Their values depend on the relative proportion
of chemicals in the mixture. Also, because of the logarithmic form of the concen-
tration in log-linear transformations, such as Probit and Logit, it is desirable to have
Figure
6.1
Graphical representation of the sum of toxic contributions. In the top of the figure
the sum of toxic contributions is counterintuitive, the more than additive toxicity
has a ratio of less than one and the proportions are nonlinear. With the corrections
in the corrected sum of toxic contributions, the less than additive toxicity is less
than one with the more than additive toxicity greater than one.
A
A
B
B
S
m
i
m
i
+=, the sum of biological effects
Additive Index = for S 1.0 and110S– . ≤
Additive Index = S for S −
()
+≥110 10
© 1999 by CRC Press LLC
a toxicity index that is logarithmic in the toxicant concentration. For these reasons
H. Konemann introduced a Multiple Toxicity Index (MTI):
(6.6)
where m
o
= M/f
max
; f
max
= largest value of z
i
/Z
i
in the mixture; z
i
= concentration of
toxicant i in the mixture; Z
i
= concentration of toxicant i, acting singly, giving the
desired response (endpoint); M =
∑
i
n
= 1 z
i
/Z
i
= sum of toxic units giving the desired
response; n = number of chemicals in the mixture.
When the concentration z
i
of each chemical relative to its effect concentration
Z
i,
when acting alone, is a constant f for all chemicals, f = z
i
/Z
i
, the above equation
reduces to:
(6.7)
Even the simplest model requires prior knowledge of the LC
50
for each compound
acting singly. The Additive Toxicity and Multiple Toxicity Indices require an LC
50
for the specific mixture as well as the singular compounds. Therefore, access to a
large database or the ability to estimate toxicity will be extremely important. Of
these two methods the corrected sum of toxic contributions derived by Marking and
Dawson appears to be the easiest to implement and to interpret.
MIXTURE ESTIMATION SYSTEM
The usefulness of these equations is (1) in the estimation of the toxicity of a
mixture and (2) the setting of priorities for cleanup by establishing the major
contributor to the toxicity of the mixture. The major disadvantage to the implemen-
tation is that these equations are not set up for easy use and the lack of environmental
toxicity data. A combination of implementation of the selected methodology into a
computer program coupled to a large database and quantitative structure activity
relationships estimation system should make these evaluations of mixture toxicity
efficient and useful. The components of such a system might be
•
The front end for data input, namely the available toxicity data for the components,
CAS numbers for the compounds with an unknown toxicity and the toxicity of the
mixture, if known. Concentrations of each material also are input.
•
A system for searching the appropriate databases for toxicity data or SAR models
for estimating the desired parameter. The QSAR system should provide adequate
warnings for the appropriateness of the model and its coverage in the database
from which the equation was derived.
•
A processor that incorporates the data from the literature and the QSARs along
with the concentration of the compounds. An estimate of the toxicity of the mixture
or identification of the major contributors will be the generated output.
MTI
M
m
o
=−1
log
log
MTI
M
n
=−1
log
log
© 1999 by CRC Press LLC
The difficulty in estimating the toxicity of mixtures using any of these models
is the difficulty of establishing interaction terms. All of the models require actual
toxicity tests to estimate these terms. Even in a simple mixture of four components
this requires six toxicity tests of the pairwise combinations and four three-component
tests to examine interactive terms. Perhaps the best that could be done in the short
term is to establish interaction terms between classes of compounds and use those
as models.
Initially, it would be desirable to use a simple model incorporating a linear
relationship. Since the data are lacking for the determination of interactive effects,
a simple additive toxic units model would make the fewest assumptions and require
the minimal amount of data. Such a model would simply consist of
(6.8)
where A
c
= environmental concentration of compound A, A
i
= concentration result-
ing in the endpoint selected, for example a EC
50
or LC
10
, and MT is the mixture
toxicity as a fraction with 1 equal to the mixture having the effect as the endpoint
selected.
It is certainly possible to make these estimations routine given the uncertainties
in the interaction terms and the lack of toxicity data. Properly designed, such a
system should allow the rapid and routine estimation of mixtures within the limita-
tions presented above.
ESTIMATING THE TOXICITY OF POLYNUCLEAR
AROMATIC HYDROCARBONS
As discussed in previous sections, there are numerous factors that can modify
the toxicity of materials. The prediction of the toxicity of mixtures is also difficult.
One of the best attempts at toxicity prediction has been formulated by Swartz et al.
(1995) and predicts the sediment toxicity of polynuclear aromatic hydrocarbons
(PAH). The model is based on the concentration of 13 PAHs in collected sediments,
the predicted concentration in the sediment pore water, and the toxicity of these
concentrations as determined by a large toxicity data set.
The
Σ
PAH model incorporated a number of factors that can modify the toxicity
of the sediment-borne PAHs. Equilibrium partitioning was used to estimate the
concentration of each PAH in the pore water of the sediment. The assumption was
that the pore water material is the fraction that is bioavailable. QSAR also was used
to estimate the interstitial water concentration based on the octanol-water partition
coefficent of several PAHs. Amphipods were used as the test organism to represent
environmental toxicity. A toxic unit approach was used and the toxicity is assumed
to be additive. The assumption of additivity is justified since each of the PAHs has
a similar mode of action. Finally, a concentration-response model was formulated
using existing toxicity data to estimate the probability of toxicity.
AA BB CC MT
c
ii
t
i
t
+++=
© 1999 by CRC Press LLC
The estimates of toxicity are expressed as nontoxic, uncertain, and toxic. These
classifications are based on the estimated percent mortality as generated by the
concentration response model. A percent of mortality less that 13% is considered
nontoxic. Between 13 and 24% mortality, the toxicity prediction is considered
uncertain. Above a prediction of 24% mortality the sediment is considered toxic.
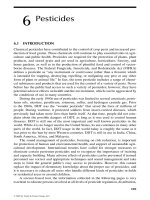
A flow chart for estimating sediment toxicity is presented in Figure 6.2. First, a
bulk sediment sample is taken and the PAH concentration and total organic carbon
are measured. The equilibrium partitioning model is run to predict the concentration
of each PAH in the interstitial water of the sediment. The predicted PAH concen-
trations are then converted to toxic units using the 10-day amphipod LC
50
as the
toxicity benchmark. The toxic units are then added up and processed through the
concentration response model. The expected mortality is then converted to nontoxic,
uncertain, and toxic predictions.
The estimates of toxicity were confirmed using a variety of sediment samples
with measurements of PAH concentrations and amphipod toxicity tests. At sites
where the PAHs were the prinicipal cause of contamination, the frequency of correct
Figure 6.2
The steps in calculating the toxicity of PAHs to amphipods.
© 1999 by CRC Press LLC
predictions was 86.6%. When the samples were collected from sites where PAHs
were not the principal contaminant, the frequency of correct prediction was 56.8%.
Wiegers et al. (1997) also have applied the model to the concentrations of 10
PAHs (data for all 13 PAHs were not consistently available) for samples collected
throughout Port Valdez, AK. Most of the samples were collected in the deep benthic
areas, although samples from the Small Boat Harbor in the city and nearshore areas
by Mineral Creek, the Valdez Marine Terminal, and the Solomon Gulch Hatchery
also were collected. All of the acute toxicity levels predicted in Port Valdez occurred
below the lowest levels set by the model. The sum of the toxic units (a measure of
the total toxicity associated with the concentrations) is included in Table 6.2 as a
comparison between samples collected from the identified sub-areas.
Estimating the toxicity of the sediments through use of a model develops another
line of evidence to weigh against those determined by comparison of chemical level
with benchmark values used to predict the toxicity of chemical contaminants. Bench-
mark values are based on a wide sweep of scientific studies conducted for single
compounds under a variety of conditions and are applied universally to all environ-
mental concentrations. The
Σ
PAH model described here uses effects levels derived
from a number of laboratory tests, but also incorporates some site-specific informa-
tion predicting bioavailability and considers multiple compounds. Compared to using
set criteria for specific compounds, the
Σ
PAH offers a distinct advantage to the
accurate prediction of toxicity.
BIOLOGICAL FACTORS AFFECTING TOXICITY
Plants
In plants, the most widely studied and probably the most important factor
affecting response to air pollutants is genetic variation. Plant response varies between
species of a given genus and between varieties within a given species. Such variation
is a function of genetic variability as it influences morphological, physiological, and
biochemical characteristics of plants. Gladiolus has long been recognized to be
Table 6.2 Acute Toxicity to Amphipods
Predicted from Sediment
Concentrations of 10 PAHs
Subarea Sum of the Toxic Units
Mineral 0.00001 ± 0.00001
City 0.0029 ± 0.001
Hatchery 0.00001 ± 0.00001
Alyeska 0.00004 ± 0.00004
W. Port 0.00001 ± 0.00002
E. Port 0.00001 ± 0.00001
Note:
The mean sum of the toxic units with
the standard deviations are listed. In
this instance the probabilty of toxicity
was low at each sampling site.
© 1999 by CRC Press LLC
extremely sensitive to fluoride. Varietal differences in fluoride response in gladiolus
also have been observed. Plants show differences in their susceptibility to different
pollutants. For instance, some plants may be sensitive to O
3
but relatively resistant
to SO
2
, while in others the opposite may be true.
The sensitivity of plants to atmospheric pollutants such as O
3
is known to be
related, in part, to stomatal opening and closure.
Leaf maturity also affects the sensitivity of plants to air pollutants. Generally,
young tissues are more sensitive to PAN and hydrogen sulfide, and maturing leaves
are most sensitive to the other airborne pollutants.
Animals
Genetic, developmental, health status, sex variation, and behavior are among the
important factors affecting the response of animals and humans to pollutant toxicity
(Hodgson 1980).
Genetic Factors
Similar to the situation in plants previously discussed, different species of ani-
mals respond differently to a given dose of a chemical or an environmental pollutant.
In experimental animals, species variation as well as variation in strains within the
same species occurs. In humans, such factors as serum, red blood cell, and immu-
nological disorders, and genetically induced malabsorption can contribute to differ-
ences in their response to environmental stresses. Individuals with malabsorption
syndrome, for example, may suffer nutritional deficiencies, which in turn may lead
to an increased susceptibility to environmental chemicals.
Developmental Factors
Immature immune system, aging, pregnancy, immature detoxication systems,
and circadian rhythms are included in this category. For example, lack of
γ
-globulin
to cope with invading bacteria and viruses; decline in renal function as a result of
aging; lack of receptors needed in hormonal action; greater stresses encountered by
pregnant women to metabolize and detoxify foreign chemicals, not only for them-
selves but for the fetus; and immature hepatic MFO system in the young; are all
contributing factors to varying responses exhibited by the individuals to xenobiotics.
Diseases
Diseases in the heart, lungs, kidney, and liver predispose a person to more severe
consequences following the exposure to pollutants. As shown previously, organs
such as these are responsible for storage, metabolism, and excretion of environmental
pollutants. Diseases in any of these organs would lead to impaired functioning and
decreased ability to cope with xenobiotics. For instance, cardiovascular and respi-
ratory diseases of other origins decrease the individual’s ability to withstand super-
imposed stresses. An impaired renal function will certainly affect the kidney’s ability
© 1999 by CRC Press LLC
to excrete toxic substances or their metabolites. As mentioned earlier, the liver plays
a vital role in detoxication of foreign chemicals, in addition to its role in the
metabolism of different nutrients. Liver disorders, therefore, will seriously impair
detoxication processes.
Lifestyle
Smoking, drinking, and drug habits are some examples of lifestyle that can affect
human response to environmental pollutants. Research has shown that smoking acts
synergistically with many environmental pollutants. A smoker thus may be at a
higher risk than a nonsmoker when exposed to an additional environmental stress.
For example, asbestos workers or uranium miners who smoke have been shown to
exhibit higher lung cancer death rates than workers who do not smoke.
Sex Variation
The rate of metabolism of foreign compounds varies with the difference in sex
of both humans and animals. For example, response to chloroform (CHCl
3
)
exposure
by experimental mice shows a distinct sex variation. Male mice are highly sensitive
to CHCl
3
. Death often results following their exposure to this chemical. The higher
sensitivity of male mice to certain toxic chemicals may be due to their inability to
metabolize the chemicals as efficiently as the female mice. Interestingly, death rates
of male mice resulting from exposure to CHCl
3
is affected by different strains as
well (Table 6.3).
NUTRITIONAL FACTORS
The importance of nutrition as a major factor affecting the toxicity of chemicals
has been recognized in the recent years. Results obtained from human epidemiolog-
ical and animal experimental studies strongly support the relationship between
nutrition and pollutant toxicity. For example, laboratory animals fed low protein
diets have been reported to be more susceptible to the toxicity of chemicals under
test. The interaction between nutrition and environmental pollutants is complex, and
understanding its nature is a great challenge in the study of both toxicology and
Table 6.3 Effect of CHCl
3
Exposure
on Death Rate of Various
Strains of Male Mice
Strains Death rate (%)
DBA-2 75
DBA-1 51
CsH 32
BLAC 10
© 1999 by CRC Press LLC
nutritional biochemistry. It may be mentioned that a new area of study called
nutritional toxicology
has emerged in the recent years.
The relationship between nutrition and toxicology falls into three major catego-
ries: (1) the effect of nutritional status on the toxicity of drugs and environmental
chemicals, (2) the additional nutritional demands that result from exposure to drugs
and environmental chemicals, and (3) the presence of toxic substances in foods
(Parke and Loannides 1981).
Generally, nutritional modulation can alter rates of absorption of environmental
chemicals, thus affecting circulating level of those chemicals. It can cause changes
in body composition leading to altered tissue distribution of chemicals. Dietary
factors also can influence renal function and pH of body fluids, resulting in altered
toxicity of chemicals. In addition, responsiveness of the target organ may be modified
as a result of changing nutrition.
Fasting/Starvation
This is the most severe form of nutritional modulation. The effect of fasting or
starvation, generally, is decreased metabolism and clearance of chemicals, resulting in
increased toxic effects. Studies showed that the effect of fasting on microsomal oxidase
activity is species-, substrate-, and sex-dependent, i.e., some reactions are decreased in
male rats and increased in females, while others may not be affected at all. Animal
studies also showed that glucuronide conjugation was decreased under starvation.
Proteins
Many different chemical compounds induce the MFO in the liver and other
tissues. Induction of the MFO is associated with increased biosynthesis of new
protein. The most potent inducers are substrates whose rates of metabolism are low,
so that they remain associated with the enzyme for long periods of time. In humans,
severely limited protein intake is usually accompanied by inadequate intake of all
other nutrients, thus it is difficult to designate specific pathological conditions to
protein deficiency per se. Protein deficiency causes impaired hepatic function and
hypoproteinemia, resulting in decreased hepatic proteins, DNA, and microsomal P-
450, as well as lowered plasma binding of xenobiotics. Conjugation is also influ-
enced, but the effect is less consistent. Removal of pollutants from the body may
be impaired, leading to an increased toxicity, although exceptions do exist.
The effect of proteins on pollutant toxicity include both quantitative and quali-
tative aspects. Experiments show that animals fed proteins of low biological value
exhibited a lowered microsomal oxidase activity. When dietary proteins were sup-
plemented with tryptophan, the enzyme activity was enhanced. Alteration of xeno-
biotic metabolism by protein deprivation may lead to enhanced or decreased toxicity,
depending on whether metabolites are more or less toxic than the parent compound.
For example, rats fed a protein-deficient diet show decreased metabolism but
increased mortality with respect to pentobarbital, parathion, malathion, DDT, and
toxaphene (Table 6.4). On the other hand, rats treated under the same conditions
© 1999 by CRC Press LLC
may show a decreased mortality with respect to heptachlor, CCl
4
, and aflatoxin. It
is known that, in the liver, heptachlor is metabolized to the epoxide, which is more
toxic than heptachlor itself, while CCl
4
is metabolized to CCl
3
·
, a highly reactive free
radical. As for aflatoxin, the decreased mortality is due to reduced binding of its
metabolites to DNA.
Carbohydrates
A high-carbohydrate diet usually leads to a decreased rate of detoxication. The
microsomal oxidation is generally depressed when the carbohydrate/protein ratio is
increased. In addition, the nature of carbohydrates also affects oxidase activity. Since
dietary carbohydrates influence body lipid composition, the relationship between
carbohydrate nutrition and toxicity is often difficult to assess. However, environ-
mental chemicals can affect, and be affected by, body glucose homeostasis in several
different ways. For example, poisoning by chemicals may deactivate hepatic glucose
6-phosphatase by damaging the membrane environment of the enzyme. Compounds
that are metabolized by the liver to glucuronyl conjugates are more hepatotoxic to
fasted animals than fed animals. Low hepatic glycogen contents also may lead to a
greater vulnerability of fasted animals to xenobiotics such as acetaminophen, whose
metabolism is associated with depletion of the glutathione (GSH) component of the
hepatic antioxidant defense system.
Lipids
Dietary lipids may affect the toxicity of environmental chemicals by delaying
or enhancing their absorption. The absorption of lipophobic substances would be
delayed and that of lipophilic substances accelerated.
Table 6.4 Effect of Protein on Pesticide Toxicity
Casein content of diet
Compounds 3.5% 26%
Acetylcholinesterase inhibitors
LD
50
, mg
Parathion 4.86 37.1
Diazinon 215 466
Malathion 759 1401
Carbaryl 89 575
Chlorinated hydrocarbons
DDT 45 481
Chlordane 137 217
Toxaphene 80 293
Endrin 6.69 16.6
Herbicide and fungicides
Diuron 437 2390
Captan 480 12,600
Note:
Male rats fed for 28 days from weaning on diets of varying
casein contents, then given an oral dose of pesticides.
© 1999 by CRC Press LLC
The endoplasmic reticulum contains high amounts of lipids, especially phospho-
lipids, rich in polyunsaturated fatty acids. Lipids may influence the detoxication
process by affecting the cytochrome P-450 system because phosphatidylcholine is
an essential component of the hepatic microsomal MFO system (Parke and Loan-
nides 1981). A high-fat diet may favor more oxidation to occur, as it may contribute
to more incorporation of membrane material.
Types of lipids also can affect toxicant metabolism, as a high proportion of
phospholipids is unsaturated due to the presence of linoleic acid (18:2) in the
β
-
position of triacylglycerol. Thus, dietary 18:2 is important in determining the normal
levels of hepatic cytochrome P-450 concentration and the rate of oxidative demethy-
lation in rat liver.
Significant as it is, higher doses of linoleic acid decrease hepatic cytochrome P-
450 and MFO activity (Hietanen et al. 1978), and unsaturated fatty acids added to
rat and rabbit liver microsomes
in vitro
inhibit MFO activity with Type I substrates
(e.g.,
p
-nitroanisole), probably because the fatty acids act as competitive substrates
(Di Augustinem and Foutsm 1969).
Dietary lipids play a unique role in the toxicity of chlorinated hydrocarbon
pesticides. Dietary lipids may favor more absorption of these pesticides, but once
these chemicals are absorbed into the body, they may be stored in the adipose tissue
without manifestation of toxicity. For this reason, obesity in humans is considered
protective against chronic toxicity of these chemicals. Similarly, the body fat in a
well-fed animal is known to store organochlorine pesticides. Fat mammals, fish, and
birds are thus more resistant to DDT poisoning than their thinner counterparts. In
times of food deprivation, however, organic materials such as DDT and PCB can
be mobilized from mammalian fat deposits and reach concentrations potentially
toxic to the animal.
The role of dietary lipids in affecting pollutant toxicity has been fairly well
defined for a few specific chemicals including lead, fluoride, and hydrocarbon
carcinogens. For example, high-fat diets are known to increase Pb absorption and
retention. In addition, competitive absorption of Pb and Ca exists and this is probably
due to competition for the Ca binding protein (CaBP), whose synthesis is mediated
by vitamin D, a fat-soluble vitamin. In earlier studies, a high-fat diet was shown to
result in increased body burden of fluoride, leading to enhanced toxicity. This is
attributed to delaying of gastric emptying caused by high dietary fat. As a conse-
quence, enhanced fluoride absorption may result and thus increase body burden of
fluoride. Dietary fat does not increase metabolic toxicity of fluoride itself. As is well
known, aflatoxin, a toxin produced by
Aspergillus flavus
, is a potent liver cancer-
causing agent. A high-fat diet offers protection from lethal effects of the toxin,
presumably through dissolution of the carcinogen.
Vitamin A
Interest in vitamin A and its synthetic analogues as a potential factor in the
prevention and treatment of certain types of cancer has been growing. In addition,
there is evidence that vitamin A may be related to pollutant toxicity. Recent epide-
miological studies in humans, with a sample of 8000 men in Chicago, showed a low
© 1999 by CRC Press LLC
lung cancer incidence in those with a high vitamin A level in the diet, while the
incidence was higher in those people with a low dietary vitamin A. Experimental
studies show that rats exposed to PCB, DDT, and dieldrin caused a marked reduction
in liver vitamin A store suggesting that the metabolism of vitamin A may be affected
by exposure to these organisms. In another study, rats deficient in retinol were shown
to have a lowered liver cytochrome P-450 activity. The effect of vitamin A deficiency
on detoxification, however, depends on several factors such as substrate, tissue, and
animal species.
Vitamin D
The role that vitamin D plays in the prevention of rickets and osteomalacia is
widely known. Studies have shown that the mechanism involved in the conversion
of vitamin D into its metabolically active form responsible for the maintenance of
calcium homeostasis. Cholecalciferol (vitamin D) is first hydroxylated in the liver
to 25-hydroxy-D
3
. This is then converted in the kidney to 1,25-dihydroxy-D
3
, the
“hormone-like” substance that is the active form of the vitamin. The 25-hydroxyla-
tion of cholecalciferol requires NADPH, O
2
, and an enzyme whose properties are
similar to those of microsomal MFO (Bjorkhelm et al. 1979). In addition,
25-hydroxy-D
3
has been shown to competitively inhibit some cytochrome P-450
reactions
in vitro
.
Vitamin E
Vitamin E (
α
-tocopherol), a potent membrane-protecting antioxidant, protects
against toxicants causing membrane damage through peroxidation. Male rats sup-
plemented with daily doses of 100 mg tocopheryl acetate and exposed to 1.0 ppm
O
3
have been shown to survive longer than vitamin E-deficient rats. The action of
O
3
is attributed at least in part to free radical formation. In addition, there is sufficient
evidence that vitamin E protects phospholipids of microsomal and mitochondrial
membranes from peroxidative damage by reacting with free radicals. Because lipid
peroxidation is associated with decrease in oxidase activities, it is expected that the
enzyme activity is affected by dietary vitamin E. Maximum activity has been observed
when diets included both polyunsaturated fatty acids and vitamin E.
Nitrosamine is known to be carcinogenic; it leads to liver cancer. Relationships
between vitamin E and nitrosamines are attributed to the inhibitory effect of the
vitamin on nitrosamine formation, i.e., vitamin E competes for nitrite, a reactant in
the formation of nitrosamine.
Vitamin C
Vitamin C (ascorbic acid) is found in varying amounts in almost all of our body
tissues. In particular, high contents are found in adrenal and pituitary glands, eye
lens, and various soft tissues (Table 6.5). Ascorbic acid is a potent antioxidant and
participates in a large number of cellular oxidation-reduction reactions. Thus, vita-
min C protects against superoxide formation in the cytosol. Its relationship to drug
© 1999 by CRC Press LLC
metabolism, as well as pollutant toxicity, has attracted attention in recent years. For
example, vitamin C-deficient guinea pigs have been shown to have an overall defi-
ciency in drug oxidation with marked decreases in N- and O-demethylations, and
in the contents of cytochrome P-450 and cytochrome P-450 reductase (Parke and
Loannides 1981). Administration of ascorbate to the deficient animals for 6 days
reversed these losses of MFO activity. The effect of vitamin C appears to be tissue-
dependent (Kuenzig et al. 1977).
Recent research suggests that vitamin C may reduce the carcinogenic potential
of some chemicals. It has been demonstrated that a variety of experimental tumors
of the gastrointestinal tract, liver, lung, and bladder can be produced by nitroso
compounds (Narisawa et al. 1976; Mirvish et al. 1975), which are produced by the
reaction of nitrites with secondary and tertiary amines, amides or others:
(6.9)
The nitrosation of several secondary and tertiary amines can be blocked
in vitro
by the addition of vitamin C. The vitamin appears to compete for the nitrite, thus
inhibiting nitrosation. It has been demonstrated that vitamin C does not react with
amines, nor does it enhance the rate of nitrosamine decomposition. However, it
reacts very rapidly with nitrite and nitrous acid. It has been suggested that the vitamin
decreases the available nitrite by reducing nitrous acid to nitrogen oxides, leading
to inhibition of the nitrosation reaction:
2 HNO
2
+ Ascorbate
→→
→→
Dehydroascorbate + 2 NO + 2 H
2
O (6.10)
Table 6.5 Ascorbic Acid Content of
Adult Human Tissues
Ascorbic acid
Tissue (mg/100 g wet tissue)
Pituitary glands 40–50
Leucocytes 35
Adrenal glands 30–40
Eye lens 25–31
Brain 13–15
Liver 10–16
Spleen 10–15
Pancreas 10–15
Kidneys 5–15
Heart muscle 5–15
Lungs 7
Skeletal muscle 3–4
Testes 3
Thyroid 2
Plasma 0.4–1.0
Saliva 0.07–0.09
© 1999 by CRC Press LLC
Although little or no evidence is available that a similar effect occurs in humans,
it has been suggested that, in view of our increasing exposure to various drugs and
xenobiotics, the current RDA (Recommended Dietary Allowances) for ascorbic acid
may be inadequate (Zannoni 1977). For instance, the average American is thought
to ingest approximately 70 µg Cd/day, 0.9 mg As/day, 4.1 mg nitrite/day, in addition
to exposure to ambient air containing CO, O
3
, Pb, cigarette smoke, and others
(Calabrese 1980). Recommendations for increasing the RDA for vitamin C to meet
such additional needs, however, has not received general support. Moreover, it is
known that a dietary excess of vitamin C can produce various adverse effects, based
on nutritional and clinical point of view.
Minerals
About 20 mineral elements are considered to be essential in human nutrition,
and seven of these, including calcium, phosphorus, sodium, potassium, magnesium,
sulfur, and chlorine are called macrominerals, while the rest are often referred to as
trace elements. Mineral nutrition influences toxicology in different ways. Interactions
are common concerning the effects of the trace nutrients on detoxication. It is
recognized that trace mineral elements, like the macronutrients, can influence absorp-
tion of xenobiotics. Divalent cations can compete for chelation sites in intestinal
contents as well as for binding sites on transport proteins. As is well documented,
competitive absorption of Pb and Ca occurs and this is probably due to competition
for binding sites on intestinal mucosal proteins mediated by vitamin D.
Zinc is known to provide protection against Cd and Pb toxicities (Sandstead
1980). Absorption of Zn is facilitated by complexing with picolinic acid, a metabolite
of the amino acid tryptophan. Although both Cd and Pb form complexes with
picolinic acid, the resulting complexes are less stable than the Zn complex.
Cytochrome P-450 requires iron for its biosynthesis, thus deficiency of Fe might
lead to a decrease in MFO activity. It has been shown that the villous cells of rat
duodenal mucosa rapidly lose their cytochrome P-450 content and MFO activity
when dietary Fe is deficient (Hoensch et al. 1975). Selenium is antagonistic to both
Cd and Hg, thus reducing their toxicity. In addition, Se enhances vitamin E function
in the prevention of lipid peroxidation. The mechanisms involved in the functioning
of these two trace nutrients are different, however. Whereas vitamin E is thought to
function as a membrane-bound antioxidant acting as a free radical scavenger, Se
participates at the active site of glutathione peroxidase and thus part of the enzyme.
This enzyme protects membrane lipids by catalyzing the destruction of H
2
O
2
and
organic hydroperoxides before they can cause membrane disruption.
As previously mentioned, increasing evidence suggests that oxygen radicals play
a major role in the pathophysiology of many diseases including cancer. Reference
was also made that antioxidants play a vital role in counteracting these radicals.
Like other antioxidants such as vitamins C and E and
β
-carotene, selenium is
considered by many to exhibit anticarcinogenic action. It should be noted that only
relatively small amounts of selenium are needed to meet known physiological func-
tions and, like other essential nutrients, selenium is toxic when consumed in excess.
© 1999 by CRC Press LLC
REFERENCES AND SUGGESTED READINGS
Ashford, J.R. and Cobby J.M. 1974. A system of models for the action of drugs applied singly
or jointly to biological organisms.
Biometrics
30: 11-31.
Baker, E.M., D.C. Hammer, S.C. March, B.M. Tolbert, and J.E. Canham. 1971. Ascorbate
sulfate: a urinary metabolite of ascorbic acid in man.
Science
173: 826-827.
Bjorkhelm, I., I. Holmberg, and K. Wikvall. 1979. 25-Hydroxylation of vitamin D
3
by a recon-
stituted system from rat liver microsomes.
Biochem. Biophys. Res. Commun
. 90: 615-622.
Brown, V.M. 1968. The calculation of the acute toxicity of mixtures of poisons to rainbow
trout.
Wat. Res
. 2: 723-733.
Calabrese, E.J. 1980.
Nutrition and Environmental Health.
Vol. 1. John Wiley & Sons, New
York, pp. 452-455.
Calamari D. and R. Marchetti. 1973. The toxicity of mixtures of metals and surfactants to
rainbow trout (
Salmo gairdneri
Rich.).
Wat. Res
. 7: 1453-1464.
Calamari, D. and J.S. Alabaster. 1980. An approach to theoretical models in evaluating the
effects of mixtures of toxicants in the aquatic environment.
Chemosphere
9: 533-538.
Christensen, E.R. and C.Y. Chen. 1991. Modeling of combined toxic effects of chemicals.
Toxic Subst. J. 11: 1-63.
Di Augustinem, R.P. and J.R. Foutsm. 1969. The effects of unsaturated fatty acids on hepatic
microsomal drug metabolism and cytochrome P-450. Biochem. J. 115: 547-554.
Dunning, J.A. and W.W. Heck. 1973. Response of pinto bean and tobacco to ozone as
conditioned by light intensity and/or humidity. Environ. Sci. Technol. 7: 824-826.
Dunning, J.A., W.W. Heck, and D.T. Tingey. 1974. Foliar sensitivity of pinto bean and soybean
to ozone as affected by temperature, potassium nutrition, and ozone dose. Water, Air,
Soil Pollut. 3: 305-313.
Herbert, D.W.M. and J.M. VanDyke. 1964. The toxicity to fish of mixtures of poisons. Ann.
Appl. Biol. 53: 415-421.
Hewlett, P.S. and R.L. Plackett. 1959. A unified theory for quantal responses to mixtures of
drugs: noninteractive action. Biometrics December: 591-610.
Hodgson, E. 1980. Chemical and environmental factors affecting metabolism of xenobiotics.
In Introduction to Biochemical Toxicology. E. Hodgson and F.E. Guthrie, Eds., Elsevier,
New York, pp. 143-161.
Hietanen, E., O. Hanninen, M. Laitinen, and Lang, M. 1978. Regulation of hepatic drug
metabolism by elaidic and linoleic acids in rats. Enzyme 23: 127-134.
Hoensch, H., C.H. Woo, and R. Schmid. 1975. Cytochrome P-450 and drug metabolism in
intestinal villous and crypt cells of rats: effect of dietary iron. Biochem. Biophys. Res.
Commun. 65: 399-406.
Hull, H.M. and F.W. Went. 1952. In: Proceedings of The Second National Air Pollution
Symposium, p.122. Stanford Res. Inst., Pasadena, California.
Konemann, H. 1981. Fish toxicity test with mixtures of more than two chemicals: a proposal
for a quantitative approach and experimental results. Toxicology 19: 229-238.
Krenkel, P.A. and F.L. Parker, Eds. 1969. Biological Aspects of Thermal Pollution. Vanderbilt
University Press, Nashville, TN.
Kuenzig, W., V. Tkaxzevski, J.J. Kamm, A.H. Conney, and J.J. Burns. 1977. The effect of
ascorbic acid deficiency on extrahepatic microsomal metabolism of drugs and carcino-
gens in the guinea pig. J. Pharmacol. Exp. Ther. 201: 527-533.
MacLean, D.C., R.E. Schneider, and D.C. McCune. 1973. In: Proceedings of The Third
International Clean Air Congress, Union Air Prev. Ass., Dusseldorf, Germany, pp.
A143-145.
© 1999 by CRC Press LLC
Marking, L.L. and V.K. Dawson. 1975. Method for assessment of toxicity or efficacy of
mixtures of chemicals. U.S. Fish. Wildl. Serv. Invest. Fish Control 647: 1-8.
Marking, L.L. and W.L. Mauck. 1975. Toxicity of paired mixtures of candidate forest insec-
ticides to rainbow trout. Bull. Environ. Contam. Toxicol. 13: 518-523.
Marking, L.L. 1977. Method for assessing additive toxicity of chemical mixtures. In Aquatic
Toxicology and Hazard Evaluation. F.L. Mayer and J.L. Hamelink, Eds., American
Society for Testing and Materials, Philadelphia, PA, pp. 99-108.
Marking, L.L. 1985. Toxicity of chemical mixtures. In Fundamentals of Aquatic Toxicology,
G.M. Rand and S.R. Petrocelli, Eds., Hemisphere Publishing Co., New York, pp. 164-176.
Menser, H.A. and H.E. Heggestad. 1966. Ozone and sulfur dioxide synergism. Injury to
tobacco plants. Science 153: 424-425.
Mirvish, S.S., A. Cardesa, L. Wallcave, and P. Shubik. 1975. Induction of mouse lung
adenomas by amines or ureas plus nitrite and by N-nitroso compounds: effect of ascor-
bate, gallis acid, thio cyanate, and caffeine. J. Natl. Cancer Inst. 55: 633-636.
Narisawa, T., C.Q. Wong, R.R. Moronpot, and J.H. Weisburger. 1976. Large bowel carcino-
genesis in mice and rats by several intrarectal doses of methylnitrosourea and negative
effect of nitrite plus methylurea. Cancer Res. 36: 505-510.
Parke, D.V. and C. Loannides. 1981. The role of nutrition in toxicology. Ann. Rev. Nutr. 1:
207-234.
Sandstead, H.H. 1980. Interactions of toxic elements with essential elements: introduction.
Ann. N.Y. Acad. Sci. 355: 282-284.
Swartz, R.C., D.W. Schults, R.J. Ozretich, J.O. Lamberson, F.A. Cole, T.H. DeWitt, M.S. Red-
mond, and S.P. Ferraro. 1995. ΣPAH: a model to predict the toxicity of polynuclear aromatic
hydrocarbon mixtures in field-collected samples. Environ. Toxicol. Chem. 11: 1977-1987.
Weigers, J.K., H.M. Feder, W.G. Landis, L.S. Mortensen, D.G. Shaw, and V.J. Wilson. 1997.
A Regional Multiple-Stressor Ecological Risk Assessment for Port Valdez, Alaska. Tech-
nical Report 9701. Institute of Environmental Toxicology and Chemistry, Western Wash-
ington University, Bellingham, WA.
Zannoni, V.G. 1977. Ascorbic acid and liver microsomal metabolism. Acta Vitaminol. Enzymol.
31: 17-29.
STUDY QUESTIONS
1. Which substance will have a higher toxicity — ionized or nonionized? Why?
2. Exposure to high levels of pollutants results in _______ effects, low concentrations
result in _______ effects.
3. Describe why intermittent exposure to a pollutant may not be as detrimental as
continuous exposure.
4. Name two effects temperature changes (thermal pollution) have on living organ-
isms.
5. How can humidity levels and light intensity affect pollutants’ effects?
6. Describe synergistic, potentiative, and antagonistic effects resulting from the inter-
action of pollutants.
7. Describe the toxic unit model.
8. How is a value for additive toxicity found?
9. What is the multiple toxicity index? What are the component parts of the equation
used to calculate the index?
10. What are the two uses of the toxicity equations?
© 1999 by CRC Press LLC
11. What are the advantages of using a Toxic Units model for describing the toxicity
of mixtures?
12. Diagram the steps for the ΣPAH model for estimating the sediment toxicity of
mixtures of PAHs.
13. What are plants’ most important factor affecting response to air pollutants? What
is another factor for plant sensitivity?
14. Name five important factors affecting the response of animals to pollutant toxicity.
15. What effects can nutritional modulation have on response to pollutant toxicity?
16. What effect does a high-carbohydrate diet have on detoxification? What effect do
dietary lipids have?
17. What are several possibilities of mechanisms involved in vitamin A action in
relation to carcinogenesis?
18. Discuss the relationships of vitamin E and vitamin C with nitrosamine.
© 1999 by CRC Press LLC