Practical Design Calculations for Groundwater and Soil Remediation - Chapter 4 ppsx
Bạn đang xem bản rút gọn của tài liệu. Xem và tải ngay bản đầy đủ của tài liệu tại đây (535.28 KB, 36 trang )
Kuo, Jeff "Mass balance concept and reactor design"
Practical Design Calculations for Groundwater and Soil Remediation
Boca Raton: CRC Press LLC,1999
©1999 CRC Press LLC
chapter four
Mass balance concept and
reactor design
Various treatment processes are employed in remediation of contaminated
soil or groundwater. Treatment processes are generally classified as physical,
chemical, biological, and thermal processes. Treatment systems often consist
of a series of unit operations/processes, which form a process train. Each
unit operation/process contains one or more reactors. A reactor can be con-
sidered as a vessel in which the processes occur. Environmental engineers
are often in charge of or, at least, participate in preliminary design of the
treatment system. Basically, the preliminary design involves selection of
treatment processes and reactor type as well as sizing the reactors.
For treatment system design, treatment processes should be selected first
by screening the alternatives. Many factors should be considered in selection
of treatment processes. Common selection criteria are implementability,
effectiveness, cost, and regulatory consideration. In other words, an opti-
mum process would be the one that is implementable, effective in removal
of contaminants, cost efficient, and in compliance with the regulatory
requirements.
Once the treatment processes are selected for a remediation project,
engineers will then design the reactors. Preliminary reactor design usually
includes selecting appropriate reactor types, sizing reactors, and determining
the number of reactors needed and their optimal configuration. To size the
reactors, engineers first need to know if the desirable reactions or activities
would occur in the reactors and what the optimal operating conditions such
as temperature and pressure would be. Information from chemical thermo-
dynamics, or more practically a pilot study, would provide the answers to
these questions. If the desired reactions are feasible, the engineers then need
to determine the rates of these reactions, which is a subject of chemical
©1999 CRC Press LLC
kinetics. The reactor size is then determined, based on mass loading to the
reactor, reaction rate, and type of reactor.
This chapter introduces the mass balance concept, which is the basis for
process design. Then it presents reaction kinetics as well as types, configu-
ration, and sizing of reactors. From this chapter you will learn how to
determine the rate constant, removal efficiency, optimal arrangement of reac-
tors, required residence time, and reactor size for your specific applications.
IV.1 Mass balance concept
The mass balance (or material balance) concept serves as a basis for designing
environmental engineering systems (reactors). The mass balance concept is
nothing but conservation of mass. Matter can neither be created nor
destroyed, but it can be changed in form (a nuclear process is one of the few
exceptions). The fundamental approach is to show the changes occurring in
the reactor by the mass balance analysis. The following is a general form of
a mass balance equation:
[Eq. IV.1.1]
Performing a mass balance on an environmental engineering system is
just like balancing your checkbook. The rate of mass accumulated (or
depleted) in a reactor can be viewed as the rate that money is accumulated
(or depleted) in your checking account. How fast the balance changes
depends on how much and how often the money is deposited and/or with-
drawn (rate of mass input and output), interest accrued (rate of mass gen-
erated), and bank charges for monthly service and ATM fees imposed (rate
of mass destroyed).
In using the mass balance concept to analyze an environmental engi-
neering system, one usually begins by drawing a process flow diagram and
employing the following procedure:
Step 1: Draw system boundaries or boxes around the unit processes/op-
erations or flow junctions to facilitate calculations.
Step 2: Place known flow rates and concentrations of all streams, sizes
and types of reactors, and operating conditions such as temper-
ature and pressure on the diagram.
Step 3: Calculate and convert all known mass inputs, outputs, and ac-
cumulation to the same units and place them on the diagram.
Step 4: Mark unknown (or the ones to be solved) inputs, outputs, and
accumulation on the diagram.
Rate of mass
ACCUMULATED
Rate of mass
IN
Rate of mass
OUT
Rate of mass
GENERATEDor
DESTROYED
=
−
±
©1999 CRC Press LLC
Step 5: Perform the necessary analyses/calculations using the proce-
dures described in this chapter.
A few special cases or reasonable assumptions would simplify the gen-
eral mass balance equation, Eq. IV.1.1, and make the analysis easier. Three
common ones are presented below:
a.
No Reactions Occurring:
If the system has no chemical reactions occur-
ring, such as a mixing process, there is no increase or decrease of
compound mass due to reactions. The mass balance equation would
become
[Eq. IV.1.2]
b.
Batch Reactor:
For a batch reactor, there is no input into or output out
of the reactor. The mass balance equation can be simplified into
[Eq. IV.1.3]
Examples of using Eq. IV.1.3 will be provided in later sections of this
chapter.
c.
Steady-State Conditions:
To maintain the stability of treatment process-
es, treatment systems are usually kept under steady-state conditions
after a start-up period. A steady-state condition basically means that
flow and concentrations at any location within the treatment process
train are not changing with time. Although the concentration and/or
flow rate of the influent waste stream entering a soil/groundwater
system typically fluctuate, engineers may want to incorporate devices
such as equalization tanks to dampen the fluctuation. This is espe-
cially true for treatment processes that are very sensitive to fluctuation
of mass loading (biological processes are good examples).
For a reactor under a steady-state condition, although reactions are
occurring inside the reactor, the rate of mass accumulation in the reactor
would be zero. Consequently, the left-hand side term of Eq. IV.1.1 becomes
zero. The mass balance equation can then be reduced to
[Eq. IV.1.4]
Rate of mass
ACCUMULATED
Rate of mass
IN
Rate of mass
OUT
=
−
Rate of mass
ACCUMULATED
Rate of mass
GENERATEDor
DESTROYED
=±
0 =
−
±
Rate of mass
IN
Rate of mass
OUT
Rate of mass
GENERATEDor
DESTROYED
©1999 CRC Press LLC
Assumption of steady-state is frequently used in the analysis of flow
reactors, and examples of using Eq. IV.1.4 will be provided in later sections
of this chapter.
The general mass balance equation, Eq. VI.1.1, can also be expressed as
[Eq. IV.1.5]
where
V
is the volume of the system (reactor),
C
is the concentration,
Q
is
the flow rate, and
γ
is the reaction rate. The following sections will demon-
strate the role of the reaction in the mass balance equation and how it affects
the reactor design.
Example IV.1.1 Mass balance equation — air dilution
(no chemical reaction occurring)
A glass bottle containing 900 mL of methylene chloride (CH
2
Cl
2
, specific
gravity = 1.335) was accidentally left uncapped in a poorly ventilated room
(5 m
×
6 m
×
3.6 m) over a weekend. On the following Monday it was found
that two thirds of methylene chloride had volatilized. For a worst-case sce-
nario, would the concentration in the room air exceed the permissible expo-
sure limit (PEL) of 100 ppmV?
An exhaust fan (
Q
= 200 ft
3
/min) was turned on to vent the fouled air
in the laboratory. How long will it take to reduce the concentration down
below the PEL?
Stategy.
This is a special case (no reactions occurring) of the general
mass balance equation. For this case Eq. IV.1.5 can be simplified into
[Eq. IV.1.6]
The equation can be further simplified with the following assumptions:
1. The air leaving the laboratory is only through the exhaust fan and the
air ventilation is equal to the rate of air entering the laboratory (
Q
in
= Q
out
= Q
)
2. The air entering the laboratory does not contain methylene chloride
(
C
in
= 0).
3. The air in the laboratory is fully mixed, thus the concentration of
methylene chloride in the laboratory is uniform and is the same as
that of the air vented by the fan (
C = C
out
).
[Eq. IV.1.7]
V
dC
dt
QC Q C V
in in out out
=− ±×
∑∑
()γ
V
dC
dt
QC Q C
in in out out
=−
∑∑
V
dC
dt
QC=−
©1999 CRC Press LLC
It is a first-order differential equation. It can be integrated with initial
condition,
C = C
0
at
t
= 0:
[Eq. IV.1.8]
Solution:
a. Methylene chloride concentration in the laboratory before ventilation
can be found as 2101 ppmV (see Example II.1.1C for detailed calcu-
lations).
b. The size of the reactor,
V
= the size of the laboratory
= (5 m)(6 m)(3.6 m) = 108 m
3
.
The system flow rate,
Q
= ventilation rate
= 200 ft
3
/min = (200 ft
3
/min) ÷ (35.3 ft
3
/m
3
) = 5.66 m
3
/min.
The initial concentration,
C
0
= 2101 ppmV. The final concentration,
C
= 100 ppmV.
100 = (2101)
e
–(5.66/108)
t
Thus, t = 58 min.
Discussion.
The actual time required would be longer than 58 minutes
because the assumption of complete mix inside the room may not be valid.
IV.2 Chemical kinetics
Chemical kinetics is concerned with the rate at which chemical reactions
occur. This section discusses the rate equation, reaction rate constant, and
reaction order. Half-life, a term commonly used with regard to the fate of
contaminants in the environment, is also described.
IV.2.1 Rate equations
In addition to the mass balance concept, the other relationship required for
design of a homogeneous reactor is the reaction rate equation. The following
general mathematical expression describes the rate that the concentration of
species
A, C
A
,
is changing with time:
[Eq. IV.2.1]
where
n
is the reaction order,
k
is the reaction rate constant, and
γ
A
is the
rate of conversion of species
A.
If the reaction order,
n,
is equal to 1, it is
C
C
eCCe
o
QVt
o
QVt
==
−−(/) (/)
or
γ
A
A
A
n
dC
dt
kC==−
©1999 CRC Press LLC
called a first-order reaction. It implies that the reaction rate is proportional
to the concentration of the species. In other words, the higher the compound
concentration, the faster the reaction rate. The first-order kinetics is applica-
ble for many environmental engineering applications. Consequently, discus-
sions in this book are focused on the first-order reactions and their applica-
tions. The first-order reaction can then be written as
[Eq. IV.2.2]
The rate constant itself provides valuable information regarding the
reaction. A larger
k
value implies a faster reaction rate, which, in turn,
demands a smaller reactor volume in order to achieve a specified conversion.
The value of
k
varies with temperature. In general, the higher the tempera-
ture, the larger the
k
value will be for a reaction.
What would be the units of the reaction rate constant for a first-order
reaction? Let us take a close look at Eq. IV.2.2. In that equation the unit for
dC
A
/dt
is concentration/time and that of
C
is concentration; therefore, the
unit of
k
should be 1/time. Consequently, if a reaction rate is given as 0.25
d
–1
, the reaction should be a first-order reaction. The units of
k
for zeroth-
order reactions and second-order reactions should be [(concentration)/time]
and [(concentration)(time)]
–1
, respectively.
Eq. IV.2.2 tells us that the concentration of compound
A
is changing with
time. This equation can be integrated between
t
= 0 and time
t:
[Eq. IV.2.3]
where
C
A
0
is the concentration of compound
A
at
t
= 0, and
C
A
is the
concentration at time
t.
Example IV.2.1A Estimate the rate constant from two known
concentration values
An accidental gasoline spill occurred at a site 5 days ago. The TPH concen-
tration at a specific location in soil dropped from an initial 3000 mg/kg to
the current 2550 mg/kg. The decrease in concentration is mainly attributed
to natural biodegradation and volatilization. Assume that both removal
mechanisms are first-order reactions and the reaction rate constants for both
mechanisms are independent of contaminant concentration and are constant.
Estimate how long it will take for the concentration to drop below 100 mg/kg
by these natural attenuation processes.
γ
A
A
A
dC
dt
kC==−
ln
C
C
kt or
C
C
e
A
A
A
A
kt
00
=− =
−
©1999 CRC Press LLC
Strategy.
Only the initial concentration and the concentration at day
5 are given. We need to take a two-step approach to solve the problem: first
determine the rate constant and then use the rate constant to determine the
time needed to reach a final concentration of 100 mg/kg.
Two removal mechanisms are occurring at the same time, they are both
first order. They can be represented by one single equation and one combined
rate constant.
[Eq. IV.2.4]
Solution:
a. Insert the initial concentration and the concentration at day 5 into Eq.
IV.2.3 to obtain
k:
So,
k
= 0.0325/d
b. For the concentration to drop below 100 mg/kg, it will take (from Eq.
IV.2.3):
t
= 105 days
Example IV.2.1B Estimate the rate constant from two known
concentration values
The soil of a subject site was contaminated by an accidental spill of gasoline.
A soil sample, taken 10 days after removal of the polluting source, showed
a concentration of 1200 mg/kg. The second sample taken at 20 days showed
a drop of concentration, at 800 mg/kg. Assuming that a combination of all
the removal mechanisms including volatilization, biodegradation, and oxi-
dation show first-order kinetics, estimate how long it will take for the con-
centration to drop below 100 mg/kg without any remediation measures
taken.
Strategy.
Two concentrations at two different time steps are given. We
should take a two-step approach to solve the problem. We need to determine
the initial concentration and
k
first (two equations for the two unknowns).
dC
dt
kC kC k k C kC=− − =− + =−
12 12
()
ln ( )
2550
3000
5=−k
ln . ( )
100
3000
0 0325=− t
©1999 CRC Press LLC
Solution:
a. Determine the initial concentration (immediately after the spill) and
k.
At
t
= 10 days, insert the concentration value into Eq. IV.2.3
At
t
= 20 days, insert the concentration value into Eq. IV.2.3
Dividing both sides of the first equation by the corresponding sides
of the second equation, we can obtain
Thus,
k
= 0.027/d.
Then
C
i
can be easily determined by inserting the value of
k
into either
of the first two equations:
So,
C
i
= 1572 mg/kg
b. For the concentration to drop below 100 mg/kg, it will take
t
= 102 days
IV.2.2 Half-life
The half-life can be defined as the time it takes to convert one-half of the
compound of concern. For the first-order reaction, the half-life (often shown
1200
10
C
e
i
k
=
− ()
800
20
C
e
i
k
=
− ()
1200
800
15
10 25 10 25 15
== ÷ = =
−−−−−
.
()
eee e
kk kkk
1200
0 763
0 027 10
C
e
i
==
−( . )( )
.
100
1572
0 0636
0 027
==
−
.
.
e
t
©1999 CRC Press LLC
as
t
1/2
) can be found from Eq. IV.2.3 by substituting
C
A,t
by one half of
C
A,0
,
i.e., (0.5)(
C
A,
0
),
[Eq. IV.2.5]
Example IV.2.2A Half-life calculation
The half-life of 1,1,1-trichloroethane (1,1,1-TCA) in a subsurface environment
was determined to be 180 days. Assume that all the removal mechanisms
are first order. Determine (1) the rate constant and (2) the time needed to
drop the concentration down to 10% of the initial concentration.
Solution:
a. The rate constant can be easily determined from Eq. IV.2.5 as
Thus,
k
= (3.85
×
10
–3
)/d
b. Use Eq. IV.2.3 to determine the time needed to drop the concentration
down to 10% of the initial (i.e.,
C
= 0.1
×
C
i
).
Therefore,
t
= 598 days
Example IV.2.2B Half-life calculation
In some occasions, the decay rate is expressed as
T
90
instead of t
1/2
. T
90
is the
time required for 90% of the compound to be converted (or the concentration
to drop to 10% of the initial value). Derive an equation to relate T
90
with the
first-order reaction rate constant.
Solution:
The relationship between T
90
and k can be determined from Eq. IV.2.3 as
t
kk
12
2 0 693
/
ln .
==
t
k
12
180
0 693
/
.
==
C
C
e
i
Et
==
−−
1
10
385 3( . )( )
©1999 CRC Press LLC
Then,
[Eq. IV.2.6]
IV.3 Types of reactors
Reactors are typically classified based on their flow characteristics and the
mixing conditions within the reactor. Reactors may be operated in either a
batchwise or a continuous-flow mode. In a batch reactor, the reactor is
charged with the reactants, the contents are well mixed and left to react, and
then the resulting mixture is discharged. The batch reactor is considered as
an unsteady-state reactor because the composition of the reactor content
changes with time. The capital cost of a batch reactor is usually less that that
of a continuous-flow reactor, but it is very labor intensive and operating
costs are much higher. It is usually limited to small installations and to cases
when raw materials are expensive.
In a continuous-flow reactor, the feed to the reactor and the discharge
from it are continuous. In most of the cases the flow reactors are operated
under steady-state conditions in which the feed stream flow rate, its com-
position rate, the reaction condition in the reactor, and the withdrawal rate
are constant with respect to time. Frequently, reaction kinetics are studied
in the laboratory using a batch reactor to determine the rate constant, k. The
application of the kinetic constant, k, to the design of a continuous-flow
reactor, however, involves no changes in kinetic principles; thus, it is valid.
In general, there are two ideal types of flow reactors: continuous flow stirred
tank reactor (CFSTR) and plug flow reactor (PFR). They are classified by the
mixing conditions within the reactors.
The CFSTR consists of a stirred tank that has a feed stream(s) of the
reactants and a discharge stream(s) of reacted materials. The CFSTR is usu-
ally round, square, or slightly rectangular in plan view, and it is necessary
to provide sufficient mixing. The stirring of a CFSTR is extremely important,
and it is assumed that the fluid in the reactor is perfectly mixed, that is, the
contents are uniform throughout the reactor volume. As a result of mixing,
the composition of the discharge stream(s) is the same as that of the reactor
contents. Therefore, it is also called a completely stirred tank reactor (CSTR)
or completely mixed flow reactor (CMF). Under steady-state conditions, the
effluent concentration and concentration at any location within the reactor
are the same and should not change with time.
The PFR ideally has the geometric shape of a long tube or tank and has
a continuous flow in which the fluid particles pass through the reactor in
series. The reactants enter at the upstream end of the reactor, and the prod-
C
C
e
i
kT
==
−
1
10
90
T
kk
90
01 230
=
−
=
ln( . ) .
©1999 CRC Press LLC
ucts leave at the downstream end. Ideally, there is no induced mixing
between elements of fluid along the direction of flow. Those fluid particles
that enter the reactor first will leave first. The composition of the reacting
fluid changes in the direction of flow. For the case of contaminant removal
or destruction, the concentration will be the highest at the entrance and
dropped continuously to the effluent value at the exit condition. Under
steady-state conditions, the effluent concentration and concentration at any
location within the reactor should not change with time.
It should be noted that CFSTRs and PFRs are ideal reactors. The contin-
uous flow reactors in the real world behave somewhere between these ideal
cases.
IV.3.1 Batch reactors
Let us consider a batch reactor with a first-order reaction. By combining Eq.
IV.2.2 and Eq. IV.1.3, the mass balance equation can be expressed as:
[Eq. IV.3.1]
It is a first-order differential equation, and it can be integrated with the
initial condition (C = C
i
at t = 0) and the final condition (C = final concen-
tration, C
f
at t = residence time, τ). The residence time, τ, can be defined as
the time that the fluid stays inside the reactor and undergoes reaction. The
integral of Eq. IV.3.1 is
[Eq. IV.3.2]
Table IV.3.A summarizes the design equations for batch reactors in which
zeroth-, first-, and second-order reactions take place.
Table IV.3.A Design Equations for Batch Reactors
Reaction order, n Design equation
0 C
f
= C
i
– kτ [Eq. IV.3.3]
1 C
f
= C
i
(e
–kτ
) same as [Eq. IV.3.2]
2 [Eq. IV.3.4]
V
dC
dt
VVkC
dC
dt
kC
=×=−
=−
()()γ
or
C
C
eCCe
f
i
k
f
i
k
==
−−ττ
( )or
C
C
kC
f
i
i
=
+1()τ
©1999 CRC Press LLC
Example IV.3.1A Batch reactor (determine the required residence
time with known rate constant)
A batch reactor is to be designed to treat soil contaminated with 200 mg/kg
of PCBs. If the required removal, conversion, or reduction of PCBs is 90%
and the rate constant is 0.5 hr
–1
, what is the required residence time for the
batch reactor? What is the required residence time if the desired final con-
centration is 10 mg/kg?
Strategy
1. There are four parameters in the equation for the batch reactor: two
concentrations, k, and time. We need to know three of the four to
determine the one left.
2. Although the order of the reaction is not mentioned in the problem
statement, it is assumed to be a first-order reaction because the di-
mensions of k are [1/(time)].
Solution:
a. For a 90% reduction (η = 90%):
C
f
= C
i
(1 – η) = 200 (1 – 90%) = 20 mg/kg
Insert the known values into Eq. IV.3.2,
τ = 4.6 hr
b. To achieve a final concentration of 10 mg/kg:
τ = 6.0 hr
Example IV.3.1B Batch reactor (determine the required residence
time with unknown rate constant)
A batch reactor was installed to remediate PCB-contaminated soil. A test run
was conducted with an initial PCB concentration of 250 mg/kg. After 10
hours of batchwise operation, the concentration was dropped to 50 mg/kg.
However, it is required to reduce the concentration down to 10 mg/kg.
Determine the required residence time to achieve the final concentration of
10 mg/kg.
20
200
01
05
==
−
.
(.)
e
t
10
200
005
05
==
−
.
(.)
e
t
©1999 CRC Press LLC
Strategy. It requires a two-step approach to solve the problem. The first
is to determine the rate constant using the given information. Then, use this
obtained k value to estimate the residence time for other conversions. The
given information did not tell us the order of the reaction. We assume that it
is a first-order reaction. This should be confirmed with additional test data.
Solution:
a. Insert the known values into Eq. IV.3.2 to find the value of k:
k = 0.161 hr
–1
b. The time required to achieve a concentration of 10 mg/kg:
τ = 20.0 hours
Discussion. It is assumed that the first-order reaction applies in this
calculation. One should check the validity of this assumption, for example,
by running the pilot-run longer or running a bench-scale batchwise experi-
ment. For example, if the run is extended to 20 hours and the final concen-
tration is close to 10 mg/kg, the assumption of first-order kinetics should
be valid.
Example IV.3.1C Determine the rate constant from batch
experiments
An in-vessel bioreactor is designed to remediate soils contaminated with
cresol. A bench-scale batch reactor was set up to determine the reaction order
and rate constant. The following concentrations of cresol in the batch reactor
at various times were observed and recorded as
Time (hours) Cresol concentration (mg/kg)
0 350
0.5 260
1 200
2 100
517
50
250
020
10
==
−
.
()
e
k
10
250
004
0 161
==
−
.
.
e
t
©1999 CRC Press LLC
Use these data to determine the reaction order and the value of the rate
constant.
Strategy. To determine the reaction order, a trial and error approach
is often taken. From Table IV.3.A, if it is a zeroth-order reaction, the plot of
concentration vs. time should be a straight line. The plot of ln(C) vs. time
should be a straight line for first-order kinetics. If it is second order, the plot
of (1/C) vs. time will be a straight line. The value of k is then obtained from
the slope of the line.
Solution:
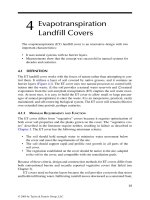
Many reactions of environmental concern are first-order reactions. First
assume that it is first order and plot the concentration-time data on a semilog
scale (Figure E. IV.3.1C).
A straight line fits the data very well, so the assumption of first-order
kinetics is valid. The slope of the straight line can be determined as 0.263/hr.
It should be noted that the rate constant in Eq. IV.2.3 is based on exponential
with base e, and the plot in the figure is based on log
10
. Consequently, the
value of k to be used in Eq. IV.2.3 should be the product of the slope from
the semilog
10
plot and 2.303 (which is the natural log of 10), that is,
k = (0.263)(2.303) = 0.606/hr.
Discussion. Using the obtained rate constant and the initial concen-
tration to calculate the concentration at other time t can serve as a check on
the value. For example, the concentration, at t = 2 hours, can be calculated
as (Eq. IV.3.2)
C
f
= 350(e
–(0.606)(2)
) = 104 mg/kg
Figure E.IV.3.1C Concentration vs. time.
©1999 CRC Press LLC
The calculated concentration, 104 mg/kg, is reasonably close to the
reported experimental value, 100 mg/kg.
Example IV.3.1D Batch reactor with second-order kinetics
A batch reactor is to be designed to treat soil contaminated with 200 mg/kg
of PCBs. The required removal, conversion, or reduction of PCBs is 90%. If
the rate constant is 0.5[(mg/kg)(hr)]
–1
, what is the required residence time
for the batch reactor?
Strategy. Although the order of the reaction is not mentioned in the
problem statement, it is assumed to be a second-order reaction because the
dimensions of k are [(mg/kg)(hr)]
–1
.
Solution:
a. For a 90% reduction (η = 90%),
C
f
= 200 (1 – 90%) = 20 mg/kg
b. Insert the known values into Eq. IV.3.2:
τ = 0.09 hr
Discussion. The only difference between the reactors in Examples
IV.3.1A and IV.3.1D is the reaction kinetics. With the same numerical value
of the reaction rate constants, the required residence time to achieve the same
conversation rate is much shorter in the reactor with second-order kinetics.
IV.3.2 CFSTRs
Let us now consider a steady-state CFSTR with a first order reaction. As
mentioned earlier, by definition, the concentration in the effluent from a
CFSTR is the same as that in the tank, and the concentration in the tank is
uniform and constant. Under steady-state conditions, the flow rate is con-
stant and Q
in
= Q
out
. By inserting Eq. IV.2.2 into Eq. IV.1.4, the mass balance
equation can be expressed as:
[Eq. IV.3.5]
20
200
1 0 5 200
=
+ (. )τ
0 =− +−
=− +−
QC QC V kC
QC QC V kC
in out reactor
in out out
()( )
()( )
©1999 CRC Press LLC
With a simple mathematical manipulation, Eq. IV.3.5 can be rearranged as
[Eq. IV.3.6]
Table IV.3.B summarizes the design equations for CFSTRs in which
zeroth-, first-, and second-order reactions take place.
Example IV.3.2A A soil slurry reactor with first-order kinetics
(CFSTR)
A soil slurry reactor is used to treat soils contaminated with 1200 mg/kg of
TPH. The required final soil TPH concentration is 50 mg/kg. From a bench-
scale study, the rate equation is
γ = –0.25 C in mg/kg/min
The contents in the reactor are fully mixed. Assume that the reactor
behaves as a CFSTR. Determine the required residence time to reduce the
TPH concentration to 50 mg/kg.
Strategy. The format of the rate equation is a first-order reaction, and
the reaction rate constant, k, is equal to 0.25/min.
Solution:
Insert the known values into Eq. IV.3.6 to find out the value of τ:
τ = 92 minutes
Table IV.3.B Design Equations for CFSTRs
Reaction order, n Design equation
0 C
out
= C
in
– kτ [Eq. IV.3.7]
1 same as [Eq. IV.3.6]
2 [Eq. IV.3.8]
C
C kV Q k
out
in
=
+
=
+
1
1
1
1(/) τ
C
Ck
out
in
=
+
1
1 τ
C
C kC
out
in out
=
+
1
1()τ
C
C
out
in
==
+
50
1200
1
1025. τ
©1999 CRC Press LLC
Example IV.3.2B A low temperature heating soil reactor with
second-order kinetics (CFSTR)
A low temperature heating soil reactor is used to treat soil contaminated
with 2500 mg/kg of TPH. The required final soil TPH concentration is 100
mg/kg. From a bench-scale study, the rate equation is
γ = –0.12 C
2
in mg/kg/hr
The reactor is rotated to achieve good mixing. Assume that the reactor
behaves as a CFSTR. Determine the required residence time to reduce the
TPH concentration to 100 mg/kg.
Strategy. The format of the rate equation is a second-order reaction,
and the reaction rate constant, k, is equal to 0.12/(mg/kg)(hr).
Solution:
Insert the known values into Eq. IV.3.8, to find out the value of τ:
τ = 0.92 hours = 55 minutes
IV.3.3 PFRs
Let us now consider a steady-state PFR with a first-order reaction. As men-
tioned earlier, by definition, there is no longitudinal mixing within the PFR.
The concentration in the reactor (C
reactor
) decreases from C
in
at the inlet point
to C
out
at the exit. Under the steady-state condition, the flow rate is constant
and Q
in
= Q
out
. By inserting Eq. IV.2.2 into Eq. IV.1.4, the mass balance
equation can be expressed as
[Eq. IV.3.9]
The C
reactor
is a variable. The equation can be solved by considering an
infinitesimal section of the reactor and integrating the equation. The solution
can be expressed as:
[Eq. IV.3.10]
Table IV.3.C summarizes the design equations for PFRs in which zeroth-,
first-, and second-order reactions take place.
C
C
out
in
==
+
100
1200
1
1 0 12 100.()τ
0 =− +−QC QC V kC
in out reactor
()( )
C
C
ee
out
in
kV Q k
==
−−(/) τ
©1999 CRC Press LLC
When comparing the design equations for PFRs in Table IV.3.C and for
CFSTRs in Table IV.3.B, the following can be derived:
1. The zeroth-order reaction: The design equations are identical for both
reactor types. It means that the conversion rate is independent of the
reactor types, provided all the other conditions are the same.
2. The first-order reaction: The ratio of the outlet and inlet concentration
is linearly proportional to the inverse of time for CFSTRs, and it is
inversely and exponentially proportional to time for PFRs. In other
words, the outlet concentration from PFRs decreases more sharply
with increase of the residence time than that from CFSTRs, provided
all the other conditions are the same. We can also say that, for a given
residence time (or reactor size), the effluent concentration from a PFR
would be lower than that from a CFSTR. (More discussions and ex-
amples will be given later in this section.)
3. Second-order reaction: The design equations for the second-order
reactions are similar in format. The only difference is the C
out
in the
denominator on the right-hand side of Eq. IV.3.8 is replaced by C
in
in
Eq. IV.3.12. With a smaller value of C
out
over C
in
, the C
out
/C
in
ratio of a
PFR will be smaller than that of a CFSTR. The smaller C
out
/C
in
ratio
means that the effluent concentration would be lower for the same
influent concentration.
Example IV.3.3A A soil slurry reactor with first-order kinetics
(PFR)
A soil slurry reactor is used to treat soils contaminated with 1200 mg/kg of
TPH. The required final soil TPH concentration is 50 mg/kg. From a bench-
scale study, the rate equation is
γ = –0.25 C in mg/kg/min
Assume that the reactor behaves as a PFR. Determine the required res-
idence time to reduce the TPH concentration to 50 mg/kg.
Table IV.3.C Design Equations for PFRs
Reaction order, n Design equation
0 C
out
= C
in
– kτ [Eq. IV.3.11]
1 C
out
= C
in
(e
– kτ
) same as [Eq. IV.3.10]
2 [Eq. IV.3.12]
C
C
kC
out
in
in
=
+1()τ
©1999 CRC Press LLC
Strategy. The format of the rate equation is a first-order reaction, and
the reaction rate constant, k, is equal to 0.25/min.
Solution:
Insert the known values into Eq. IV.3.10 to find the value of τ:
τ = 12.7 minutes
Discussion. For the same inlet concentration and reaction rate con-
stant, the required residence time to achieve a specified final concentration
for a PFR, 12.7 minutes, is much smaller than that for a CFSTR, 92 minutes
(see Example IV.3.2A).
For the first-order kinetics, the reaction rate is proportional to the con-
centration (i.e., γ = KC
reactor
). The higher the reactor concentration, the higher
the reaction rate. For CFSTRs, by definition, the reactor concentration is equal
to the effluent concentration (i.e., 50 mg/kg in this case). For PFRs, by
definition, the reactor concentration decreases from C
in
(1200 mg/kg) at the
inlet to C
out
(50 mg/kg) at the outlet. The average concentration in the PFR
(625 mg/kg as the arithmetic average or 245 as the geometric average) is
much higher than 50 mg/kg, which makes the reaction rate much higher.
Consequently, the required residence time would be much shorter.
Example IV.3.3B A low temperature heating soil reactor with
second-order kinetics (PFR)
A low-temperature heating soil reactor is used to treat soils contaminated
with 2500 mg/kg of TPH. The required final soil TPH concentration is 100
mg/kg. From a bench-scale study, the rate equation is
γ = –0.12 C
2
in mg/kg/hr
The soils are carried through the reactor on a conveyor belt. Assume that
the reactor behaves as a PFR. Determine the required residence time to
reduce the TPH concentration to 100 mg/kg.
Strategy. The format of the rate equation is a second-order reaction,
and the reaction rate constant, k, is equal to 0.12/(mg/kg)(hr).
Solution:
Insert the known values into Eq. IV.3.12 to find the value of τ
C
C
e
out
in
==
−
50
1200
025(. )τ
©1999 CRC Press LLC
τ = 0.08 hours = 4.8 minutes.
Discussion. Again, for the same inlet concentration and reaction rate
constant, the required residence time to achieve a specified final concentra-
tion for a PFR, 4.8 minutes, is much smaller than that for a CFSTR, 55 minutes
(see Example IV.3.2B).
IV.4 Sizing the reactors
Once the reactor type is selected and the required residence time to achieve
the specified conversion is determined, sizing a reactor is straightforward.
The longer the compound stays inside a reactor to achieve the desired con-
version (i.e., the longer the residence time), the larger the reactor needed for
a given flow rate.
For flow reactors such as CFSTRs and PFRs, the residence time, or the
hydraulic detention time, τ, can be defined as
[Eq. IV.4.1]
where V is the volume of the reactor and Q is the flow rate. For a PFR, by
definition, each fluid particle should spend exactly the same amount of time
flowing through the reactor. On the other hand, for a CFSTR, most fluid
particles would flow through the reactor in a shorter or longer time than the
average retention time. Therefore, the value of τ in Eq. IV.4.1 is the average
hydraulic retention time and is used in determining the size of the reactor.
For a batch reactor, the residence time calculated from Eqs. IV.3.2, IV.3.3,
and IV.3.4 is the actual time needed for the reaction to be complete. To size
the reactor, an engineer needs to include the time needed for loading, cool
down, and unloading.
Example IV.4A Sizing a batch reactor
A soil slurry batch reactor is used to treat soils contaminated with 1200
mg/kg of TPH. It is necessary to treat the slurry at 30 gal/min. The required
final soil TPH concentration is 50 mg/kg. From a bench-scale study, the rate
equation is
γ = –0.05 C in mg/kg/min
C
C
out
in
==
+
100
1200
1
1 0 12 1200.( )τ
τ=
V
Q
©1999 CRC Press LLC
The time required for loading and unloading the slurry for each batch
is 2 hours. Size the batch reactor for this project.
Strategy. The format of the rate equation is a first-order reaction, and
the reaction rate constant, k, is equal to 0.05/min.
Solution:
a. Insert the known values into Eq. IV.3.2 to find the value of τ:
τ = 64 min (needed for reaction)
b. The total time needed for each batch = reaction time + time for loading
and unloading = 64 + 120 = 184 minutes.
c. The required reactor volume, V = (τ)Q (from Eq. IV.4.1)
= (64 min)(30 gal/min) = 1920 gal
Discussion. A minimum of three reactors (1920 gallons each) are
needed in this case. The reactors are operated in different phases; while two
are in loading or unloading phases, the other one will be in active reaction
phase. Consequently, the influent flow will not be interrupted.
Example IV.4B Sizing a CFSTR
A soil slurry reactor is used to treat soils contaminated with 1200 mg/kg of
TPH. It is necessary to treat the slurry at 30 gal/min. The required final soil
TPH concentration is 50 mg/kg. From a bench-scale study, the rate equation is
γ = –0.05 C in mg/kg/min
The contents in the reactor are fully mixed. Assume that the reactor
behaves as a CFSTR. Size the CFSTR for this project.
Solution:
a. Insert the known values into Eq. IV.3.6 to find the value of τ:
τ = 460 minutes
C
C
e
out
in
==
−
50
1200
005(. )τ
C
C
out
in
==
+
50
1200
1
1005(. )τ
©1999 CRC Press LLC
b. The required reactor volume,
V = (τ)Q (from Eq. IV.4.1) = (460 min)(30 gal/min) = 13,800 gal.
Example IV.4C Sizing a PFR
A soil slurry reactor is used to treat soils contaminated with 1200 mg/kg of
TPH. It is necessary to treat the slurry at 30 gal/min. The required final soil
TPH concentration is 50 mg/kg. From a bench-scale study, the rate equation is
γ = –0.05 C in mg/kg/min
Assume that the reactor behaves as a PFR. Size the PFR for this project.
Solution:
a. Insert the known values into Eq. IV.3.10 to find the value of τ
τ = 64 minutes
b. The required reactor volume, V = (τ)Q (from Eq. IV.4.1)
= (64 minutes)(30 gal/min) = 1920 gal
Discussion
1. To achieve the same conversion, the size of the PFR, 1920 gal (this
example), is much smaller than 13,800 gal for the CFSTR (Example
IV.4.B). The other advantage of PFRs is that all the influent flow receives
the same residence time. This is extremely important for processes such
as disinfection in a chlorine contact tank, in which all the fluid parcels
should stay in the tank long enough to achieve the required kill. On
the other hand, the complete mixing in the tank of the CFSTRs provides
a great endurance to shock load. This is favorable for processes such
as biological processes that are sensitive to shock load.
2. The design equations for batch reactors and PFRs are essentially the same.
The required reaction times for these two reactors are the same, at 64
minutes. The actual tankage of the PFR is much smaller because loading
and unloading need not be included in operation of flow reactors.
IV.5 Reactor configurations
In practical engineering applications, it is more common to have a few
smaller reactors than to have one large reactor for the following reasons:
C
C
e
out
in
==
−
50
1200
005(. )τ
©1999 CRC Press LLC
• Flexibility (to handle fluctuations of flow rate)
• Maintenance considerations
• A higher removal efficiency
Common reactor configurations include arrangement of reactors in
series, in parallel, or a combination of both.
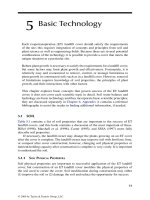
IV.5.1 Reactors in series
For reactors in series, the flow rates to all the reactors are the same and equal
to the influent flow rate to the first reactor, Q (Figure IV.5A). The first reactor,
with a volume V
1
, will reduce the influent contaminant concentration, C
o
,
and yields an effluent concentration, C
1
. The effluent concentration from the
first reactor becomes the influent concentration to the second reactor. Con-
sequently, the effluent concentration from the second reactor, C
2
, becomes
the influent concentration to the third reactor. More reactors can be added
in series until the effluent concentration from the last reactor in the series
meets the requirement. For CFSTRs, a few small reactors in series will yield
a lower final effluent concentration than a large reactor with the same total
volume. This will be illustrated by examples in this section.
For three CFSTRs arranged in series, the effluent concentration from the
third reactor of CFSTRs in series can be determined from the contaminant
concentration in the raw waste stream as
[Eq. IV.5.1]
For three PFRs arranged in series, the effluent concentration from the
third reactor of CFSTRs in series can be determined from the contaminant
concentration in the raw waste stream as
[Eq. IV.5.2]
Figure IV.5A Three reactors in series.
C
C
C
C
C
C
C
C kkk
o
33
2
2
1
1
0332211
1
1
1
1
1
1
=
=
+
+
+
τττ
C
C
C
C
C
C
C
C
eee e
o
k
kk
kk k
33
2
2
1
1
0
33
22 11
11 22 3 3
=
==
−
−−
−++
()()()
()τ
ττ
τττ
©1999 CRC Press LLC
Example IV.5.1A CFSTRs in series
Subsurface soil at a site is contaminated with diesel fuel at a concentration
of 1800 mg/kg. Above-ground remediation, using slurry bioreactors, is pro-
posed. The treatment system is required to handle a slurry flow rate of 0.04
m
3
/min. The required final diesel concentration in the soil is 100 mg/kg.
The reaction is first-order with a rate constant 0.1/min, as determined from
a bench-scale study.
Four different configurations of slurry bioreactors in the CFSTR mode
are considered. Determine the final effluent concentration from each of these
arrangements and if it meets the cleanup requirement:
a. One 4-m
3
reactor
b. Two 2-m
3
reactors in series
c. One 1-m
3
reactor followed by one 3-m
3
reactor
d. One 3-m
3
reactor followed by one 1-m
3
reactor
Solution:
a. For the 4-m
3
reactor, the residence time = V/Q = 4 m
3
/(0.04 m
3
/min)
= 100 minutes.
Use Eq. IV.3.6 to find the final effluent concentration
C
out
= 164 mg/kg. (It exceeds the cleanup level.)
b. For the two 2-m
3
reactors, the residence time = V/Q = 2 m
3
/(0.04
m
3
/min) = 50 minutes each.
Use Eq. IV.5.1 to find the final effluent concentration
C
C
C
out
in
out
==
+1800
1
1 0 1 100( . )( )
C
C
CC
C
C
C
o
22 2
1
1
0
1800
1
10150
1
10150
=
=
=
+
+
(.)( ) (.)( )