Advances in Theory and Applications of Stereo Vision Part 9 pdf
Bạn đang xem bản rút gọn của tài liệu. Xem và tải ngay bản đầy đủ của tài liệu tại đây (2.35 MB, 25 trang )
Advances in Theory and Applications of Stereo Vision
190
Those two problems make it very difficult to detect or to recognize objects in water by
observing their textures and colors.
As to these two problems, theories or methods for aerial environments can be expanded for
underwater sensing. Several image processing techniques can be effective for removing
adherent noises. Color information can be also restored by considering reflection,
absorption, and scattering phenomena of light in theory (Hulburt, 1945). Indeed, we have
already proposed underwater sensing methods for the view-disturbing noise problem
(Yamashita et al., 2006) and the light attenuation problem (Yamashita et al., 2007).
The third problem is about the refraction effects of light. If cameras and objects are in the
different condition where the refraction index differs from each other, several problems
occur and a precise measurement cannot be achieved.
For example, Fig. 1(c) shows an image of a duck model when water is filled to the middle. In
this case, contour positions of the duck model above and below the water surface looks
discontinuous and disconnected, and its size and the shape look different between above
and below the water surface. This problem occurs not only when a vision sensor is set
outside the liquid but also when it is set inside, because in the latter case we should usually
place a protecting glass plate in front of viewing lens.
As to the light refraction problem, three-dimensional (3-D) measurement methods in aquatic
environments are also proposed (Coles, 1988; Tusting & Davis, 1992; Pessel et al., 2003; Li et
al., 1997; Yamashita et al., 2010). However, techniques that do not consider the influence of
the refraction effects (Coles, 1988; Tusting & Davis, 1992; Pessel et al., 2003) may have the
problems of accuracy.
Accurate 3-D measurement methods of objects in liquid with a laser range finder (Yamashita
et al., 2003; Yamashita et al., 2004; Kondo et al., 2004; Yamashita et al., 2005) and with a light
projection method (Kawai et al., 2009) by considering the refraction effects are also
proposed. However, it is difficult to measure moving objects with these methods.
A stereo camera system is suitable for measuring moving objects, though the methods by
using a stereo camera system (Li et al., 1997) have the problem that the corresponding points
are difficult to detect when the texture of the object's surface is simple in particular when
there is the refraction on the boundary between the air and the liquid. The method by the
use of motion stereo images obtained with a moving camera (Saito et al., 1995) also has the
problem that the relationship between the camera and the object is difficult to estimate
because the camera moves. The surface shape reconstruction method of objects by using an
optical flow (Murase, 1992) is not suitable for the accurate measurement, too.
By using properly calibrated stereo systems, underwater measurements can be achieved
without knowing the refraction index of the liquid. For example, we can make a calibration
table of relations between distances and pixel positions in advance and utilize this table for
3-D measurement (Kondo et al., 2004). However, the calibration table is useless when the
refractive index of liquid changes.
Therefore, the most critical problem in aquatic environments is that previous studies cannot
execute the 3-D measurement without the information of the refractive index of liquid (Li et
al., 1997; Yamashita et al., 2006). It becomes difficult to measure precise positions and shapes
of objects when unknown liquid exists because of the image distortion by the light
refraction.
Accordingly, it is very important to estimate the refractive index for underwater sensing
tasks.
Stereo Measurement of Objects in Liquid and Estimation
of Refractive Index of Liquid by Using Images of Water Surface
191
In this paper, we propose a new 3-D measurement method of objects in unknown liquid
with a stereo vision system. The refractive index of unknown liquid is estimated by using
images of water surface (Fig. 2). Discontinuous and disconnected edges of the object in the
image of the water surface can be utilized for estimating the refractive index. A 3-D shape of
the object in liquid is measured by using the estimated refractive index in consideration of
refractive effects. In addition, images that are free from refractive effects of the light are
restored from distorted images.
Our proposed method is easy to apply to underwater robots. If there is no information
about refractive index of work space of an underwater robot, the robot can know the
refractive index and then measure underwater objects only by broaching and acquiring an
image of water surface.
The composition of this paper is detailed below. In Section 2, an estimation method of the
refractive index is explained. In Sections 3 and 4 describe a 3-D measurement and image
restoration method that are based on the ray tracing technique, respectively. Sections 5 and
6 mention about experiments and discussion. Section 7 describes conclusions.
2. Estimation of refractive index
There is the influence of the light refraction in liquid below the water surface, while there is
no influence above the water surface. An image below the water surface is distorted in
consequence of the light refraction effect in liquid, and that above the water surface is not
distorted (Fig. 2). Therefore, such discontinuous contour indicates the refraction
information. We utilize the difference between edges in air and those in liquid to estimate
the refractive index of the liquid.
Figure 3 shows the top view of the situation around the water surface region when the left
edge of the object is observed from the right camera.
Here, let u
1
be a horizontal distance in image coordinate between image center and the
object edge in air, and u
2
be that in liquid. Note that u
1
is influenced only by the refraction
effect in glass (i.e. camera protection glass), and u
2
is influenced by the refraction effects both
in glass and in liquid (Lower figure in Fig. 3).
Angles of incidence from air to glass in these situations (
1
θ
and
4
θ
) are expressed as
follows:
1
2
1
tan
u
f
θφ
−
=+ (1)
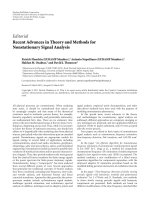
Fig. 2. Stereo measurement of objects in liquid by using images of water surface. An image
below the water surface is distorted in consequence of the light refraction effect in liquid,
and that above the water surface is not distorted.
Advances in Theory and Applications of Stereo Vision
192
Fig. 3. Estimation of refractive index.
1
1
4
tan
u
f
θφ
−
=+ (2)
where
φ
is the angle between the optical axis of the camera and the normal vector of the
glass, and f is the image distance (the distance between the lens center and the image plane),
respectively.
Parameters f and
φ
can be calibrated easily in advance of the measurement, and coordinate
values u
1
and u
2
can be obtained from the acquired image of the water surface. Therefore,
we can calculate
1
θ
and
4
θ
from these known parameters.
By using Snell's law of refraction, angles of refraction (
2
θ
and
5
θ
) are expressed as follows:
12
21
sin
sin
n
n
θ
θ
= (3)
5
1
24
sin
sin
n
n
θ
θ
= (4)
where n
1
is the refractive index of air, and n
2
is that of glass, respectively.
On the other hand, we can obtain a
1
, a
2
, a
3
, and a
4
from the geometrical relationship among
the lens, the glass, and the object.
11
tanad
θ
=
(5)
Stereo Measurement of Objects in Liquid and Estimation
of Refractive Index of Liquid by Using Images of Water Surface
193
22
tanat
θ
=
(6)
35
tanat
θ
= (7)
443
()tanalt a
θ
=
−+ (8)
where d is the distance between the lens center and the glass surface, t is the thickness of the
glass, and l is the distance between the lens center and the object.
Refractive indices n
1
and n
2
can be calibrated beforehand because they are fixed parameters.
Parameters d and t can be calibrated in advance of the measurement, too. This is because we
usually placed a protecting glass in front of the lens when we use a camera in liquid, and the
relationship between the glass and the lens never changes. Parameter l can be gained from
the stereo measurement result of the edge in air.
By using these parameters, angle of refraction from glass to liquid
θ
3
can be calculated as
follow:
421
1
3
tan
aaa
ltd
θ
−
−−
=
−−
(9)
Consequently, refractive index of liquid n
3
can be obtained by using Snell's law.
1
31
3
sin
sin
nn
θ
θ
= (10)
In this way, we can estimate refractive index of unknown liquid n
3
from the image of water
surface, and measure objects in liquid by using n
3
.
3. 3-D measurement
It is necessary to search for corresponding points from right and left images to measure the
object by using the stereo vision system. In our method, corresponding points are searched
for with template matching by using the normalized cross correlation (NCC) method.
After detecting corresponding points, an accurate 3-D measurement can be executed by
considering the refraction effects of light in aquatic environments.
Refractive angles at the boundary surfaces among air, glass and liquid can be determined by
using Snell's law (Fig. 4).
We assume the refractive index of air and the glass to be n
1
and n
2
, respectively, and the
incidence angle from air to the glass to be
1
θ
. A unit ray vector
2222
(,,)
T
d
αβγ
=
G
(T denotes
transposition) travelling in the glass is shown by (11).
21
2
2
111
21 1 1
2
22
2
21
1sin cos
nnn
nn
n
α
αλ
β
βθθμ
γ
γν
⎛⎞ ⎛⎞ ⎛⎞
⎛⎞
⎜⎟ ⎜⎟ ⎜⎟
⎜⎟
=+− −
⎜⎟ ⎜⎟ ⎜⎟
⎜⎟
⎜⎟ ⎜⎟ ⎜⎟
⎝⎠
⎝⎠ ⎝⎠ ⎝⎠
(11)
where
1111
(,,)
T
d
αβγ
=
G
is the unit ray vector of the camera in air and (,,)
T
N
λ
μν
=
G
is a
normal vector of the glass plane. Vector
1
d
G
can be easily calculated from the coordinate
value of the corresponding point, and vector N
G
can be calibrated in advance of the
measurement as described above.
Advances in Theory and Applications of Stereo Vision
194
Fig. 4. 3-D measurement.
A unit ray vector
3333
(,,)
T
d
αβγ
=
G
travelling in liquid is shown by (12).
32
2
2
222
32 3 3
2
33
3
32
1sin cos
nnn
nn
n
α
αλ
β
βθθμ
γ
γν
⎛⎞ ⎛⎞ ⎛⎞
⎛⎞
⎜⎟ ⎜⎟ ⎜⎟
⎜⎟
=+− −
⎜⎟ ⎜⎟ ⎜⎟
⎜⎟
⎜⎟ ⎜⎟ ⎜⎟
⎝⎠
⎝⎠ ⎝⎠ ⎝⎠
(12)
where n
3
is the refractive index of liquid that is estimated in Section 2, and
θ
3
is the angle of
incidence from the glass to liquid, respectively.
An arbitrary point
(,,)
T
pppp
Cxyz=
G
on the ray vector is shown by (13).
32
32
32
p
p
p
x
x
y
c
y
z
z
α
β
γ
⎛⎞
⎛⎞⎛⎞
⎜⎟
⎜⎟⎜⎟
⎜⎟
=+
⎜⎟⎜⎟
⎜⎟
⎜⎟⎜⎟
⎜⎟
⎝⎠⎝⎠
⎝⎠
(13)
where
2222
(,,)
T
Cxyz=
G
is the point on the glass and c is a constant.
Ray from right camer
a
Ray from left camera
C
l
C
r
lC
p
Fig. 5. Ray tracing from two cameras.
Two rays are calculated by ray tracing from the left and the right cameras, and the intersection
of the two rays gives the 3-D coordinates of the target point in liquid. Theoretically, the two
rays intersect at one point on the object surface, however, practically it is not always true
Stereo Measurement of Objects in Liquid and Estimation
of Refractive Index of Liquid by Using Images of Water Surface
195
because of noises and quantization artifacts. Consequently, we select the midpoint of the
shortest line connecting two points each of which belongs to each ray (Fig. 5).
Note that the detail of the solution is explained in (Yamashita et al., 2003).
4. Image restoration
Images that are free from the refraction effects can be generated from distorted images by
using 3-D information acquired in Section 3.
Figure 6 shows the top view of the situation around the water surface region. Here, let e
2
be the
image coordinate value that is influenced by the refraction effect in liquid, and e
1
be the image
coordinate value that is rectified (in other word, free from the refraction effect of liquid). The
purpose is to reconstruct a new image by obtaining e
1
from the observed value e
2
.
In Fig. 6, the image distance (f), the angle between the optical axis of the camera and the
normal vector of the glass (
φ
), the distance between the lens center and the glass (d), the
thickness of the glass (t), the distance between the image center and e
2
(g
2x
), and the distance
between the lens and the object (z
i
) is known parameters.
We can restore the image if g
1x
(the distance between the image center and e
1
) is obtained.
At first, angle of incidence
1x
θ
is expressed as follows:
1
2
1
tan
x
x
g
f
θφ
−
=+
(14))
Angle of refraction from air to glass
2x
θ
and that from glass to liquid
3x
θ
is obtained by
using Snell's law.
1
11
2
2
sin
sin
x
x
n
n
θ
θ
−
= (15)
1
11
3
3
sin
sin
x
x
n
n
θ
θ
−
= (16)
On the other hand, parameters a
1x
, a
2x
, and a
3x
are obtained from the geometrical relationship
in Fig. 6.
11
tan
xx
ad
θ
=
(17)
22
tan
xx
at
θ
=
(18)
3312
()tan
xi xxx
aztd aa
θ
=
−− + + (19)
At the same time, a
3x
can be expressed as follows:
345
()tan tan
xi x x
azt t
θ
θ
=
−+ (20)
Finally, we can obtain the following equation.
1
14
34
2
sin
()tan tansin
x
xi x
n
azt t
n
θ
θ
−
⎛⎞
=− +
⎜⎟
⎜⎟
⎝⎠
(21)
Advances in Theory and Applications of Stereo Vision
196
Fig. 6. Image restoration.
From (21), we can calculate
4x
θ
by numerical way. Therefore, parameter g
1x
is gained by
using obtained
4x
θ
and f.
xx
fg
41
tan
θ
=
(22)
By using g
1x
, the image that is free from the refraction effect can be restored.
The vertical coordinate value after the restoration is also calculated in the same way. In this
way, the image restoration is executed.
However, there may be no texture information around or on the water surface because a
dark line appears on the water surface in images.
Therefore, textures of these regions are interpolated by image inpainting algorithm
(Bertalmio et al., 2000). This method can correct the noise of an image in consideration of
slopes of image intensities, and the merit of this algorithm is the fine reproducibility for
edges.
Finally, we can obtain the restored image both below and around the water surface.
Stereo Measurement of Objects in Liquid and Estimation
of Refractive Index of Liquid by Using Images of Water Surface
197
5. Experiment
We constructed an underwater environment by using a water tank (Fig. 7). It is an
equivalent optical system to sinking the waterproof camera in underwater. We used two
digital video cameras for taking images whose sizes are 720x480pixels. We set the optical
axis parallel to the plane of the water surface.
In the experiment, the geometrical relationship between two cameras and the glass, the
thickness of the glass, and intrinsic camera parameters (Tsai, 1987) were calibrated before
the 3-D measurement in air. These parameters never change regardless of whether there is
water or not.
To evaluate the validity of the proposed method, two objects are measured in liquid whose
refractive index is unknown. Object 1 is a duck model and Object 2 is a cube.
Object 1 (duck model) floated on the water surface, and Object 2 (cube) was put inside the
liquid (Fig. 7).
Figures 8(a) and (b) show acquired left and right images of the water surface, respectively.
At first, the refractive index of unknown liquid (n
3
) is estimated from four edge positions
inside red circles. Table 1 shows the result of estimation. The variation of the results is small
enough to trust, and the average of four results is 1.333, while the ground truth is 1.33
because we used water as unknown liquid.
From this result, it is verified that our method can estimate the refractive index precisely.
(a) Birds-eye view. (b) Front view.
Fig. 7. Overview of experiments.
(a) Left image. (b) Right image.
Fig. 8. Stereo image pair.
Advances in Theory and Applications of Stereo Vision
198
Left camera Right camera
Left edge Right edge Left edge Right edge
Average
1.363 1.335 1.334 1.300 1.333
Table 1. Estimation result of refractive index.
Figure 9 shows the 3-D shape measurement result of Object 1. Figure 9(a) shows the result
without consideration of light refraction effect. There is the disconnection of 3-D shape
between above and below the water surface. Figure 9(b) shows the result by our method.
Continuous shape can be acquired, although the acquired images have discontinuous
contours (Fig. 8).
By using the estimated refractive index, the shape of Object 2 (cube) was measured
quantitatively. When the refractive index was unknown (n
3
= 1.000) and the refraction effect
was not considered, the vertex angle was measured as 111.1deg, while the ground truth was
90.0deg. On the other hand, the result was 90.9deg when the refraction effect was
considered by using the estimated refractive index.
From these results, it is verified that our method can measure accurate shape of underwater
objects.
Figure 10 shows the result of the image restoration. Figure 10(a) shows the original image,
Fig. 10(b) shows extracted result of the object by using color extraction method (Smith et al.,
1996), and Fig. 10(c) shows the restoration result, respectively.
(a) Without consideration. (b) With consideration.
Fig. 9. 3-D measurement results.
(a) Original image. (b) Extraction result. (c) Image restoration result.
Fig. 10. Image restoration results.
Stereo Measurement of Objects in Liquid and Estimation
of Refractive Index of Liquid by Using Images of Water Surface
199
These results show that our method can work well without failure regardless of the
existence of unknown liquid by estimating the refractive index of liquid and considering the
light refraction.
6. Discussion
As to the estimation of the refractive index, the error of the estimation is within 1% through
all experiments.
The accuracy and the stability is very high, however, the proposed method needs image
pairs of the water surface. Therefore, this method may not be applicable directly for deep
water applications, because the refractive index changes little by little when water pressure
and temperature change. On the other hand, we can use the distance between two rays (l in
Fig. 5) for the estimation when water surface images are difficult to obtain. The value of the
refractive index in case that the distance between two rays becomes the smallest is a correct
one. Therefore, the refractive index n
est
can be estimated by using following optimization.
ar
g
min ( )
est i
n
i
nln=
∑
(23)
where l
i
(n) is the calculated distance between two rays at i-th measurement point when the
refractive index is presumed as n. However, this method is not robust because it is very
sensitive to an initial value of the estimation. Therefore, it is better to use both two
approaches for deep water applications; at first in shallow water the refractive index is
estimated by using water surface images, then in deep water by using the distance between
two rays.
As to the refraction effects, they may be reduced by using an individual spherical protective
dome for each camera. However, it is impossible to eliminate the refraction effects.
Therefore, our method is essential to the precise measurement in underwater environments.
As to the image restoration, near the water surface appears an area without information in
form of a black strip. We cannot have information about this area. Therefore, textures of
these regions are interpolated for visibility. Note that 3-D measurement explained in Section
3 can be achieved without the image restoration. Therefore, 3-D measurement results do not
include interpolated results. This means that the proposed method shows both reliable
results that is suitable for underwater recognition and images that have good visibility for
the sake of human operators.
With consideration Without consideration
Average 2.0mm 36.1mm
Standard deviation 0.4mm 1.1mm
Table 2. Accuracy of measurement (position error).
To evaluate the proposed method quantitatively, another well-calibrated objects whose
shapes are known and whose positions were measured precisely in air in advance were
measured in water. Table 2 shows the measurement result. In this experiment,
mis-corresponding points were rejected by a human operator. Position error with
Advances in Theory and Applications of Stereo Vision
200
consideration of the refraction effects is 2.0mm on an average when the distance between
the stereo camera system and the object is 250mm, while the error without consideration
of the refraction effects is 36.1mm. The error in the depth direction was dominant in all
cases.
From these results, it is verified that our method can measure accurate positions of objects in
water.
7. Conclusion
We propose a 3-D measurement method of objects in unknown liquid with a stereo vision
system. We estimate refractive index of unknown liquid by using images of water surface,
restore images that are free from refractive effects of the light, and measure 3-D shapes of
objects in liquids in consideration of refractive effects. The effectiveness of the proposed
method is verified through experiments.
It is expected that underwater robots acquire the refractive index and then measure
underwater objects only by broaching and acquiring an image of water surface in the case of
unknown refractive index by using our method.
8. Acknowledgement
This research was in part supported by MEXT KAKENHI, Grant-in-Aid for Young Scientist
(A), 22680017.
9. References
Yuh, J. & West, M. (2001). Underwater Robotics, Advanced Robotics, Vol.15, No.5,
pp.609-639
Hulburt, E. O. (1945). Optics of Distilled and Natural Water, Journal of the Optical Society of
America, Vol.35, pp.689-705
Stewart, W. K. (1991). Remote-Sensing Issues for Intelligent Underwater Systems,
Proceedings of the 1991 IEEE Computer Society Conference on Computer Vision and
Pattern Recognition (CVPR1991), pp.230-235
Caimi, F. M. (1996). Selected Papers on Underwater Optics, SIPE Milestone Series, Caimi, F.
M. (Ed.), Vol.MS118
Yamashita, A.; Kato, S. & Kaneko, T. (2006). Robust Sensing against Bubble Noises
in Aquatic Environments with a Stereo Vision System, Proceedings of the 2006
IEEE International Conference on Robotics and Automation (ICRA2006), pp.
928-933
Yamashita, A.; Fujii, M. & Kaneko, T. (2007). Color Registration of Underwater Images for
Underwater Sensing with Consideration of Light Attenuation, Proceedings of the
2007 IEEE International Conference on Robotics and Automation (ICRA2007), pp.4570-
4575
Coles, B. W. (1988). Recent Developments in Underwater Laser Scanning Systems, SPIE
Vol.980 Underwater Imaging, pp.42-52
Stereo Measurement of Objects in Liquid and Estimation
of Refractive Index of Liquid by Using Images of Water Surface
201
Tusting, R. F. & Davis, D. L. (1992). Laser Systems and Structured Illumination for
Quantitative Undersea Imaging, Marine Technology Society Journal, Vol.26, No.4,
pp.5-12
Pessel, N.; Opderbecke, J. & Aldon, M J. (2003). Camera Self-Calibration in Underwater
Environment, Proceedings of the 11th International Conference in Central Europe
on Computer Graphics, Visualization and Computer Vision (WSCG2003),
pp.104-110
Li, R.; Li, H.; Zou, W.; Smith, R. G. & Curran, T. A. (1997). Quantitive Photogrammetric
Analysis of Digital Underwater Video Imagery, IEEE Journal of Oceanic Engineering,
Vol.22, No.2, pp.364-375
Yamashita, A.; Shirane, Y. & Kaneko, T. (2010). Monocular Underwater Stereo - 3D
Measurement Using Difference of Appearance Depending on Optical Paths -,
Proceedings of the 2010 IEEE/RSJ International Conference on Intelligent Robots and
Systems (IROS2010)
Yamashita, A.; Hayashimoto, E.; Kaneko, T. & Kawata, Y. (2003). 3-D Measurement of
Objects in a Cylindrical Glass Water Tank with a Laser Range Finder, Proceedings of
the 2003 IEEE/RSJ International Conference on Intelligent Robots and Systems
(IROS2003), pp.1578-1583
Yamashita, A.; Higuchi, H.; Kaneko, T. & Kawata, Y. (2004). Three Dimensional
Measurement of Object's Surface in Water Using the Light Stripe Projection
Method, Proceedings of the 2004 IEEE International Conference on Robotics and
Automation} (ICRA2004), pp.2736-2741
Kondo, H.; Maki, T.; Ura, T.; Nose, Y.; Sakamaki, T. & Inaishi, M. (2004). Relative Navigation
of an Autonomous Underwater Vehicle Using a Light-Section Profiling System,
Proceedings of the 2004 IEEE/RSJ International Conference on Intelligent Robots and
Systems (IROS2004), pp.1103-1108
Yamashita, A.; Ikeda, S. & Kaneko, T. (2005). 3-D Measurement of Objects in Unknown
Aquatic Environments with a Laser Range Finder, Proceedings of the 2005
IEEE International Conference on Robotics and Automation (ICRA2005), pp.
3923-3928
Kawai, R.; Yamashita, A. & Kaneko, T. (2009). Three-Dimensional Measurement of Objects
in Water by Using Space Encoding Method, Proceedings of the 2009 IEEE
International Conference on Robotics and Automation (ICRA2009), pp.2830-2835
Saito, H.; Kawamura, H. & Nakajima, M. (1995). 3D Shape Measurement of Underwater
Objects Using Motion Stereo, Proceedings of 21th International Conference on Industrial
Electronics, Control, and Instrumentation, pp.1231-1235
Murase, H. (1992). Surface Shape Reconstruction of a Nonrigid Transparent Object Using
Refraction and Motion, IEEE Transactions on Pattern Analysis and Machine
Intelligence, Vol.14, No.10, pp.1045-1052
Bertalmio, M.; Sapiro, G.; Caselles, V. & Ballester, C. (2000). Image Inpainting,
ACM Transactions on Computer Graphics (Proceedings of SIGGRAPH2000),
pp.417-424
Advances in Theory and Applications of Stereo Vision
202
Tsai, R. Y. (1987). A Versatile Camera Calibration Technique for High-Accuracy 3D Machine
Vision Metrology Using Off-the-Shelf TV Cameras and Lenses, IEEE Journal of
Robotics and Automation, Vol.RA-3, No.4, pp.323-344
Smith, A. R. & Blinn, J. F. (1996). Blue Screen Matting, ACM Transactions on Computer
Graphics (Proceedings of SIGGRAPH1996), pp.259-268
0
Detecting Human Activity by Location System and
Stereo Vision
Yoshifumi Nishida, Koji Kitamura
National Institute of Advanced Industrial Science and Technology
Japan
1. Introduction
Information processing services centered around human activity in the real world has
attracted increased attention recently (1). Human-centered applications require the facility
to observe and recognize activities as a basis, and the present paper describes a method for
quickly realizing a function for robustly detecting daily human activity events in the real
world.
Generally, the problem of human activity recognition can be formulated as a kind of pattern
recognition problem as follows.
P
(
ˆ
W|Y)=max
W
i
P(Y|W
i
)P(W
i
)
P(Y)
,(1)
where P
(W
i
|Y) denotes the posterior probability that the meaning of an observed behavior
pattern Y is W
i
, P(Y) denotes the probability that a behavior pattern Y will be observed,
P
(W
i
) denotes the probability that the behavior meaning W
i
will occur, and P(Y|W
i
) denotes
the conditional probability. Thus, the problem of human activity recognition becomes that of
searching for the maximum posterior probability P
(
ˆ
W
|Y).
There are three problems in realizing and utilizing a function for recognizing human activity
in the real world: the robust observation of a activity pattern Y, the efficient recognition of
meaning W from the observed pattern, and quick implementation of a function for robustly
observing and efficiently recognizing human activity. Without solving the first problem,
equation (1) cannot be formed. Without tackling the second problem, guaranteeing a solution
to the equation within the time frame demanded by the application is impossible. Without
dealing with the third problem, it is difficult to utilize a funtion for observing and recognizing
human activity for a basis of a real world application or various field researches.
As a method for efficient recognition of activites, the idea of object-based activity recognition
has been proposed (2). In theory, the behavior of handling objects in an environment such
as an office or home can be recognized based on the motion of the objects. However, when
applying the method to real environments, it is difficult to even achieve an adequate level of
object recognition, which is the basis of the method.
Separating the problems of object recognition and activity recognition is becoming
increasingly realistic with the progress in pervasive computing technology such as
microcomputers, sensor, and wireless networks technology. It has now become possible to
resolve object recognition into the problems of sensorizing objects and tagging the objects
11
2 Stereo Vision
with identification codes (IDs), and to address activity recognition separately through the
development of applied technology.
The present authors have developed a three-dimensional ultrasonic location and tagging
system for the fundamental function of robustly tracking objects(3). This system enables
a new approach of tag-based activity recognition. In terms of cost and robustness against
environmental noise, the ultrasonic system is superior to other location techniques such as
visual, tactile, and magnetic systems. Several types of ultrasonic location systems have been
proposed. The Bat Ultrasonic Location System (4; 5; 6; 7) developed by AT&T, and the MIT
Cricket Indoor Location System (8) are well known. Although a calibration method using a
robot (9) has been proposed, the required calibration device is too large for use in a number
of environments. An auto calibration method was considered in the DOLPHIN system (10),
which can calibrate the positions of receivers/transmitters using a small number of reference
receivers/transmitters having known positions. However, the system has only been tested in
narrow areas having dimensions of approximately 2.5 m
× 2 m. Bristol University proposed
another auto calibration method, in which the positions of n transmitters and m receivers
can be calculated given n
×m distance data among the transmitters and receivers and that the
condition, 3
(n + m) − 6 < n · m, is satisfied(11). However, the scalability of this method is
limited. In contrast, the present study proposes and examines a new calibration method,
“global calibration based on local calibration,” that requires a relatively small number of
transmitters and is independent of room size. Using the proposed method, the calibration
problem becomes a similar to a fitting problem in object modeling with multiple range
images(12; 13) after local calibration. The present paper describes the method for global
calibration based on local calibration and the constraints that are used in conjunction with
the method for reducing the error of the calibrated receiver positions.
This paper focuses on a system for quickly realizing a function for robustly detecting daily
human activity events in handling objects in the real world. This paper deals with a method
for robustly measuring 3D positions of the objects handled by a person, a quick calibrating
method for constructing a measuring system for 3D positions of the objects, and a quick
registering method for target activity events. The next section describes the system for quick
realization of the function for detecting human activity events. Section 3 shows algorithms
for robustly measuring 3D positions of the objects handled by a person, and evaluates the
algorithms. Section 4 describes a quick calibrating method, and Section 5 describes quick
registration of human activity by a stereoscopic camera with ultrasonic 3D tags and interactive
software for registering human activity events.
2. Quick realization of function for detecting human activity events
This section describes a system for quickly realizing a function for robustly observing and
efficiently recognizing daily human activities.
2.1 System for quick realization for function of detecting human activity events
The configuration of the proposed system is shown in Fig. 1. The system consists of an
ultrasonic 3D tag system, a calibrating device, a stereoscopic camera with ultrasonic 3D tags,
and a host computer. The system has three functions: 1) robustly measuring 3D positions of
the objects (Fig. 1(A)), 2) quickly calibrating a system for measuring 3D positions of the objects
(Fig. 1(B)), 3) quickly registering target activity events (Fig. 1(C)), and 4) robustly detecting
the registered events in real time (Fig. 1(D)).
204
Advances in Theory and Applications of Stereo Vision
Detecting Human Activity b y Location System and Stereo Vision 3
As for 1), the system realizes robust measurement of 3D positions of the objects using
an ultrasonic 3D tag system and robust estimation algorithm known as random sample
consensus (RANSAC). As for 2), the system realizes quick calibration by a calibrating device
having three or more ultrasonic transmitters. Quick calibration enables the system to be
portable. As for 3), quick registration of target activity events is realized by a stereoscopic
camera with ultrasonic 3D tags and interactive software for creating 3D shape model, creating
virtual sensors based on the 3D shape model, and associating the virtual sensors with the
target events.
ᵡᶍᶋᶎᶓᶒᶃᶐ
Ultrasonic 3D tag
ᵰᶃᵿᶊᴾᵵᶍᶐᶊᶂ
Physical object
with ultrasonic 3D tag
Ultrasonic 3D
tag system
(a)Create simplified 3D shape
model by using stereoscopic
camera
(b)Create function model
of physical object based
on䎃virtual sensor
(c)Associate output of
virtual sensor with
target activity event
(d)Recognizing activity in real time
Detection of registered
activity in real time
Quick registration of
target activity event
Created virtual
sensor
Created table of
registered activity event
Analyze by
virtual sensor
Input 3D data
and ID
Detect
target activity
Ultrasonic receivers
Stereoscopic camera
with ultrasonic 3D tag
Robust measurment of
objects' positions activity
Calibration device
Quick calibration for
ultrasonic 3D tag system
Ultrasonic 3D tag
Stereoscopic
camera system
A
B
C
D
Fig. 1. Configuration of system for quick realization for function for detecting human activity
events
2.2 Steps for quick realization for function of detecting human activity events
1. Install ultrasonic receivers in a target environment.
2. Calculate 3D positions of installed ultrasonic receivers using a calibration device. The
details of a calibration method and a calibrating system are described in Section 4.
3. Register target activity events using a stereoscopic camera with ultrasonic 3D tags and
interactive software. The details are described in Section 5.
4. Detect the registered target events using the ultrasonic 3D tags and the created virtual
sensors.
2.3 Advantage of proposed system
Advantages of the proposed system are following points.
205
Address-Event based Stereo Vision with Bio-inspired Silicon Retina Imagers
4 Stereo Vision
– Utilization of user’s knowledge Since users know target activity to be detected, the system
can make full use of knowledge of users familiar with target area by interactively registering
target events.
– Efficient processing It is possible to create the minimum system by determining the number
of ultrasonic receivers and the number of target events depending on the place where the
users want to install and the activity events which the users want to target.
– Inexpensive system It is possible to utilize inexpensive sensors such as the ultrasonic 3D
tag system (about $45 for a sensor and $200 for a tag), and the stereoscopic camera (about
$200 in our system) to create the proposed system.
– Robust system It is easy to increase the number of ultrasonic receivers for robust estimation
because they are inexpensive sensors. The details of an algorithm for robust estimation are
described in Section 3.
– Easy to improve The function for quickly registration of target events enables to improve
the constructed system by trial and error.
3. Robust observation of human activity in handling objects
3.1 System configuration of ultrasonic 3D tag system
Figure 2 shows the system configuration for the ultrasonic 3D tag system. The system
consists of an ultrasonic receiving section, an ultrasonic transmitting section, a time-of-flight
measuring section, a network section, and a personal computer. The ultrasonic receiving
section receives ultrasonic pulses emitted from the ultrasonic transmitter and amplifies the
received signal. The time-of-flight measuring section records the travel time of the signal
from transmission to reception. The network section synchronizes the system and collects
time-of-flight data from the ultrasonic receiving section. The positions of objects are calculated
based on more than three time-of-flight results. The sampling frequency of the proposed
system is 50 Hz.
The ultrasonic tag system calculates the 3D position of an object by trilateration using three
distance measurements. Two methods of multilateration are investigated for use with the
proposed system: multilateration based on a least-squares method using redundant distance
data, and multilateration based on robust estimation.
The room used to conduct the experiments is shown in Fig. 3. The room was 3.5
× 3.5 × 2.7 m
in size, and was fitted with 307 ultrasonic receivers embedded in the wall and ceiling.
Tags were attached to various objects, including a cup and a stapler as shown in and
Fig. refsensor-room. Some objects were fitted with two transmitters. The purpose of the
experimental room is to clarify the effect of the use of redundant sensors. More than 300
receivers do not mean that the algorithms described in the next section need such a large
number of sensors. In actual usage, a smaller number of receivers can be used.
3.2 Multilateration method 1: linearization of the minimization problem
The receiver position (x,y,z) is calculated by a multilateration algorithm, such as that used
in the Global Positioning System(14). Trilateration or multilateration algorithms have been
proposed in the field of aerospace(15; 16). This paper presents the multilateration algorithms
applicable to a more general case that multiple ultrasonic receivers are put on arbitrary
positions. Using distance data l
i
,l
j
and the receiver positions (x
i
,y
i
,z
i
), (x
j
,y
j
,z
j
), we obtain
the following spherical equations for the possible position of the target.
206
Advances in Theory and Applications of Stereo Vision
Detecting Human Activity b y Location System and Stereo Vision 5
PC
Send SYNC & ID
RS232(9.6k to 921.6kbps)
Radio transmitter
& SYNC generator
Radio
receiver
Ultrasonic
transmitter
SYNC signal
Ultrasonic receiver & amplifier
Measure time of flight
Ultrasonic 3D tag
40kHz
VHF 314.9MHz
wireless RS232
PIC
PIC
PIC
data
PIC
PIC
RS485
(921.6kbps,1km)
Collect data
Battery
< 256 devices
< 4096 devices
28x20x17mm
Fig. 2. System configuration of ultrasonic 3D tag system
(x
i
− x)
2
+(y
i
− y)
2
+(z
i
− z)
2
= l
2
i
,(2)
(x
j
− x)
2
+(y
j
− y)
2
+(z
j
− z)
2
= l
2
j
.(3)
By subtracting Eq. (3) from Eq. (2), we obtain an equation for intersecting planes between the
spheres, as shown in Fig. 5.
2
(x
j
− x
i
)x + 2(y
j
− y
i
)y + 2(z
j
− z
i
)z =
l
2
i
− l
2
j
− x
2
i
− y
2
i
− z
2
i
+ x
2
j
+ y
2
j
+ z
2
j
(4)
By inputting pairs of
(i, j) into the above equation, we obtain simultaneous linear equations,
as expressed by
AP
= B,(5)
where P
=
⎛
⎝
x
y
z
⎞
⎠
,(6)
A
=
⎛
⎝
2
(x
0
− x
1
) 2(y
0
− y
1
) 2(z
0
− z
1
)
2(x
0
− x
2
) 2(y
0
− y
2
) 2(z
0
− z
2
)
2(x
0
− x
3
) 2(y
0
− y
3
) 2(z
0
− z
3
)
⎞
⎠
,(7)
207
Address-Event based Stereo Vision with Bio-inspired Silicon Retina Imagers
6 Stereo Vision
Fig. 3. Experimental daily living space
Tiny type
(12x12x20mm)
Small type
(28x20x17mm)
Long life
battery type
(65x44x20mm)
Tag
Fig. 4. Developed ultrasonic 3D tags and example of attaching tags to objects
208
Advances in Theory and Applications of Stereo Vision
Detecting Human Activity b y Location System and Stereo Vision 7
l2
l1
l3
P=(x,y,z): intersection point
α: intersection plane
Fig. 5. Planes of intersection between spheres used to give the estimated position
B
=
⎛
⎜
⎜
⎜
⎝
l
2
1
− l
2
0
− x
2
1
− y
2
1
− z
2
1
+ x
2
0
+ y
2
0
+ z
2
0
l
2
2
− l
2
0
− x
2
2
− y
2
2
− z
2
2
+ x
2
0
+ y
2
0
+ z
2
0
l
2
3
− l
2
0
− x
2
3
− y
2
3
− z
2
3
+ x
2
0
+ y
2
0
+ z
2
0
.
.
.
⎞
⎟
⎟
⎟
⎠
.(8)
The position
(
ˆ
x,
ˆ
y,
ˆ
z
) can then be calculated by a least-squares method as follows.
P
=(A
T
A)
−1
A
T
B.(9)
This method minimizes the square of the distance between the planes expressed by Eq. (4)
and the estimated position. The algorithm is described in detail in Fig. 6. In actual usage, the
rank of matrix A must be considered.
3.3 Multilateration method 2: robust estimation by RANSAC
Data sampled by the ultrasonic tagging system is easily contaminated by outliers due to
reflections. Method 1 above is unable to estimate the 3D position with high accuracy if
sampled data includes outliers deviating from a normal distribution. In the field of computer
vision, robust estimation methods that are effective for sampled data including outliers have
already been developed. In this work, the random sample consensus (RANSAC) (17; 18)
estimator is adopted to eliminate the undesirable effects of outliers. The procedure is as
follows.
1. Randomly select three distances measured by three receivers (jth trial).
2. Calculate the position
(x
cj
,y
cj
,z
cj
) by trilateration.
3. Calculate the error ε
cji
for all receivers (i = 0,1, ,n) by Eq. (10), and find the median ε
mj
of
ε
cji
.
209
Address-Event based Stereo Vision with Bio-inspired Silicon Retina Imagers
8 Stereo Vision
Rank(A)=1 Rank(A)=2 Rank(A)=3
(Collinear) (Non-coplanar)(Coplanar)
Solution is determinate.
A single solution exists.
bx
tt
AAA
1
)(
−
=
bx =A
Rank(A) ?
bx
0
+
= A
+
A
is Moore-Penrose inverse matrix.
0
xnx += t
n
2222
)()()(
iiii
lzzyyxx =−+−+−
⎟
⎟
⎟
⎟
⎟
⎠
⎞
⎜
⎜
⎜
⎜
⎜
⎝
⎛
=
M
n
n
n
A
2
1
⎟
⎟
⎟
⎠
⎞
⎜
⎜
⎜
⎝
⎛
=
z
y
x
x
1
n
2
n
i
n
22222222
)(2)(2)(2
jjjiiiji
ijijij
zyxzyxll
zzzyyyxxx
+++−−−+=
−+−+−
Center of sphere
M-by-3 Matrix
0)( >⋅−
con dcon d
npx
Solution is indeterminate.
At most two solutions exist.
Solution is indeterminate.
Infinite solutions exist.
A position cannot be fixed.
Candidate
of solution
If there are conditions to select
one solution from the two,
a single position can be fixed.
x
0
is the minimum norm solution.
3) Select a single solution using
conditions such as
n
is a base vector of nullspace of A.
1) Solve the minimum norm solution
2) Solve two positions using
the equations below.
),,(
iiii
zyxP =
A single position can be fixed.
Simultaneous equations of plane
on which an intersection line between the two spheres
0
x
n
Candidate
of solution
Candidate
of solution
Candidate
of solution
Fig. 6. Algorithm for estimating 3D position by a least-squares method considering the rank
of A
4. Repeat steps 1 to 3 as necessary to find the combination of measurements giving the
minimum error, and adopt the corresponding 3D position.
ε
cji
=
l
i
−
(x
i
− x
mj
)
2
+(y
i
− y
mj
)
2
+(z
i
− z
mj
)
2
(10)
ε
mj
= med
j
|ε
cji
| (11)
(
ˆ
x,
ˆ
y,
ˆ
z
)=min ε
mj
(12)
3.4 Resolution
Figure 7 shows the relationship between the number of receivers and the deviation of the
estimated position for 4, 6, 9, 24, and 48 receivers in the ceiling. To compare the effect of
the RANSAC method and that of the least-squares method, one receiver is selected randomly
and 500[mm] is added to the distance data of the selected receiver as outlier. Each point was
derived from 30 estimations of the position. The 5 lines in the figures represent estimation for
5 different locations of the transmitter. The resolution increases with the number of receivers,
210
Advances in Theory and Applications of Stereo Vision
Detecting Human Activity b y Location System and Stereo Vision 9
0
50
100
150
200
250
0 102030405060
The number of sensors
Deviation [mm]
The number of sensors
Deviation [mm]
0
50
100
150
200
250
0 102030405060
Fig. 7. Relationship between resolution and the number of sensors for the least-squares
method (upper) and RANSAC (lower)
30
30
0
0.02
0.04
Density
x[mm]
y[mm]
30
-30
-30
0
0.1
0.2
0.3
0.4
0.5
0.6
0102030-10-20-30
Z [mm]
Density
Fig. 8. Resolution in the x and y directions (upper) and z direction (lower) (grid size: 2 x
2 mm)
and the RANSAC method provides a more stable estimation with higher resolution compared
to the least-squares method.
The resolution in the x, y,andz directions is illustrated in Fig. 8, which shows the probability
density distribution for 1000 estimations using RANSAC. The resolution in x and y directions
is about 15 mm, while that in the z direction is about 5 mm.
The number of sensors
Error [mm]
0
50
100
150
200
250
300
350
0 102030405060
The number of sensors
Error [mm]
0
50
100
150
200
250
300
350
0 102030405060
Fig. 9. Relationship between positioning accuracy and the number of receivers for the
least-squares method (upper) and RANSAC (lower)
211
Address-Event based Stereo Vision with Bio-inspired Silicon Retina Imagers
10 Stereo Vision
3.5 Positioning accuracy
Figure 9 shows the relationship between the number of receivers and the error of the estimated
position for 4, 6, 9, 24, and 48 receivers. The error is taken as the distance from the position
measured by a visual motion capture system. One receiver is selected randomly and 500[mm]
is added to the distance data of the selected receiver as outlier. Each point was derived from
30 estimations of the position. The 5 lines in the figures represent estimation for 5 different
locations of the transmitter. The error decreases as the number of receivers is increased, and
the RANSAC method is appreciably more accurate with fewer receivers. It is considered that
the least-squares method is easily affected by outliers, whereas the RANSAC method is not.
Figure 10 shows the 3D distribution of error for 1400 measured positions in the room. The
figures show that the error is lowest (20–80 mm) immediately below the 48 receivers in the
ceiling, increasing toward the edges of the room.
The results of experiments for evaluating accuracy and resolution demonstrate that it is
possible to improve accuracy and resolution by increasing the number of receivers, and that
the undesirable effect of outliers can be mitigated through the use of RANSAC estimation.
3.6 Robustness to occlusion
As in other measuring techniques such as vision-based methods, it is necessary to increase
the number of sensors to solve the problem of sensor occlusion, where the line of sight to the
target object is obstructed by other objects such as walls or room occupants. In the present
tagging system, the problem of occlusion occurs often when a person moves or operates an
object. These situations give rise to two separate problems; a decrease in the number of usable
sensors for the target, and an increase in reflections due to obstruction and movement. As one
of the most typical situations where occlusion occurs, this section focuses on occlusion due to
ahand.
Figure 11 shows how the error increases and the number of usable sensor decreases as a
hand approaches an object fitted with an ultrasonic transmitter for the least-squares and
RANSAC methods. Although the error increases significantly by both methods when the
hand approaches the object, the RANSAC method is much less affected than the least-squares
method. This demonstrates that the proportion of outliers increases when occlusion occurs,
and that RANSAC is more robust in this situation because it can mitigate the effect of such
outliers.
3.7 Real-time position measurement
Figure 12 shows the measured trajectory for a person moving a cup to a chair, the floor, and
a desk. The figure demonstrates that the system can robustly measure the positions of the
objects in most places of the room regardless of occlusion by a hand or body.
In the current system, the sampling frequency is about 50 Hz. This frequency decreases to
50/n Hz when n objects are being monitored. However, it is possible to maintain a high
sampling frequency by selecting which transmitters to track dynamically. For example, a
transmitter can be attached to a person’s wrist, and the system can select transmitters in the
vicinity of the wrist to be tracked, thereby reducing the number of transmitters that need to
be tracked at one time and maintaining the highest sampling frequency possible. Figure 13
shows the measured trajectory in a dynamic selection mode. The red sphere in the figure
shows the position of the hand.
212
Advances in Theory and Applications of Stereo Vision
Detecting Human Activity b y Location System and Stereo Vision 11
䎓 䎘䎓䎓 䎔䎓䎓䎓 䎔䎘䎓䎓 䎕䎓䎓䎓 䎕䎘䎓䎓 䎖䎓䎓䎓 䎖䎘䎓䎓
䎓
䎘䎓䎓
䎔䎓䎓䎓
䎔䎘䎓䎓
䎕䎓䎓䎓
䎕䎘䎓䎓
䎖䎓䎓䎓
䎖䎘䎓䎓
䎗䎓䎓䎓
䎗䎘䎓䎓
䎼䎃䎾䏐䏐䏀
䎻䎃䎾䏐䏐䏀
䎓 䎘䎓䎓 䎔䎓䎓䎓 䎔䎘䎓䎓 䎕䎓䎓䎓 䎕䎘䎓䎓 䎖䎓䎓䎓 䎖䎘䎓䎓
䎓
䎘䎓䎓
䎔䎓䎓䎓
䎔䎘䎓䎓
䎕䎓䎓䎓
䎕䎘䎓䎓
䎖䎓䎓䎓
䎖䎘䎓䎓
䎗䎓䎓䎓
䎗䎘䎓䎓
䎼䎃䎾䏐䏐䏀
䎻䎃䎾䏐䏐䏀
䎓 䎘䎓䎓 䎔䎓䎓䎓 䎔䎘䎓䎓 䎕䎓䎓䎓 䎕䎘䎓䎓 䎖䎓䎓䎓 䎖䎘䎓䎓
䎓
䎘䎓䎓
䎔䎓䎓䎓
䎔䎘䎓䎓
䎕䎓䎓䎓
䎕䎘䎓䎓
䎖䎓䎓䎓
䎖䎘䎓䎓
䎗䎓䎓䎓
䎗䎘䎓䎓
䎼䎃䎾䏐䏐䏀
䎻䎃䎾䏐䏐䏀
䎓 䎘䎓䎓 䎔䎓䎓䎓 䎔䎘䎓䎓 䎕䎓䎓䎓 䎕䎘䎓䎓 䎖䎓䎓䎓 䎖䎘䎓䎓
䎓
䎘䎓䎓
䎔䎓䎓䎓
䎔䎘䎓䎓
䎕䎓䎓䎓
䎕䎘䎓䎓
䎖䎓䎓䎓
䎖䎘䎓䎓
䎗䎓䎓䎓
䎗䎘䎓䎓
䎼䎃䎾䏐䏐䏀
䎻䎃䎾䏐䏐䏀
䎕䎓 䎗䎓 䎙䎓 䎛䎓 䎔䎓䎓 䎔䎕䎓 䎔䎗䎓 䎔䎙䎓 䎔䎛䎓 䎕䎓䎓
䎨䏕䏕䏒䏕䎃䎾䏐䏐䏀
䎋䎽䎠䎘䎓䎓䎾䏐䏐䏀䎌
䎋䎽䎠䎔䎓䎓䎓䎾䏐䏐䏀䎌
䎋䎽䎠䎔䎘䎓䎓䎾䏐䏐䏀䎌 䎋䎽䎠䎕䎓䎓䎓䎾䏐䏐䏀䎌
䏝䎠䎘䎓䎓
䏝䎠䎔䎓䎓䎓
䏝䎠䎕䎓䎓䎓
䏝䎠䎔䎘䎓䎓
䎖䎖䎖䎾䏐䏐䏀
䎖䎖䎖䎾䏐䏐䏀
䎋䏅䎌䎃䎳䏒䏖䏌䏗䏌䏒䏑䏖䎃䏒䏉䎃䎗䎛䎃䏖䏈䏑䏖䏒䏕䏖
䎖䎓䎓䎓
䎗䎓䎓䎓
䎓
䎔䎓䎓䎓
䎕䎓䎓䎓
䎖䎓䎓䎓
䎓
䎘䎓䎓
䎔䎓䎓䎓
䎔䎘䎓䎓
䎕䎓䎓䎓
䎓
䎔䎓䎓䎓
䎕䎓䎓䎓
䏝䎃䎾䏐䏐䏀
䏛䎃䎾䏐䏐䏀
䏜䎃䎾䏐䏐䏀
䎋䏄䎌䎃䎰䏈䏄䏖䏘䏕䏈䏇䎃䎔䎗䎓䎓䎃䏓䏒䏌䏑䏗䏖
䎳䏒䏖䏌䏗䏌䏒䏑䎃䏒䏉䎃䏖䏈䏑䏖䏒䏕
䎕䎚䎓䎓
䎖䎘䎓䎓
䎗䎓䎓䎓
Fig. 10. 3D distribution of error in the experimental room
213
Address-Event based Stereo Vision with Bio-inspired Silicon Retina Imagers