Báo cáo y học: " Can foot anthropometric measurements predict dynamic plantar surface contact area" pptx
Bạn đang xem bản rút gọn của tài liệu. Xem và tải ngay bản đầy đủ của tài liệu tại đây (1.41 MB, 9 trang )
BioMed Central
Page 1 of 9
(page number not for citation purposes)
Journal of Foot and Ankle Research
Open Access
Research
Can foot anthropometric measurements predict dynamic plantar
surface contact area?
ThomasGMcPoil*
1
, Bill Vicenzino
2
, Mark W Cornwall
1
and Natalie Collins
2
Address:
1
The Laboratory for Foot & Ankle Research, Department of Physical Therapy and Athletic Training, Northern Arizona University, Flagstaff,
AZ, 86011, USA and
2
Division of Physiotherapy, School of Health and Rehabilitation Sciences, University of Queensland, St. Lucia, Queensland,
Australia
Email: Thomas G McPoil* - ; Bill Vicenzino - ; Mark W Cornwall - ;
Natalie Collins -
* Corresponding author
Abstract
Background: Previous studies have suggested that increased plantar surface area, associated with
pes planus, is a risk factor for the development of lower extremity overuse injuries. The intent of
this study was to determine if a single or combination of foot anthropometric measures could be
used to predict plantar surface area.
Methods: Six foot measurements were collected on 155 subjects (97 females, 58 males, mean age
24.5 ± 3.5 years). The measurements as well as one ratio were entered into a stepwise regression
analysis to determine the optimal set of measurements associated with total plantar contact area
either including or excluding the toe region. The predicted values were used to calculate plantar
surface area and were compared to the actual values obtained dynamically using a pressure sensor
platform.
Results: A three variable model was found to describe the relationship between the foot
measures/ratio and total plantar contact area (R
2
= 0.77, p < 0.0001)). A three variable model was
also found to describe the relationship between the foot measures/ratio and plantar contact area
minus the toe region (R
2
= 0.76, p < 0.0001).
Conclusion: The results of this study indicate that the clinician can use a combination of simple,
reliable, and time efficient foot anthropometric measurements to explain over 75% of the plantar
surface contact area, either including or excluding the toe region.
Background
In attempting to understand a patient's foot morphology,
the clinician should not only evaluate foot posture and
mobility but should also consider assessing the amount of
plantar surface contact area. The need for the clinician to
assess the amount of plantar surface area would appear to
be justified since previous investigators have reported that
increased plantar surface contact area, associated with pes
planus, can be a risk factor in the development of overuse
injuries[1,2].
Two of the three studies that have attempted assess the
relationship between plantar surface area and overuse
injuries of the lower extremity have reported that an
increase in plantar surface area would appear to be a risk
factor. While Michelson et al[3] found that increased
Published: 28 October 2009
Journal of Foot and Ankle Research 2009, 2:28 doi:10.1186/1757-1146-2-28
Received: 27 August 2009
Accepted: 28 October 2009
This article is available from: />© 2009 McPoil et al; licensee BioMed Central Ltd.
This is an Open Access article distributed under the terms of the Creative Commons Attribution License ( />),
which permits unrestricted use, distribution, and reproduction in any medium, provided the original work is properly cited.
Journal of Foot and Ankle Research 2009, 2:28 />Page 2 of 9
(page number not for citation purposes)
plantar surface area was not a risk factor for lower extrem-
ity injuries in an athletic population, both Kaufman et
al[1] and Levy et al[2] reported that increased plantar sur-
face area associated with a pes planus foot type caused an
increased level of lower extremity overuse injuries in mil-
itary populations. In the most recent study by Levy et al,
plantar surface area was assessed on 512 West Point
cadets, within one week of enrollment[2]. The cadets were
then followed for 46 months as they underwent a pre-
scribed amount of high-level physical activity. These
authors used specific guidelines to define those individu-
als with pes planus based on footprints obtained using a
Harris and Beath mat. They reported that over the four-
year period of the study, those cadets with an increased
plantar surface area had a significantly greater number of
lower extremity overuse injuries.
While the need for the clinician to assess plantar surface
contact area would appear to be indicated, the methods
used for obtaining plantar surface area impressions range
from the use of footprints obtained from an inked mat to
more sophisticated sensor platforms used to measure
plantar pressures as well as surface area. While an inked
mat system is economical, obtaining footprints as well as
the analysis is time intensive. While state-of-the-art pres-
sure sensor platform systems allow the clinician to quickly
obtain and analyze footprints, the necessary equipment
and software is very costly. Ideally, it would be most
advantageous for the clinician to be able to determine a
patient's plantar surface area using simple, reliable, and
time efficient anthropometric measurements of the foot.
Interestingly, previous studies have attempted to use
plantar surface area in an attempt to predict foot posture,
in particular, the height of the medial longitudinal arch.
Unfortunately, none of these studies have been able to
explain more than 55% of the bony height of the medial
longitudinal arch using the amount of plantar surface area
in contact with the ground[4-7]. To date no study has
attempted to use foot anthropometric measurements to
predict plantar surface contact area, even though
increased plantar surface area associated with pes planus
has been identified as a possible risk factor in the develop-
ment of lower extremity overuse injuries. Thus, the pur-
pose of this study was to determine if the use of a single or
combination of simple, reliable, and time efficient foot
anthropometric measurements could be used to predict
plantar surface contact area.
Methods
Participant characteristics
One hundred and fifty-five individuals (97 females and
58 males) volunteered to participate in the study. Partici-
pants were recruited from the Northern Arizona Univer-
sity population and the surrounding Flagstaff, Arizona
community. All participants met the following inclusion
criteria: 1) no history of congenital deformity in the lower
extremity or foot; 2) no previous history of lower extrem-
ity or foot fractures; 3) no systemic diseases that could
affect lower extremity or foot posture; and 4) no history of
trauma or pain to either foot, lower extremity, or lum-
bosacral region at least 12 months prior to the start of the
investigation. Volunteers with any visual signs of hallux
valgus or other toe deformities were also excluded from
participation. The mean age of the 155 participants was
24.5 ± 3.5 years with a range of 18 to 39 years. The Insti-
tutional Review Board of Northern Arizona University
(IRB # 07.0233) approved the protocol for data collection
and all participants provided written informed consent
prior to participation.
Instrumentation
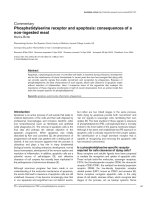
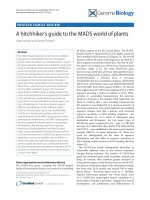
To obtain the foot anthropometirc measurements, a foot
measurement platform that has been previously described
was utilized (Figure 1) [8]. In addition to the foot meas-
urement platform, two instruments were manufactured
for the study to permit the measurement of both arch
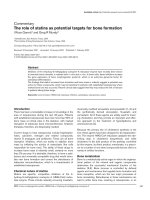
height and the various foot widths. The weight bearing
arch height gauge consisted of a digital caliper (Model
#700-126, Mitutoyo USA, Aurora, IL 60502) with the
fixed point attached to a 1.2 × 5.0 × 10.0 cm plastic block
to hold the caliper in a vertical position and a sliding
metal rod attached to the moving point of the caliper to
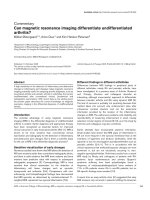
permit the assessment of arch height (Figure 2). A second
digital caliper (Model # S54-101-150-2, Fowler Equip-
ment, Newton, MA 02466) was modified, to permit the
measurement of forefoot, midfoot, and heel widths by
attaching 0.03 × 0.8 × 9.0 cm metal plates to both the
fixed and the moving points of the caliper (Figure 3).
To obtain dynamic plantar surface contact area during
walking, an EMED-X floor mounted capacitance trans-
ducer platform (NOVEL USA, Inc, Minneapolis, MN,
55415), with an active sensor area of 32 × 47.5 cm, was
Foot Measurement PlatformFigure 1
Foot Measurement Platform.
Journal of Foot and Ankle Research 2009, 2:28 />Page 3 of 9
(page number not for citation purposes)
positioned at the midpoint of a 12-meter walkway to col-
lect dynamic plantar surface area during walking. The
EMED-X platform had a matrix of 6080 sensors with a
density of four sensors per cm2 and a sampling rate of 100
Hz. The input pressure saturation range for the capaci-
tance sensors used in the EMED platform is 1270 kPa. In
the current study, none of the trials performed by any sub-
ject achieved pressure saturation levels for the platform
system.
Procedures
After height and weight were obtained, each subject was
asked to stand on the foot measurement platform with
both heels placed in left and right heel cups that were
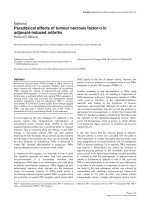
positioned 15.24 cm apart. Next, the sliding first metatar-
sophalangeal joint indicator was positioned over the
medial prominence of the first metatarsal head. To ensure
the proper placement of the indicator over the medial
prominence of the first metatarsal head, the examiner
ensured that the hallux could be extended without caus-
ing any displacement of the indicator (Figure 4). Once the
first metatarsophalangeal joint indicator was properly
positioned bilaterally, the subject was instructed to place
equal weight on both feet so that the following weight-
bearing measurements could be obtained. Total foot
length was first measured by placing the sliding bar on the
centered metal ruler attached to the platform and moving
the bar to just touch the longest toe, usually the hallux, of
each foot (see Figure 5). Ball length (BL) was recorded
based on the position of the first metatarsophalangeal
joint indicator in relation to offset metal rulers that were
aligned with the centered metal ruler (see Figure 5). Total
foot length was divided in half and the dorsums of both
feet were marked at the 50% length point using a water-
soluble pen. The sliding metal rod of the weight bearing
height gauge was then positioned over the 50% length
mark and the vertical height from the top of the platform
to the dorsum of each foot (DAH) was measured (see Fig-
ure 2). Next, the caliper designed to assess foot width was
used to measure forefoot width (FFWid) by positioning
the edges of the two metal arms attached to the caliper so
that they were parallel to the centered metal ruler on the
Digital gauge used to measure dorsal arch heightFigure 2
Digital gauge used to measure dorsal arch height.
Digital caliper for measuring foot widths being used to meas-ure midfoot widthFigure 3
Digital caliper for measuring foot widths being used
to measure midfoot width.
Journal of Foot and Ankle Research 2009, 2:28 />Page 4 of 9
(page number not for citation purposes)
platform (Figure 6). The metal arms were then moved
until they just made contact with the skin. Once both rods
made contact with the skin, the FFWid was recorded. To
assess midfoot width (MFWid), the digital caliper was
positioned so that the arms of the caliper were aligned lat-
erally and medially to the 50% length point marked on
the dorsum of the foot (see Figure 2). The lateral and
medial arms where then moved until they just made con-
tact with the skin at the 50% length point. The MFWid was
then recorded. To assess heel width (HLWid), the subject
was asked to slide both feet forward on the measurement
platform, so both heels were no longer in the heel cups.
Care was taken to ensure that the subject did not change
the alignment of their feet as they slide their feet forward
on the platform. The digital width caliper was then placed
behind each heel with the metal arms of the caliper placed
at a 45° angle to the platform (Figure 7). The arms were
then moved together until they just made contact with the
skin on the lateral and medial sides of the heel (Figure 8).
Once both rods made contact with the skin, the HLWid
was recorded. The use of 50% of the total foot length for
both the dorsal arch height and the midfoot width meas-
urements was based on the results of previous research
assessing the consistency for the measures of arch height
and midfoot width [8,9]. All measurements were
obtained on both feet of all 155 subjects by the same rater
and were recorded in centimeters. The maximum time
required for completing all six measurements on both feet
ranged from 5 to 6 minutes.
Extending first metatarsophalangeal joint to ensure proper placement of indicatorFigure 4
Extending first metatarsophalangeal joint to ensure
proper placement of indicator.
Placement of forefoot using first metatarsophalangeal joint indicator and measurement of total foot lengthFigure 5
Placement of forefoot using first metatarsophalan-
geal joint indicator and measurement of total foot
length.
Measurement of forefoot widthFigure 6
Measurement of forefoot width.
Journal of Foot and Ankle Research 2009, 2:28 />Page 5 of 9
(page number not for citation purposes)
Once the foot measurements were completed, each sub-
ject was then instructed to practice walking barefoot at a
self-selected speed along the 12-meter walkway for several
minutes. In order to prevent targeting of the EMED-X plat-
form, subjects were instructed not to look at the ground
while walking. Walking speed was monitored using a dig-
ital stopwatch to time the subject as they walked between
two lines positioned 6.1 meters apart and were equidis-
tant in relation to the platform. When between-trial walk-
ing speed was consistent (variation of less than 5 percent
between trials), each subject was asked to walk barefoot
over the walkway while data were recorded from the
EMED-X platform for five trials on both the left and right
foot.
Determination of Reliability
To assess the reliability for the six (6) foot measurements,
three raters were asked to assess the left and right feet of
12 randomly selected participants. The raters performing
the measurements were three physical therapists with a
minimum of 2 years clinical experience (mean experience
16 years; range 2 to 30 years). Each rater attended a single
one-hour training session to receive verbal instructions as
well as to practice the techniques to ensure that they were
taking the measurements correctly. The reliability data
collection consisted of two sessions, one-week apart, in
which each rater performed all six measurements on both
feet of all 12 subjects. Each rater was blinded from all
measurements and the mark placed over the dorsum of
each foot was removed after each set of measurements to
prevent subsequent rater bias. The left and right feet for all
12 subjects were treated as independent observations so
that the analysis of reliability was conducted on 24 feet.
Data Analysis
In addition to the six (6) foot measurements (TFL, BL,
DAH, FFWid, MFWid, HLWid), the arch height ratio
(AHRatio) was also calculated. To determine the AHRatio,
the DAH was divided by the BL. To determine plantar sur-
face contact area, a standardized four region masking
model (Novel Automask, NOVEL USA, Inc, Minneapolis,
Placement of the digital caliper at 45° to the platform to measure heel widthFigure 7
Placement of the digital caliper at 45° to the plat-
form to measure heel width.
Measurement of heel widthFigure 8
Measurement of heel width.
Journal of Foot and Ankle Research 2009, 2:28 />Page 6 of 9
(page number not for citation purposes)
MN, 55415) was used to divide the dynamic plantar sur-
face area into four regions; rearfoot, midfoot, forefoot,
and toes. The heel to midfoot and midfoot to forefoot
regions were defined by using 73% and 45% of the entire
foot length from the toes to the heel, respectively. The
forefoot to toe region was defined by using the pressure
gradients around the peak pressures of the toes. The Novel
Groupmask program (NOVEL USA, Inc, Minneapolis,
MN, 55415) was used to determine the mean plantar sur-
face contact area for the five trials collected on each sub-
ject's feet. Two different plantar surface contact areas were
calculated; 1) the total plantar surface contact area
(TPCA), which included all four plantar regions, and 2)
plantar surface contact area minus the toe region (PCA-
Toes).
Statistical Analysis
Intraclass correlation coefficients (ICC) were calculated to
determine the consistency of each rater to perform the
measurements repeatedly both individually (intra-rater;
ICC
3,1
) as well as in comparison to the other raters (inter-
rater; ICC
2,3
)[10]. The level of reliability for the ICC was
classified using the characterizations reported by Landis
and Koch[11]. These characterizations were: slight, if the
correlation ranged from .00 to .21; fair, if the correlation
ranged from .21 to .40; moderate, if the correlation ranged
from .41 to .60; substantial, is the correlation ranged from
.61 to .80; and almost perfect, if the correlation ranged from
.81 to 1.00. Although the ICC is a well accepted measure
of reliability, it is difficult to interpret ICC values since
they are dependent on the variability of the group being
assessed and may not transfer to different patient popula-
tions [12]. Thus in addition to ICC values, the standard
error of the measurement (SEM) was also calculated as
another index of reliability. The SEM is a number in the
same units as the original measurement that represents
the way a single score would vary if the six foot measure-
ments used in this study were measured more than once
[13]. In addition to descriptive statistics, t-tests were used
to determine whether extremity differences for females
and males existed for the seven anthropometric measures
of the foot.
The six (6) foot measures and one (1) ratio were entered
into a stepwise forward linear regression to determine the
most parsimonious set of variables associated with TPCA
and PCA-Toes. A significance level of p < 0.05 was
required for entry into the model and p < 0.06 was used
as the criteria for removal from the model. Using the
regression equation that was developed, predicted mean
values for TPCA and PCA-Toes were calculated and com-
pared using t-tests to the measured mean values for TPCA
and PCA-Toes mean values. All statistical analyses were
performed using JMP software, Version 8.0 (SAS Institute
Inc, Cary, NC 27513). An alpha level of .05 was estab-
lished for all tests of significance.
Results
Demographic data for all 155 subjects are listed in Table
1. The intra-rater and inter-rater ICC and SEM values are
shown in Tables 2 and 3. The intra-rater reliability for all
six (6) foot measurements ranged from 0.98 to 0.99 for all
three raters regardless of experience level. The intra-rater
SEM values ranged from 0.02 to 0.08 centimeters and
were all less than 2% of the actual measurement value.
The inter-rater reliability ICC for the same measurements
ranged from 0.98 to 0.99 for both day one and day two
with SEM values ranging from 0.03 to 0.10 centimeters.
Descriptive statistics for all measurements are listed by
extremity and gender in Table 4. The results of the t-tests
indicated that there were no significant differences
between the left and right feet for any of the foot measure-
ments for either the female or male subjects. In addition,
a stepwise forward linear regression analysis was per-
formed for both the left and right feet of all subjects to
predict TPCA and PCA-Toes. For the left foot, the regres-
sion analysis resulted in a three variable (3) variable
model (MFWid, HLWid, and AHRatio) for TCPA (R2 =
0.79) and for PCA-Toes (R2 = 0.78). For the right foot, the
regression analysis resulted in the same three (3) variable
model (MFWid, HLWid, and AHRatio) for TCPA (R2 =
0.75) and for PCA-Toes (R2 = 0.75). Based on the results
of the t-tests and the fact that the regression prediction
models determined for each foot were so similar, the left
and right feet were grouped for the final regression analy-
sis that is reported in this paper.
The stepwise forward linear regression analysis to predict
TPCA for all 310 feet resulted in a three (3) variable model
(F = 349.9, p < 0.0001) that had an R
2
= 0.77, and an
adjusted R
2
= 0.77. The three measurements that were
included in the model were: MFWid, HLWid, and AHRa-
tio. The mean TPCA manually measured using the sensor
platform was 116.9 cm
2
and the predicted TPCA based on
the four measurements identified in the regression analy-
sis was 116.9 cm
2
. The difference between the measured
and predicted values for TPCA was 0.00 with a standard
error of 0.55 cm
2
. A t-test indicated that there was no sig-
Table 1: Subject characteristics with values presented as mean,
standard deviation (SD), and 95% confidence Intervals (CI).
N = 155 MEAN SD 95% CI
Age (years) 24.6 3.5 24.1 - 25.2
Height (cm) 171.0 9.0 169.6 - 172.4
Weight (kg) 71.2 14.0 68.9 - 73.5
Body Mass Index (kg/m2) 24.3 3.9 23.6 - 24.9
Journal of Foot and Ankle Research 2009, 2:28 />Page 7 of 9
(page number not for citation purposes)
nificant difference between the measured and predicted
mean values for TPCA.
The stepwise forward linear regression analysis to predict
PCA-Toes for all 310 feet also resulted in a three (3) vari-
able model (F = 324.9, p < 0.0001) that had an R
2
= 0.76,
and an adjusted R
2
= 0.76. The three measurements that
were included in the model were the same as reported for
TPCA: MFWid, HLWid, and AHRatio. The mean PCA-Toes
manually measured using the sensor platform was 96.3
cm
2
and the predicted PCA-Toes based on the three meas-
urements identified in the regression analysis was 96.3
cm
2
. The difference between the measured and predicted
values for PCA-Toes was 0.00 with a standard error of 0.52
cm
2
. A t-test indicated that there was no significant differ-
ence between the measured and predicted mean values for
PCA-Toes.
Discussion
As previously noted, increased plantar surface area associ-
ated with pes planus would appear to be a possible risk
factor in the development of lower extremity overuse inju-
ries. While previous studies have attempted to predict
bony arch height of the medial aspect of the foot using
plantar surface contact, no investigations to date have
attempted to use a single or combination of foot anthro-
pometric measurements to predict plantar surface contact
area. The intent of this study was to determine if a single
or combination of foot anthropometric measurements
could be used to predict plantar surface contact area.
The first issue in interpreting the results was the intra- and
inter-rater reliability of the foot anthropometric measure-
ments used in this study. The ICC values for all three
raters, regardless of the number of years of clinical experi-
ence, would be classified as "almost perfect" for both
intra-rater and inter-rater reliability based on the charac-
terizations provided by Landis and Koch[11]. As noted in
Tables 2 and 3, the SEM values were also quite small rang-
ing from 0.02 to 0.10 cm for all six (6) foot measurements
used in this study. Based on these findings, the authors
concluded that the reliability of the measurement tech-
niques used in the study was acceptable and that further
analysis of the results could be performed.
T-tests indicated that significant differences did not exist
between the left and right feet for both the female and
male subjects. In addition, the results of linear regression
analyses performed on both the left and right feet resulted
in the same three variable model to predict TPCA and
PCA-Toes. All of the prediction models determined for the
left and right feet explained at least 75% of the plantar sur-
face contact area either including or excluding the toe
region. Based on the results of the t-tests and the fact that
the regression prediction models for each foot were so
similar, the left and right feet were grouped for the final
regression analysis so that a single prediction model could
be provided for TPCA as well as PCA-Toes based on all
310 feet.
Based on the results of the regression analysis on all 310
feet, the use of MFWid, HLWid, and AHRatio can explain
more than 75% of the variance of TPCA. The small stand-
ard error of the mean (0.55 cm
2
) between the predicted
and actual values for TCPA indicates the relative strength
and utility of the resulting regression equation for the cli-
nician to predict TPCA. This finding is further substanti-
ated by the non-significant t-tests between the predicted
and actual values. Using data from the current study, the
Table 2: Intra-rater reliability coefficients (ICC) and standard error of the measurement (SEM)
Rater 1
(30 years experience)
Rater 2
(16 years experience)
Rater 3
(2 years experience)
ICC Mean (cm) SEM (cm) ICC Mean (cm) SEM (cm) ICC Mean (cm) SEM (cm)
Foot Length 0.99 25.96 0.04 0.99 26.05 0.04 0.99 25.96 0.04
Ball Length 0.98 18.98 0.08 0.98 18.95 0.07 0.99 19.05 0.04
Ball Width 0.98 09.70 0.05 0.99 08.88 0.05 0.98 08.61 0.06
Midfoot Width 0.98 08.82 0.04 0.99 08.88 0.03 0.99 08.61 0.04
Heel Width 0.99 06.66 0.02 0.99 06.80 0.02 0.99 06.87 0.04
Dorsal Arch Hgt 0.98 06.52 0.03 0.98 06.53 0.03 0.98 06.52 0.03
Table 3: Inter-rater reliability coefficients (ICC) and standard
error of the measurement (SEM) for day 1 and day 2.
Day 1 Day 2
ICC SEM ICC SEM
Foot Length 0.99 0.06 0.99 0.05
Ball Length 0.99 0.07 0.98 0.07
Ball Width 0.99 0.04 0.99 0.04
Midfoot Width 0.98 0.10 0.99 0.08
Heel Width 0.98 0.07 0.98 0.08
Dorsal Arch Hgt 0.98 0.04 0.98 0.03
Journal of Foot and Ankle Research 2009, 2:28 />Page 8 of 9
(page number not for citation purposes)
clinician can predict the TPCA based on the selected foot
measurements using the following formula:
Based on the results of the regression analysis on all 310
feet, the use of MFWid, HLWid, and AHRatio, also
explains over 75% of the variance of PCA-Toes. The small
standard error of the mean (0.52 cm
2
) between the pre-
dicted and actual values for PCA-Toes indicates the rela-
tive strength and utility of the resulting regression
equation for the clinician to predict PCA-Toes. This find-
ing is further substantiated by the non-significant t-tests
between the predicted and actual values. Using data from
the current study, the clinician can predict the PCA-Toes
based on the selected foot measurements using the fol-
lowing formula:
The findings of this study indicate that the clinician can
use a combination of simple, reliable, and time efficient
foot anthropometric measurements/ratios to explain over
75% of the plantar surface contact area either including or
excluding the toe region and to accurately predict an indi-
vidual's plantar surface contact area. While prediction
equations have been provided for both TPCA and PCA-
toes, the choice of whether to use TPCA or PCA-Toes
would be determined by clinician preference. While TPCA
provides the clinician information on the total amount of
surface area in contact with the supporting surface includ-
ing the toes, in those cases where the client or patient had
digital deformities such as hallux valgus, bunionette, claw
or hammer toes, the use of PCA-Toes may be more prefer-
able.
While the regression models described in this paper can
explain more than 75% of TPCA and PCA-Toes when
using a combination of foot measurements/ratios, previ-
ous attempts to use plantar surface contact area to predict
bony arch height have been less successful. While the find-
ings reported by Chu et al[5] and Shiang et al[6] indicated
that approximately 50% of the bony height of the medial
longitudinal arch could be explained on the basis of
plantar contact area, in contrast Hawes et al[7] and McPoil
et al[8] found that plantar surface contact area could only
explain approximately 4% to 27% of the bony height of
the medial longitudinal arch. Based on the results of the
current study, it would appear that the use of foot meas-
urements provides the clinician with a much more robust
prediction of plantar surface contact area in comparison
to using plantar surface area in an attempt to predict foot
structure such as the bony height of the medial longitudi-
nal arch. Conceptually, it would appear that the incorpo-
ration of the foot width measurements had the greatest
influence on the regression model to predict plantar sur-
face area. For both TPCA and PCA-Toes, midfoot width
was the variable that had the greatest effect on the fit of the
model.
In the current study, plantar contact surface area was
recorded while participants walked across a pressure sen-
sor platform. Urry and Wearing have reported that foot-
prints obtained from certain types of pressure platforms
with decreased sensor resolution are not the same as foot-
prints obtained using an inked mat when the data is col-
lected during static standing[14]. Although the pressure
sensor platform used in the current study had a greater
sensor resolution than the platform system that was used
by Urry and Wearing in their study, care should be used
when comparing the results reported in this study with
measures of plantar surface area obtained using a inked
mat in standing. The authors believe that obtaining data
dynamically, in activities such as walking, provides a more
functional representation of plantar surface contact area
in comparison to static standing.
−+ × + × +− ×45 18 13 72 15 21 146 14.(. )(. )( . )MFWid HLWid AHRatio
−+ × + × +− ×40 79 11 48 14 51 150 97.(. )(. )( . )MFWid HLWid AHRatio
Table 4: Mean and standard deviations (SD) for the six foot measurements and the one ratio by gender and extremity.
Foot Length Ball Length Ball Width MIdfoot Width Heel Width Dorsal Arch Hgt AHR
FEMALES
(N = 97)
Left 24.4
(1.2)
17.8
(0.9)
9.1
(0.5)
8.0
(0.6)
6.1
(0.4)
6.2
(0.4)
0.349
(0.026)
Right 24.4
(1.2)
17.9
(0.9)
9.2
(0.5)
8.1
(0.6)
6.1
(0.4)
6.1
(0.4)
0.342
(0.030)
MALES
(N = 58)
Left 26.7
(1.3)
19.5
(0.9)
10.2
(0.5)
9.1
(0.6)
6.8
(0.4)
6.9
(0.5)
0.354
(0.03)
Right 26.7
(1.2)
19.6
(0.9)
10.2
(0.6)
9.2
(0.6)
6.8
(0.4)
6.8
(0.5)
0.348
(0.030)
Publish with BioMed Central and every
scientist can read your work free of charge
"BioMed Central will be the most significant development for
disseminating the results of biomedical research in our lifetime."
Sir Paul Nurse, Cancer Research UK
Your research papers will be:
available free of charge to the entire biomedical community
peer reviewed and published immediately upon acceptance
cited in PubMed and archived on PubMed Central
yours — you keep the copyright
Submit your manuscript here:
/>BioMedcentral
Journal of Foot and Ankle Research 2009, 2:28 />Page 9 of 9
(page number not for citation purposes)
A limitation of the current study was the assumption by
the authors that when subjects were asked to stand and
place equal weight on each foot, that the subject was plac-
ing 50% of their body weight on each foot. While various
methodologies could have been utilized to ensure that
each subject was placing 50% of their body weight on
each foot while the measurements in standing were being
recorded, for example, having the subject stand with one
foot on a scale, the methodology used in the current study
can be easily replicated by clinicians. Tesser et al has pre-
viously reported that the amount of asymmetry in weight
distribution between extremities in relaxed standing is 4%
or less in healthy subjects[15]. Furthermore, while there
could be slight variations in weight bearing symmetry
between extremities when a subject is asked to stand with
equal weight placed on both feet, the high level of repeat-
ability of the foot anthropometric measurements utilized
in this study that were assessed over multiple days would
suggest that any degree of asymmetry is negligible.
Conclusion
While further research is always warranted, the results of
this study indicate that the clinician can use a combina-
tion of simple, reliable, and time efficient foot anthropo-
metric measurements/ratios to explain over 75% of the
plantar surface contact area. Prediction equations pro-
vided allow the practitioner to predict total plantar con-
tact surface area as well as plantar surface area minus the
toe region, based on clinical interest.
Competing interests
The authors declare that they have no competing interests.
Authors' contributions
TGM conceived the study, participated in the design of the
study, carried out data collection and analysis. BV partici-
pated in the design of the study and carried out data col-
lection. MWC participated in the design of the study and
carried out data analyses. NC carried out data collection.
References
1. Kaufman KR, Brodine SK, Shaffer RA, Johnson CW, Cullison TR: The
effect of foot structure and range of motion on musculoskel-
etal overuse injuries. Am J Sports Med 1999, 27:585-593.
2. Levy JC, Mizel MS, Wilson LS, Fox W, McHale K, Taylor DC, Temple
HT: Incidence of foot and ankle injuries in West Point cadets
with pes planus compared to the general cadet population.
Foot Ankle Int 2006, 27:1060-1064.
3. Michelson JD, Durant DM, McFarland E: The injury risk associated
with pes planus in athletes. Foot Ankle Int 2002, 23:629-633.
4. Hawes MR, Nachbauer W, Sovak D, Nigg BM: Footprint parame-
ters as a measure of arch height. Foot Ankle 1992, 13:22-26.
5. Chu WC, Lee SH, Chu W, Wang TJ, Lee MC: The use of arch
index to characterize arch height: a digital image processing
approach. IEEE Trans Biomed Eng 1995, 42:1088-1093.
6. Shiang TY, Lee SH, Lee SJ, Chu WC: Evaluating different foot-
print parameters as a predictor of arch height. IEEE Eng Med
Biol Mag 1998, 17:62-66.
7. McPoil TG, Cornwall MW: Use of plantar contact area to pre-
dict medial longitudinal arch height during walking. J Am Podi-
atr Med Assoc 2006, 96:489-494.
8. McPoil TG, Cornwall MW, Vicenzino B, Teyhan DS, Molloy JM, Chris-
tie DS, Collins N: Effect of truncated versus total foot length to
calculate the arch height index. Foot 2008, 18:220-227.
9. McPoil TG, Vicenzino B, Cornwall MW, Collins N, Warren M: Reli-
ability and normative values for the foot mobility magnitude:
a composite measure of vertical and medial-lateral mobility
of the midfoot. J Foot Ankle Res 2009, 2:6.
10. Shrout P, Fleiss J: Intraclass correlations: Uses in assessing
rater reliability. Psychol Bull 1979, 86:420-428.
11. Landis JR, Koch GG: The measurement of observer agreement
for categorical data. Biometrics 1977, 33:
159-174.
12. Rohner-Spengler M, Mannion AF, Babst R: Reliability and minimal
detectable change for the figure-of-eight-20 method of,
measurement of ankle edema. J Orthop Sports Phys Ther 2007,
37:199-205.
13. Rothstein JM: Measurement and Clinical Practice: The Theory
and Application. In Measurement in Physical Therapy Edited by:
Rothstein JM. New York: Churchill Livingstone; 1985:1.
14. Urry SR, Wearing SC: Arch indexes from ink footprints and
pressure platforms are different. Foot 2005, 15:68-73.
15. Teser S, Hagstrom N, Fallang B: Weight distribution in standing
and sitting positions, and weight transfer during reaching
tasks, in seated stroke subjects and healthy subjects. Physi-
other Res Int 2007, 12:82-94.