Báo cáo y học: "Diagnostic imaging for chronic plantar heel pain: a systematic review and meta-analysis" ppsx
Bạn đang xem bản rút gọn của tài liệu. Xem và tải ngay bản đầy đủ của tài liệu tại đây (1.52 MB, 11 trang )
BioMed Central
Page 1 of 11
(page number not for citation purposes)
Journal of Foot and Ankle Research
Open Access
Review
Diagnostic imaging for chronic plantar heel pain: a systematic
review and meta-analysis
Andrew M McMillan*
1,2
, Karl B Landorf
1,2
, Joanna T Barrett
1
,
Hylton B Menz
2
and Adam R Bird
1,2
Address:
1
Department of Podiatry, Faculty of Health Sciences, La Trobe University, Victoria, Australia and
2
Musculoskeletal Research Centre,
Faculty of Health Sciences, La Trobe University, Victoria, Australia
Email: Andrew M McMillan* - ; Karl B Landorf - ;
Joanna T Barrett - ; Hylton B Menz - ; Adam R Bird -
* Corresponding author
Abstract
Background: Chronic plantar heel pain (CPHP) is a generalised term used to describe a range of
undifferentiated conditions affecting the plantar heel. Plantar fasciitis is reported as the most
common cause and the terms are frequently used interchangeably in the literature. Diagnostic
imaging has been used by many researchers and practitioners to investigate the involvement of
specific anatomical structures in CPHP. These observations help to explain the underlying
pathology of the disorder, and are of benefit in forming an accurate diagnosis and targeted
treatment plan. The purpose of this systematic review was to investigate the diagnostic imaging
features associated with CPHP, and evaluate study findings by meta-analysis where appropriate.
Methods: Bibliographic databases including Medline, Embase, CINAHL, SportDiscus and The
Cochrane Library were searched electronically on March 25, 2009. Eligible articles were required
to report imaging findings in participants with CPHP unrelated to inflammatory arthritis, and to
compare these findings with a control group. Methodological quality was evaluated by use of the
Quality Index as described by Downs and Black. Meta-analysis of study data was conducted where
appropriate.
Results: Plantar fascia thickness as measured by ultrasonography was the most widely reported
imaging feature. Meta-analysis revealed that the plantar fascia of CPHP participants was 2.16 mm
thicker than control participants (95% CI = 1.60 to 2.71 mm, P < 0.001) and that CPHP participants
were more likely to have plantar fascia thickness values greater than 4.0 mm (OR = 105.11, 95%
CI = 3.09 to 3577.28, P = 0.01). CPHP participants were also more likely to show radiographic
evidence of subcalcaneal spur than control participants (OR = 8.52, 95% CI = 4.08 to 17.77, P <
0.001).
Conclusion: This systematic review has identified 23 studies investigating the diagnostic imaging
appearance of the plantar fascia and inferior calcaneum in people with CPHP. Analysis of these
studies found that people with CPHP are likely to have a thickened plantar fascia with associated
fluid collection, and that thickness values >4.0 mm are diagnostic of plantar fasciitis. Additionally,
subcalcaneal spur formation is strongly associated with pain beneath the heel.
Published: 13 November 2009
Journal of Foot and Ankle Research 2009, 2:32 doi:10.1186/1757-1146-2-32
Received: 16 September 2009
Accepted: 13 November 2009
This article is available from: />© 2009 McMillan et al; licensee BioMed Central Ltd.
This is an Open Access article distributed under the terms of the Creative Commons Attribution License ( />),
which permits unrestricted use, distribution, and reproduction in any medium, provided the original work is properly cited.
Journal of Foot and Ankle Research 2009, 2:32 />Page 2 of 11
(page number not for citation purposes)
Background
Chronic plantar heel pain (CPHP) is a generalised term
used to describe a range of undifferentiated conditions
affecting the plantar heel. Clinical features are typically
described as chronic pain beneath the heel, made worse
by weight-bearing after prolonged periods of rest [1].
Plantar fasciitis is reported as the most common cause of
CPHP [2] and the terms are frequently used interchangea-
bly in the literature [3]. CPHP is also associated with
inflammatory conditions such as spondyloarthritis [4],
though the majority of cases are unrelated to systemic dis-
ease [5].
The epidemiology of CPHP in the general population is
currently uncertain. An Australian population-based
study involving 3,206 randomly selected participants has
reported a heel pain prevalence of 3.6% [6]. American
studies estimate that 7% of older adults report tenderness
beneath the heel [7], and that 1 million physician consul-
tations per year are for the diagnosis and treatment of
plantar fasciitis [8]. Plantar fasciitis is also estimated to
account for approximately 8% of all running-related inju-
ries [9,10].
Diagnostic imaging has been used by many researchers
and practitioners to investigate the involvement of spe-
cific anatomical structures in CPHP. Imaging types used
include ultrasonography and magnetic resonance imaging
(MRI) for investigation of soft tissue structures (e.g. the
plantar fascia) and plain film x-rays for bone abnormali-
ties (e.g. heel spur). These observations help to explain the
underlying pathology of the disorder, and are of benefit in
forming an accurate diagnosis and targeted treatment
plan. Additionally, these studies provide objective criteria
by which to measure the effect of current and future treat-
ments.
At the time of writing, one published article had
attempted to critically review diagnostic imaging studies
for plantar fasciitis [11]. However, this review had a broad
scope including both assessment and treatment studies,
and did not include all available diagnostic imaging
research. Furthermore, the article presented only a limited
overview of study findings and did not investigate other
potential causes of CPHP (e.g. heel spur). Therefore, the
objective of this systematic review was to investigate all
diagnostic imaging features associated with CPHP and
evaluate study findings by meta-analysis where appropri-
ate.
Methods
Search strategy and eligibility criteria
A systematic review was conducted using the following
bibliographic databases: Medline, Embase, CINAHL,
SportDiscus and The Cochrane Library. Databases were
searched electronically on March 25, 2009 and 'auto-
alerts' were designed to deliver weekly updates of addi-
tional citations until June 30, 2009. A detailed description
of the search strategy is available in Additional File 1.
Studies included in the review were required to be pub-
lished in peer-reviewed journals and to describe original
research findings in the English language. Included stud-
ies had to report diagnostic imaging findings in partici-
pants with CPHP and compare these findings with an
independent control group. For the purpose of this
review, CPHP was defined as chronic pain localised
beneath the heel, made worse by weight-bearing after pro-
longed periods of rest [1]. This definition was used to
encompass a variety of clinical diagnostic terms such as
plantar fasciitis, plantar heel pain and heel spur syn-
drome. Studies included in this review were required to
either describe the signs and symptoms of participants as
being consistent with this definition, or to state a diagno-
sis known primarily by these clinical features (e.g. clinical
diagnosis of plantar fasciitis).
Studies in which comparisons were exclusively made
between the symptomatic and asymptomatic feet of par-
ticipants with unilateral CPHP were excluded. This deci-
sion was based on evidence that the asymptomatic foot of
people with unilateral CPHP may demonstrate osseus
[12] and soft tissue [13,14] abnormalities when com-
pared to people without CPHP. Studies exclusively inves-
tigating disease-specific cohorts (such as autoimmune
disease and diabetes mellitus), neurovascular abnormali-
ties, plantar fibromatosis and biomechanical variables
were also excluded. Plantar heel pad investigations were
excluded because they were considered to relate more to
risk factors associated with CPHP rather than the identifi-
cation of underlying pathology. All citations generated by
the search strategy were examined by two assessors
according to the criteria described above.
Assessment of methodological quality and diversity
Methodological quality was assessed by two authors (AM
and JB) who were blinded to author and publication
details. The assessment tool used for this process was a
modified version of the Quality Index originally described
by Downs and Black [15]. A detailed description of the
quality assessment tool is available in Additional File 2.
Outcome data and information regarding the overall
study design, subject characteristics and imaging tech-
niques were obtained by two authors (AM and JB) with
use of a standardised data extraction form. Studies were
grouped according to commonly reported imaging fea-
tures (e.g. plantar fascia thickness) and then by imaging
modality (e.g. ultrasonography). The clinical and meth-
odological diversity between studies was assessed to deter-
Journal of Foot and Ankle Research 2009, 2:32 />Page 3 of 11
(page number not for citation purposes)
mine the appropriateness of pooling data for meta-
analysis. Factors considered important for comparison
included the mean age, sex distribution, mean BMI and
comorbidity of both condition and control groups. The
clinical characteristics of the condition group, technical
imaging equipment used and outcome measurement
techniques were also compared. Two authors (AM and
KL) compared studies according to these features and
reached consensus on the appropriateness of progressing
to meta-analysis.
Data analysis
All data analyses were performed by use of Review Man-
ager software (RevMan Version 5.0.14. Copenhagen: The
Nordic Cochrane Centre, The Cochrane Collaboration,
2008). Statistical heterogeneity between studies was
assessed by use of I
2
and Chi
2
statistics. Values of I
2
range
between 0% and 100% and describe the percentage of var-
iability across study findings that is due to heterogeneity
rather than chance alone [16]. Heterogeneity was consid-
ered low if the I
2
value was 25% or less, moderate if the
value was between 25% and 50%, high if between 50%
and 75% and very high if greater than 75% [17]. Chi
2
was
performed with P < 0.1 considered statistically significant
due to the low power of this test in detecting heterogene-
ity (i.e. to increase the chance of detecting heterogeneity a
higher P value was chosen) [16]. Meta-analysis occurred
by the fixed-effect method where the I
2
statistic was less
than 50% and the Chi
2
test indicated a non-significant
degree of heterogeneity (P > 0.1). The random-effect
method was used where the I
2
statistic was greater than
50% and the Chi
2
test indicated statistically significant
heterogeneity (P < 0.1). Meta-analysis by the random-
effect method incorporates heterogeneity into the analy-
sis, resulting in a wider confidence interval and a more
conservative claim of statistical significance [16].
Continuous data were analysed by obtaining the mean
values, standard deviations (SD) and sample size for each
study within the group. The difference in means and 95%
confidence interval (CI) for each individual study were
calculated, and the weighted pooled estimate determined
by the inverse-variance method. For dichotomous data,
the odds ratio (OR) and 95% CI for each individual study
were calculated, and the weighted pooled estimate deter-
mined by the inverse variance method. Sensitivity analysis
was performed to exclude studies that did not apply a
blinding technique to the image assessor. Sub-group anal-
ysis was performed for groups containing ten studies or
more [16] to compare the pooled estimates of blinded
and non-blinded studies. However, formal sub-group
comparisons were not performed for heterogeneous data
(I
2
> 50%, P < 0.1) to reduce the risk of false positive
results [16].
Bias within groups containing 10 studies or more was
assessed by use of a funnel plot, in which effect estimates
of individual studies are plotted on the horizontal axis
against their standard error on the vertical axis [18]. In the
absence of bias, effect estimates of smaller studies are scat-
tered at the lower end of the plot with larger studies clus-
tered centrally towards the top, thereby forming a
symmetrical inverted funnel [19]. Absence of effect esti-
mates in the lower corners of funnel plots were inter-
preted as evidence of bias, suggesting the difference
between groups may be overestimated by meta-analysis
[18].
Eligibility criteria, quality assessment procedures and
methods of data analysis were specified prospectively and
outlined in an unpublished review protocol.
Results
A total 764 citations were identified by the database
search process (Additional file 3), of which 23 studies
were included in the review (Additional file 4). The exclu-
sion grounds for articles rejected after full-text assessment
are available in Additional file 5.
Quality index scores ranged from 29 to 80% (mean =
55%) demonstrating moderate overall methodological
quality (Additional file 6). The majority of studies pro-
vided inadequate descriptions of control group source
populations and characteristics, and only eight studies
[12,13,20-25] applied a blinding technique to the image
assessor. Additionally, 11 studies [12,13,22-24,26-31]
included data from both feet of control participants, and
11 studies [12,13,21,22,24,26-29,31,32] included data
from both feet of participants with bilateral heel pain. As
statistical tests assume that each data point represents a
truly independent observation, inclusion of both feet may
result in an artificially inflated sample size and decreased
data variability, thereby increasing the risk of Type I error
[33]. Despite these limitations, most studies reported pre-
determined outcome variables, and clearly described
imaging equipment settings and measurement tech-
niques.
Thickness of the proximal plantar fascia
The thickness of the proximal plantar fascia was reported
in 15 studies, 12 of which were measured by ultrasonog-
raphy alone [13,14,20,22,25,28-31,34-36], one by ultra-
sonography and magnetic resonance imaging (MRI) [23],
one by MRI alone [27], and one by plain film x-ray [21].
A factor considered important for this outcome was the
prevalence of diabetes mellitus within each group, as
research has shown a thickening of the plantar fascia in
people with diabetes [37]. Only two studies [21,22] con-
sidered diabetes as a specific exclusion criterion for condi-
Journal of Foot and Ankle Research 2009, 2:32 />Page 4 of 11
(page number not for citation purposes)
tion groups, and only one study [22] for the control
group.
Ultrasonography
The 13 studies reporting plantar fascia thickness by ultra-
sonography had a mean quality index score of 56%. Five
studies [13,20,22,23,25] applied a blinding technique to
the image assessor. A description of the methodological
variability between studies is available in Additional file
7.
As the protocols and participant characteristics of the
studies reporting this outcome were found to be similar,
meta-analysis was considered appropriate. However, two
studies could not be included: one study [31] reported
data separately for the medial, central and lateral compo-
nents of the plantar fascia, and another study [30] did not
report the standard deviation of the mean plantar fascia
thickness values.
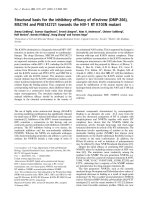
Eleven studies with a total 379 CPHP participants and 434
control participants were included in this analysis. Statis-
tical heterogeneity between studies was very high (I
2
=
95%; Chi
2
= 199.84, df = 10, P < 0.001), therefore meta-
analysis was undertaken using the random-effect method.
The mean difference between groups was statistically sig-
nificant (P < 0.001), with the proximal plantar fascia of
CPHP participants 2.16 mm thicker than control partici-
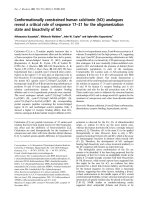
pants (95% CI = 1.60 to 2.71 mm) (Figure 1). Sub-group
analysis revealed a more conservative pooled estimate by
studies that applied a blinding technique to the image
assessor. The mean difference between groups for blinded
studies was 1.82 mm (95% CI = 1.00 to 2.65 mm, P <
0.001) and for non-blinded studies was 2.47 mm (95% CI
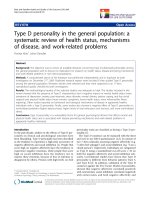
= 1.94 to 3.00 mm, P < 0.001) (Figure 2). Funnel plot
inspection revealed that studies were absent from the
lower left corner of the plot, suggesting that smaller stud-
ies reporting less difference between groups had not been
published. However, this distribution was explained by
identifying studies on the plot that applied a blinding
technique to the image assessor (Figure 3). Non-blinded
studies had smaller sample sizes than the majority of
blinded studies, and as a result appeared lower on the
plot. Therefore, the funnel plot distribution illustrates that
non-blinded studies reported larger mean differences
between groups than the majority of blinded studies, indi-
cating an overestimation of the thickness of the plantar
fascia in CPHP groups.
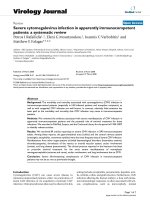
Two studies included in the analysis above [13,29] also
reported the proportion of participants in each group with
plantar fascia thickness values > 4.0 mm (i.e. the thickness
values for participants were dichotomised). Additionally,
one study included in the analysis above [25] reported the
individual thickness values for each participant, allowing
dichotomisation for the purpose of this review. These
studies included a total 161 CPHP participants and 116
control participants. Statistical heterogeneity between
studies was very high (I2 = 85%; Chi2 = 13.22, df = 2, P =
0.001), therefore meta-analysis was undertaken using the
random-effect method. The mean difference between
groups was statistically significant (P = 0.01) with CPHP
participants over 100 times more likely than control par-
ticipants to have plantar fascia thickness values > 4.0 mm
(OR = 105.11, 95% CI = 3.09 to 3577.28) (Figure 4).
MRI
Two studies measured the thickness of the proximal
plantar fascia by MRI. One study [23] applied a blinding
technique to the image assessor and had a quality index
score of 70%, the other [27] did not blind the image asses-
sor and had a quality index score of 43%. A description of
the methodological variability between studies is availa-
ble in Additional file 8. As the protocols and participant
Forest plot of studies reporting the thickness of the proximal plantar fascia by ultrasonographyFigure 1
Forest plot of studies reporting the thickness of the proximal plantar fascia by ultrasonography.
Journal of Foot and Ankle Research 2009, 2:32 />Page 5 of 11
(page number not for citation purposes)
characteristics of the studies reporting this outcome were
found to be similar, meta-analysis was considered appro-
priate.
Two studies with a total 78 CPHP participants and 163
control participants were included in this analysis. Statis-
tical heterogeneity between studies was very high (I
2
=
93%; Chi
2
= 13.50, df = 1, P < 0.001), therefore meta-anal-
ysis was undertaken using the random-effect method. The
mean difference between groups was statistically signifi-
cant (P < 0.001), with the proximal plantar fascia of CPHP
participants 3.35 mm thicker than control participants
(95% CI = 1.80 to 4.89 mm) (Figure 5). The blinded study
reported a more conservative difference between groups
(2.60 mm, 95% CI = 2.28 to 2.92 mm) than the non-
blinded study (4.18 mm, 95% CI = 3.40 to 4.96 mm).
Plain film x-ray
One study [21] measured the thickness of the proximal
plantar fascia by plain film x-ray. This study had a quality
index score of 68% and applied a blinding technique to
the image assessor. The sagittal thickness of the plantar
fascia was measured from a lateral non-weight bearing
radiograph within 5.0 mm of the calcaneal insertion. This
study reports a statistically significant mean difference
between groups, with the plantar fascia of CPHP partici-
pants 2.4 mm thicker than control participants (P <
0.001). The 95% CI for the difference between groups was
not reported.
Ultrasound echogenicity and MRI signal intensity of the
proximal plantar fascia
Four studies reported the echogenicity (presence or
absence of fluid collection) of the proximal plantar fascia
[13,20,29,36]. The mean quality index score was 60%,
and two studies [13,20] applied a blinding technique to
the image assessor. A description of the methodological
variability between studies is available in Additional file
9. As the protocols and participant characteristics of the
studies reporting this outcome were found to be similar,
meta-analysis was considered appropriate.
Four studies with a total 209 CPHP participants and 146
control participants were included in this analysis. Statis-
tical heterogeneity between studies was low (I
2
= 0%; Chi
2
= 0.20, df = 3, P = 0.98), therefore meta-analysis was
undertaken using the fixed-effect method. The mean dif-
ference between groups was statistically significant (P <
0.001) with CPHP participants over 200 times more likely
to demonstrate hypoechogenicity of the proximal plantar
fascia than control participants (OR = 204.12, 95% CI =
52.00 to 801.28) (Figure 6). Sensitivity analysis revealed
an increased pooled estimate after exclusion of the two
[29,36] non-blinded studies (OR = 211.87, 95% CI =
28.53 to 1573.54, P < 0.001).
One study [27] reported the MRI signal intensity (pres-
ence or absence of fluid collection) of the proximal
plantar fascia. This study had a quality index score of 43%
Forest plot of studies reporting the thickness of the proximal plantar fascia by ultrasonographyFigure 2
Forest plot of studies reporting the thickness of the proximal plantar fascia by ultrasonography. Sub-group analy-
sis: blinding versus no blinding of image assessor.
Journal of Foot and Ankle Research 2009, 2:32 />Page 6 of 11
(page number not for citation purposes)
and did not apply a blinding technique to the image asses-
sor. Increased signal intensity was observed in the region
of fascia thickening for CPHP participants, compared with
homogenous low signal intensity of the plantar fascia in
all control participants.
Evidence of plantar calcaneal spur
Seven studies reported evidence of plantar calcaneal spur
by plain film x-ray [12,21,24,26,38-40]. The mean quality
index score was 58% and only three studies [12,21,24]
applied a blinding technique to the image assessor. A
description of the methodological variability between
studies is available in Additional file 10. As the protocols
and participant characteristics of the studies reporting this
outcome were found to be similar, meta-analysis was con-
sidered appropriate.
Seven studies with a total 322 CPHP participants and 749
control participants were included in this analysis. Statis-
tical heterogeneity between studies was high (I
2
= 74%;
Chi
2
= 23.25, df = 6, P < 0.001), therefore meta-analysis
was undertaken using the random-effect method. The
mean difference between groups was statistically signifi-
cant (P < 0.001) with CPHP participants over 8 times
more likely to show evidence of subcalcaneal spur than
control participants (OR = 8.52, 95% CI = 4.08 to 17.77)
(Figure 7). Sensitivity analysis revealed an increased
pooled estimate after exclusion of the four [26,38-40]
non-blinded studies (OR = 16.11, 95% CI = 7.09 to 36.60,
P < 0.001).
One study [30] reported evidence of subcalcaneal spur by
ultrasonography. This study had a quality index score of
43% and did not apply a blinding technique to the image
assessor. A variable frequency (5-10 MHz) linear array
transducer was used to assess the heels of 190 CPHP and
48 control participants. The presence of subcalcaneal spur
was a subjective observation found in 45% of CPHP par-
ticipants and only 2% of control participants.
Radioisotope uptake and vascular perfusion of the
proximal plantar fascia
Three studies reported the presence of increased radioiso-
tope uptake within the subcalcaneal region in participants
with CPHP [12,40,41]. The mean quality index score was
45% and one study [12] applied a blinding technique to
the image assessor. Meta-analysis of data from these stud-
ies was not found to be appropriate as one study did not
report the control group sample size [12], and another did
not report the phase (early or delayed) in which scinti-
graphic images were assessed [40]. Participant characteris-
tics of condition [41] and control [12] groups were also
poorly reported. All three studies reported increased sub-
calcaneal uptake of technetium-99 m methylene diphos-
phonate in participants with CPHP compared to control
groups (Figure 8), though no statistical comparisons were
made.
One study described the degree of vascular perfusion
within the proximal plantar fascia by use of power dop-
pler ultrasound [36]. This study had a quality index score
Funnel plot of studies reporting the thickness of the proximal plantar fascia by ultrasonographyFigure 3
Funnel plot of studies reporting the thickness of the
proximal plantar fascia by ultrasonography. Sub-group
analysis: blinding versus no blinding of image assessor.
Forest plot of ultrasonography studies reporting proximal plantar fascia thickness values > 4.0 mmFigure 4
Forest plot of ultrasonography studies reporting proximal plantar fascia thickness values > 4.0 mm.
Journal of Foot and Ankle Research 2009, 2:32 />Page 7 of 11
(page number not for citation purposes)
of 47% and did not apply a blinding technique to the
image assessor. Doppler ultrasound with a pulse-repeti-
tion frequency of 1102 Hz was used to grade the colour
signal of the proximal plantar fascia. This study reported
moderate to marked hyperaemia of the proximal plantar
fascia in 8 of 20 CPHP participants, and only mild hyper-
aemia in 1 of 20 control participants. The difference
between groups was not statistically analysed, however
the authors report a statistically significant correlation
between hyperaemia and symptom duration of less than
six months (Spearman r = -0.68, P < 0.05).
Discussion
The objective of this systematic review was to investigate
the diagnostic imaging features associated with CPHP and
evaluate study findings by meta-analysis where appropri-
ate. The majority of studies provided inadequate descrip-
tions of control group characteristics and only a small
proportion applied a blinding technique to the image
observer. Furthermore, by including data from both feet
of participants, the sample sizes of approximately half the
studies were inappropriately inflated. While the clinical
signs and symptoms of CPHP participants were similarly
described across the studies, various diagnostic terms have
been used, including plantar fasciitis, painful heel syn-
drome and inferior calcaneal spur syndrome.
The studies included in this review describe a fusiform
thickening of the plantar fascia close to the calcaneal
enthesis, with associated fluid collection and increased
vascularity. These findings suggest that many patients
with chronic pain beneath the heel are likely to have
plantar fasciitis, and that changes in the thickness of the
plantar fascia may be particularly useful in diagnosing the
condition. For example, plantar fascia thickness values
greater than 4.0 mm have previously been used to form a
case definition in plantar fasciitis research [23]. This refer-
ence value is supported by the data analysis of this review,
though the threshold value of 4.0 mm relates only to
measurement by ultrasonography.
Plantar fascia thickness values have also been used to
measure the effect of treatments. For example, corticoster-
oid injection has been shown to significantly reduce
plantar fascia thickness as early as two weeks [42] and one
month [20] following treatment. Additionally, one of
these studies [20] reports a statistically significant correla-
tion between decreased plantar fascia thickness and
improvement in symptoms (Pearson r = 0.61, P < 0.001).
The intra-rater reliability of measuring plantar fascia
thickness by ultrasonography has been reported to be very
good, with the 95% limits of agreement ranging from -0.7
mm to 0.5 mm [43]. However, the reliability of this tech-
nique has not been examined in detail.
In addition to fascia thickening, areas of hypoechogenic-
ity within the proximal plantar fascia have also been com-
monly reported and are strongly associated with CPHP.
Forest plot of studies reporting the thickness of the proximal plantar fascia by MRIFigure 5
Forest plot of studies reporting the thickness of the proximal plantar fascia by MRI.
Forest plot of studies reporting hypoechogenicity of the proximal plantar fasciaFigure 6
Forest plot of studies reporting hypoechogenicity of the proximal plantar fascia.
Journal of Foot and Ankle Research 2009, 2:32 />Page 8 of 11
(page number not for citation purposes)
Sonographic studies have attributed this feature to the
presence of underlying reparative processes, with associ-
ated fibre deterioration and tissue oedema [29,36]. Evi-
dence from histopathological studies in plantar fasciitis
support this view, with increased mucoid ground sub-
stance, collagen degeneration and angiofibroblastic
hyperplasia the most commonly reported features [44].
However, markers of persistent inflammation such as
lymphocyte and macrophage infiltration have been less
frequently reported in the condition [44]. This suggests
that plantar fasciitis may follow a similar pathological
pathway to that of tendinopathy, where tissue changes are
thought to proceed from an early reactive phase to pro-
gressive degeneration [44,45]. Imaging studies in tendin-
opathy provide evidence of similarity between these
conditions, in which tendon appears thickened with focal
areas of hypoechogenicity and increased vascularity
[45,46]. Furthermore, tendon has been found to respond
to corticosteroid injection in a similar way to the plantar
fascia, with one study reporting a significant reduction in
tendon diameter as early as one week following treatment
[47]. Future longitudinal research investigating the imag-
ing features and histology of plantar fasciits would be of
great value, as direct evidence for pathological change
over time is currently lacking. This concept has particular
relevance to the management of CPHP, as future interven-
tions may be selected according to condition chronicity.
The role of subcalcaneal spur in the pathogenesis of CPHP
has been questioned in musculoskeletal medicine for sev-
eral decades [39,44]. The basis of this uncertainty is the
reportedly high prevalence of subcalcaneal spur in the
asymptomatic population [38], leading to an emerging
view that the finding has limited diagnostic value [2].
However, comparisons to asymptomatic control groups
in the statistical analysis of this review (odds ratio) dem-
onstrate a strong association between CPHP and the pres-
ence of subcalcaneal spur. Inconsistencies in the
association between spur formation and heel pain have
not been adequately investigated, but possible explana-
tions include variations in spur length (i.e. longer spurs
may be more symptomatic) [39] and concurrent fat pad
abnormalities [21,24].
Forest plot of studies reporting evidence of plantar calcaneal spur by plain film x-rayFigure 7
Forest plot of studies reporting evidence of plantar calcaneal spur by plain film x-ray.
Forest plot of studies reporting increased subcalcaneal radioisotope uptakeFigure 8
Forest plot of studies reporting increased subcalcaneal radioisotope uptake. *Control group sample size not
reported.
Journal of Foot and Ankle Research 2009, 2:32 />Page 9 of 11
(page number not for citation purposes)
As the majority of studies investigating the presence of
subcalcaneal spur used plain film x-ray, the precise rela-
tionships between spur formation and surrounding soft
tissue were not reported. Nonetheless, one study
described the location of spurs as being closely associated
with the abductor hallucis and flexor digitorum brevis ori-
gins [21]. This finding is consistent with evidence from
cadaveric research, in which subcalcaneal spurs are
reported to most commonly occur immediately deep to
the plantar fascia enthesis [48].
The formation of subcalcaneal spur has traditionally been
attributed to repetitive longitudinal traction of the plantar
fascia [39], with subsequent inflammation and reactive
ossification [49]. However, recent histological and clinical
studies suggest that vertical compressive forces may play a
more important role [48,49]. Histological evidence shows
that: spur formation can occur in loose connective tissue,
surrounding fibrocartilage may not be aligned with the
direction of traction, and spur trabeculae commonly
forms perpendicular to its long axis [48]. Additionally,
clinical studies have shown that spur development is
unrelated to medial arch height [49] and can occur after
surgical release of the plantar fascia [50].
In the clinical management of CPHP, diagnostic imaging
can provide objective information by which to either con-
firm or question the diagnosis of plantar fasciitis. This
information can be particularly useful in cases that do not
respond to first-line interventions, or when considering
more invasive treatments (e.g. corticosteroid injection).
The presence of a subcalcaneal spur in patients with CPHP
is also likely to be an important finding, though a causal
relationship has not been established. Further research
involving the use of MRI and histological techniques is
required to better define the role of spur formation and
related bony abnormalities in the development of CPHP.
While this review was designed to be as comprehensive as
possible, it is feasible that some studies that may have
been suitable were not identified. In addition, as this
review only included studies in which comparisons were
made to asymptomatic control groups, many case-series
studies and individual case reports have not been
included. Therefore, the findings of this review are not
exhaustive and do not describe all imaging features asso-
ciated with CPHP.
Conclusion
This systematic review has identified 23 studies investigat-
ing the diagnostic imaging appearance of the plantar fas-
cia and inferior calcaneum in people with CPHP. Analysis
of these studies found that people with CPHP are likely to
have a thickened plantar fascia with associated fluid col-
lection, and that thickness values >4.0 mm are diagnostic
of plantar fasciitis. Additionally, subcalcaneal spur forma-
tion is strongly associated with pain beneath the heel.
Competing interests
HBM and KBL are Editor-in-Chief and Deputy Editor-in-
Chief, respectively, of the Journal of Foot and Ankle
Research. It is journal policy that editors are removed from
the peer review and editorial decision making processes
for papers they have co-authored.
Authors' contributions
AMM led and designed the review, carried out searches
and eligibility checks, extracted study data and performed
the quality assessment, evaluated the appropriateness of
pooling data, performed the meta-analyses, interpreted
the findings and drafted the manuscript. KBL assisted in
designing the review, evaluated the appropriateness of
pooling data, assisted in the interpretation of findings and
commented on the draft manuscript. JTB extracted study
data, performed the quality assessment and commented
on the draft manuscript. HBM assisted in the interpreta-
tion of findings and commented on the draft manuscript.
ARB assisted in the review process and commented on the
draft manuscript.
All authors read and approved the final manuscript.
Additional material
Additional file 1
Description of search strategy. A detailed description of the database
search strategy.
Click here for file
[ />1146-2-32-S1.pdf]
Additional file 2
Description of quality assessment tool. A detailed description of the
Downs and Black quality assessment tool.
Click here for file
[ />1146-2-32-S2.pdf]
Additional file 3
Search results by database. A table showing the number of citations gen-
erated by the search strategy for each database.
Click here for file
[ />1146-2-32-S3.pdf]
Additional file 4
Included studies. A table showing the author and publication details of
the included studies.
Click here for file
[ />1146-2-32-S4.pdf]
Journal of Foot and Ankle Research 2009, 2:32 />Page 10 of 11
(page number not for citation purposes)
Acknowledgements
AMM is currently an Australian Postgraduate Award scholarship holder.
HBM is currently a National Health and Medical Research Council fellow
(Clinical Career Development Award, ID: 4333049). No other sources of
funding were provided for this review.
References
1. Buchbinder R: Plantar Fasciitis. N Engl J Med 2004,
350(21):2159-2166.
2. Singh D, Angel J, Bentley G, Trevino S: Fortnightly review: Plantar
fasciitis. Br Med J 1997, 315:172-175.
3. Irving DB, Cook JL, Menz HB: Factors associated with chronic
plantar heel pain: a systematic review. J Sci Med Sport 2006,
9(1-2):11-22.
4. D'Agostino MA, Olivieri I: Enthesitis. Best Pract Res Clin Rheumatol
2006, 20(3):473-486.
5. Furey JG: Plantar fasciitis. The painful heel syndrome. J Bone
Joint Surg 1975, 57:672-673.
6. Hill CL, Gill TK, Menz HB, Taylor AW: Prevalence and correlates
of foot pain in a population-based study: the North West
Adelaide health study. J Foot Ankle Res 2008, 1(2):.
7. Dunn JE, Link CL, Felson DT, Crincoli MG, Keysor JJ, McKinlay JB:
Prevalence of foot and ankle conditions in a multiethnic
community sample of older adults. Am J Epidemiol 2004,
159(5):491-498.
8. Riddle DL, Schappert SM: Volume of ambulatory care visits and
patterns of care for patients diagnosed with plantar fasciitis:
a national study of medical doctors. Foot Ankle Int 2004,
25(5):303-310.
9. Taunton JE, Ryan MB, Clement DB, McKenzie DC, Lloyd-Smith DR,
Zumbo BD: A retrospective case-control analysis of 2002 run-
ning injuries. Br J Sports Med 2002, 36:95-101.
10. Lysholm J, Wiklander J: Injuries in runners. Am J Sports Med 1987,
15(2):168-171.
11. Rome K, Saxelby J: Assessment and management of plantar
fasciitis. British Journal of Podiatry 2005, 8(2):34-44.
12. Williams PL, Smibert JG, Cox R, Mitchell R, Klenerman L: Imaging
study of the painful heel syndrome. Foot Ankle 1987,
7(6):345-349.
13. Tsai WC, Chiu MF, Wang CL, Tang FT, Wong MK: Ultrasound
evaluation of plantar fasciitis. Scand J Rheumatol 2000,
29(4):255-259.
14. Wearing SC, Smeathers JE, Sullivan PM, Yates B, Urry SR, Dubois P:
Plantar fasciitis: are pain and fascial thickness associated
with arch shape and loading? Phys Ther 2007, 87(8):1002-1008.
15. Downs SH, Black N: The feasibility of creating a checklist for
the assessment of the methodological quality both of ran-
domised and non-randomised studies of health care inter-
ventions. J Epidemiol Community Health 1998, 52(6):377-384.
16. Deeks J, Higgins J, Altman D, Editors: Chapter 9: Analysing data
and undertaking meta-analyses. In Cochrane Handbook for Sys-
tematic Reviews of Interventions Version 501 [updated September 2008]
Edited by: Higgins J, Green S. The Cochrane Collaboration; 2008.
17. Higgins J, Thompson S, Deeks J, Altman D: Measuring inconsist-
ency in meta-analyses. Br Med J 2003, 327(7414):557-560.
18. Sterne J, Egger M, Moher D, Editors: Chapter 10: Addressing
reporting biases. In Cochrane Handbook for Systematic Reviews of
Interventions Version 501 [updated September 2008] Edited by: Higgins
J, Green S. The Cochrane Collaboration; 2008.
19. Egger M, Smith G, Schneider M, Minder C: Bias in meta-analysis
detected by a simple, graphical test. Br Med J 1997,
315:629-634.
20. Genc H, Saracoglu M, Nacir B, Erdem HR, Kacar M: Long-term
ultrasonographic follow-up of plantar fasciitis patients
treated with steroid injection. Joint Bone Spine 2005,
72(1):61-65.
21. Osborne HR, Breidahl WH, Allison GT: Critical differences in lat-
eral X-rays with and without a diagnosis of platar fasciitis. J
Sci Med Sport 2006, 9(3):231-237.
22. Ozdemir H, Yilmaz E, Murat A, Karakurt L, Poyraz AK, Ogur E:
Sonographic evaluation of plantar fasciitis and relation to
body mass index. Eur J Radiol 2005, 54(3):443-447.
23. Sabir N, Demirlenk S, Yagci B, Karabulut N, Cubukcu S: Clinical util-
ity of sonography in diagnosing plantar fasciitis. J Ultrasound
Med 2005, 24(8):1041-1048.
24. Turgut A, Gokturk E, Kose N, Seber S, Hazer B, Gunal I: The rela-
tionship of heel pad elasticity and plantar heel pain.
Clin
Orthop 1999:191-196.
25. Wall JR, Harkness MA, Crawford A: Ultrasound diagnosis of
plantar fasciitis. Foot Ankle 1993, 14(8):465-470.
26. Akfirat M, Sen C, Gunes T: Ultrasonographic appearance of the
plantar fasciitis. Clin Imaging 2003, 27(5):353-357.
27. Berkowitz JF, Kier R, Rudicel S: Plantar fasciitis: M.R imaging.
Radiology 1991, 179(3):665-667.
28. Bygrave CJ, Betts RP, Saxelby J: Diagnosing plantar fasciitis with
ultrasound using Planscan. Foot 1998, 8(3):141-146.
Additional file 5
Exclusion grounds for articles rejected after full-text assessment. A
table showing the exclusion grounds for articles excluded from the review
after full-text assessment.
Click here for file
[ />1146-2-32-S5.pdf]
Additional file 6
Quality Index Scores. A table showing the individual quality index scores
for each included article.
Click here for file
[ />1146-2-32-S6.pdf]
Additional file 7
Thickness of the proximal plantar fascia by ultrasonography: variabil-
ity between studies. A detailed description of the methodological variabil-
ity between studies reporting plantar fascia thickness by ultrasonography.
Click here for file
[ />1146-2-32-S7.pdf]
Additional file 8
Thickness of the plantar fascia by MRI: variability between studies. A
detailed description of the methodological variability between studies
reporting plantar fascia thickness by MRI.
Click here for file
[ />1146-2-32-S8.pdf]
Additional file 9
Echogenicity of the proximal plantar fascia: variability between stud-
ies. A detailed description of the methodological variability between stud-
ies reporting plantar fascia echogenicity.
Click here for file
[ />1146-2-32-S9.pdf]
Additional file 10
Evidence of plantar calcaneal spur by plain film x-ray: variability
between studies. A detailed description of the methodological variability
between studies reporting evidence of plantar calcaneal spur by plain film
x-ray.
Click here for file
[ />1146-2-32-S10.pdf]
Publish with BioMed Central and every
scientist can read your work free of charge
"BioMed Central will be the most significant development for
disseminating the results of biomedical research in our lifetime."
Sir Paul Nurse, Cancer Research UK
Your research papers will be:
available free of charge to the entire biomedical community
peer reviewed and published immediately upon acceptance
cited in PubMed and archived on PubMed Central
yours — you keep the copyright
Submit your manuscript here:
/>BioMedcentral
Journal of Foot and Ankle Research 2009, 2:32 />Page 11 of 11
(page number not for citation purposes)
29. Cardinal E, Chhem RK, Beauregard CG, Aubin B, Pelletier M: Plantar
fasciitis: sonographic evaluation. Radiology 1996,
201(1):257-259.
30. Gibbon WW, Long G: Ultrasound of the plantar aponeurosis
(fascia). Skeletal Radiol 1999, 28(1):21-26.
31. Vohra PK, Kincaid BR, Japour CJ, Sobel E: Ultrasonographic eval-
uation of plantar fascia bands. A retrospective study of 211
symptomatic feet. J Am Podiatr Med Assoc 2002, 92(8):444-449.
32. Hall RL, Erickson SJ, Shereff MJ, Johnson JE, Kneeland JB: Magnetic
resonance imaging in the evaluation of heel pain. Orthopedics
1996, 19(3):225-229.
33. Menz HB: Two feet, or one person? Problems associated with
statistical analysis of paired data in foot and ankle medicine.
Foot 2004, 14:2-5.
34. Kamel M, Kotob H: High frequency ultrasonographic findings
in plantar fasciitis and assessment of local steroid injection. J
Rheumatol 2000, 27(9):2139-2141.
35. Karabay N, Toros T, Hurel C: Ultrasonographic evaluation in
plantar fasciitis. J Foot Ankle Surg 2007, 46(6):442-446.
36. Walther M, Radke S, Kirschner S, Ettl V, Gohlke F: Power Doppler
findings in plantar fasciitis. Ultrasound Med Biol 2004,
30(4):435-440.
37. Giacomozzi C, D'Ambrogi E, Uccioli L, Macellari V: Does the thick-
ening of Achilles tendon and plantar fascia contribute to the
alteration of diabetic foot loading? Clin Biomech 2005,
20:532-539.
38. Prichasuk S, Subhadrabandhu T: The relationship of pes planus
and calcaneal spur to plantar heel pain. Clin Orthop
1994:192-196.
39. Wainwright AM, Kelly AJ, Winson IG: Calcaneal spurs and
plantar fasciitis. Foot 1995, 5(3):123-126.
40. Cetin A, Sivri A, Dincer F, Kiratli P, Ceylan E: Evaluation of chronic
plantar fasciitis by scintigraphy and relation to clinical
parameters.
J Musculoskeletal Pain 2001, 9(4):55-61.
41. O'Duffy EK, Clunie GP, Gacinovic S, Edwards JC, Bomanji JB, Ell PJ:
Foot pain: specific indications for scintigraphy. Br J Rheumatol
1998, 37(4):442-447.
42. Tsai W, Hsu C, Chen C, Chen M, Yu T, Chen Y: Plantar fasciitis
treated with local steroid injection: comparison between
sonographic and palpation guidance. J Clin Ultrasound 2006,
34(1):12-16.
43. Wearing SC, Smeathers JE, Yates B, Sullivan PM, Urry SR, Dubois P:
Sagittal movement of the medial longitudinal arch is
unchanged in plantar fasciitis. Med Sci Sports Exerc 2004,
36(10):1761-1767.
44. Wearing SC, Smeathers JE, Urry SR, Hennig EM, Hills AP: The
pathomechanics of plantar fasciitis. Sports Med 2006,
36(7):585-611.
45. Cook JL, Purdam CR: Is tendon pathology a continuum? A
pathology model to explain the clinical presentation of load-
induced tendinopathy. Br J Sports Med 2009, 43:409-416.
46. Leung JL, Griffith JF: Sonography of chronic Achilles tendinopa-
thy: a case-control study. J Clin Ultrasound 2008, 36(1):27-32.
47. Fredberg U, Bolvig L, Pfeiffer-Jensen M, Clemmensen D, Jakobsen B,
Stengaard-Pedersen K: Ultrasonography as a tool for diagnosis,
guidance of local steroid injection and, together with pres-
sure algometry, monitoring of the treatment of athletes
with chronic jumper's knee and Achilles tendinitis: a rand-
omized, double-blind, placebo-controlled study. Scand J Rheu-
matol 2004, 33:94-101.
48. Li J, Muehleman C: Anatomic relationship of heel spur to sur-
rounding soft tissues: greater variability than previously
reported. Clin Anat 2007, 20:950-955.
49. Menz HB, Zammit GV, Landorf KB, Munteanu SE: Plantar calcaneal
spurs in older people: longitudinal traction or vertical com-
pression? J Foot Ankle Res 2008, 1:7.
50. Tountas AA, Fornasier VL: Operative treatment of subcalcaneal
pain.
Clin Orthop 1996, 332:170-178.