Báo cáo y học: "A comparison of foot arch measurement reliability using both digital photography and calliper methods" pdf
Bạn đang xem bản rút gọn của tài liệu. Xem và tải ngay bản đầy đủ của tài liệu tại đây (702.07 KB, 6 trang )
JOURNAL OF FOOT
AND ANKLE RESEARCH
Pohl and Farr Journal of Foot and Ankle Research 2010, 3:14
/>Open Access
RESEARCH
© 2010 Pohl and Farr; licensee BioMed Central Ltd. This is an Open Access article distributed under the terms of the Creative Commons
Attribution License ( which permits unrestricted use, distribution, and reproduction in
any medium, provided the original work is properly cited.
Research
A comparison of foot arch measurement reliability
using both digital photography and calliper
methods
Michael B Pohl*
1,2
and Lindsay Farr
2
Abstract
Background: Both calliper devices and digital photographic methods have been used to quantify foot arch height
parameters. The purpose of this study was to compare the reliability of both a calliper device and digital photographic
method in determining the arch height index (AHI).
Methods: Twenty subjects underwent measurements of AHI on two separate days. On each day, AHI measurements
during both sitting and standing were taken using the AHIMS and digital photographic methods by the same single
tester. The intra-tester reliability of each measurement technique was assessed using intraclass correlation coefficients
(ICC) and standard error of measurement (SEM). Additionally, the relationship between AHI measurements derived
from the two different methods was assessed using a correlation analysis.
Results: The reliability for both the AHIMS and digital photographic methods was excellent with ICC values exceeding
0.86 and SEM values of less than 0.009 for the AHI. Moreover, the reliability of both measurement techniques was
equivalent. There was a strong positive correlation between the AHI values collected using both methods. AHI values
calculated using the digital photographic method tended to be greater than those derived using the AHIMS.
Conclusion: Digital photographic methods offer equivalent intra-tester reliability to previously established calliper
methods when assessing AHI. While AHI measurements calculated using both methods were highly related, the
greater AHI values in the photographic method implied caution should be exercised when comparing absolute values
between the two methods. Future studies are required to determine whether digital photographic methods can be
developed with improved validity.
Background
The foot is the site at which external forces are applied to
the body. Since the foot then transfers these loads further
up the kinetic chain, its structure has often been studied
in relation to overuse injuries of the lower extremity [1-
3]. In particular, the height of the medial longitudinal
arch has become a common measurement used to clas-
sify foot structure [4-7].
While radiographic measurements are the gold stan-
dard in determining the bony structure of the foot, many
research laboratories do not have access to such methods.
The arch height index (AHI) was developed by Williams
and McClay [6] to quantify the height of the arch using
handheld callipers. Briefly the AHI is calculated by divid-
ing the height of the dorsum by the truncated foot length
(distance from the heel to the first metatarsal head).
Although the measurements were stated to be somewhat
awkward when performed using handheld callipers, the
development of the arch height index measurement sys-
tem (AHIMS), a mechanical device, improved the ease of
taking measurements [8,9]. The measurements of AHI
taken using a mechanical device have demonstrated good
intra- and inter-tester reliability [8], in addition to validity
when compared with equivalent radiographic measure-
ments [6]. However, the reliability has only been quanti-
fied using intraclass correlation coefficients. Expressing
reliability measurements in terms of coefficients makes it
difficult to clinically interpret the results, since the
reported reliability units are different from the units of
* Correspondence:
1
Faculty of Kinesiology, University of Calgary, AB, Canada
Full list of author information is available at the end of the article
Pohl and Farr Journal of Foot and Ankle Research 2010, 3:14
/>Page 2 of 6
the variable of interest [10]. Therefore, it is desirable to
also report reliability within the context of the intended
clinical units.
While devices such as the AHIMS have been shown to
be reliable and valid, they can be costly to buy or con-
struct. An alternative idea developed recently involved
the use of digital photography to assess the height of the
arch [5]. Digital photographic techniques potentially offer
a highly practical, convenient and cost effective method
of assessing arch structure within a clinical or laboratory
setting. Such a technique has been shown to demonstrate
good to high levels of intra- and inter-tester reliability as
well as validity [5]. However, while the study did include
the assessment of dorsum height, the reliability of the
AHI was not calculated. Therefore, it is difficult to inter-
pret whether the digital photographic method of assess-
ing arch height is as reliable as the equivalent
measurement taken with mechanical calliper devices
such as those used by Butler and colleagues [8]. Between-
day differences in measurements taken using digital pho-
tography may arise from errors in manual digitising and
camera placement, in addition to the discrepancies that
also afflict calliper measurements such as participant
positioning. However, reliability measurements for the
digital photographic technique have only been calculated
based on one photograph of the subject [5]. Therefore,
the effect of participant and camera positioning between
measurements has not been assessed and requires inves-
tigation.
In summary, methods of quantifying the arch height of
the foot have been proposed using either manufactured
calliper devices or digital photography. However, it
remains unclear whether the two techniques demonstrate
similar levels of between-day reliability. Therefore, the
purpose of this study was to compare the intra-tester reli-
ability of determining arch height when using both a calli-
per device and digital photographic methods. These
reliability data will provide confirmation as to whether
photographic techniques can calculate AHI with similar
reliability to existing calliper methods.
Methods
Subjects
Twenty subjects (6 males and 14 females) volunteered to
participate in the study. Subjects were recruited from the
University population and the surrounding community.
The mean age of subjects was 29.9 ± 5.8 years with a
mean weight of 70.4 ± 11.7 kg. The institutional review
board approved the study and all subjects provided writ-
ten informed consent prior to data collection. Subjects
were free from lower-extremity injury at the time of test-
ing.
Experimental protocol
Each subject visited the laboratory on two separate days
to have measurements taken on their right foot. Prior to
the collection of the foot measurements on the first visit,
the weight of the subject was recorded. On each day,
measurements were taken using both the AHIMS and
digital photographic methods by the same tester. The tes-
ter had six months of experience using the AHIMS within
a clinical setting.
A portable instrument for measuring the AHI was cus-
tom-built based on the AHIMS developed by Richards et
al. [9]. This device consisted of a heel cup and series of
sliding callipers and rulers (Figure 1). Subjects began
seated with their right hip, knee and ankle joints at 90°.
Two blocks (thickness = 4.5 cm) were placed under the
heel and metatarsal heads of the right foot leaving the
arch unsupported. The left foot was placed 15 cm medial
to the right foot on a weighing scale (thickness = 4.5 cm)
so that the distal end of the hallux of the left foot was
positioned 5 cm behind the heel of the right foot. This
ensured a clear view of the medial aspect of the right foot
which was required for the digital photographic method
(see below). The AHIMS was then placed so that the heel
cup was against the heel of the right foot and sliding hori-
zontal callipers were used to measure the foot length (FL)
and truncated foot length (TFL) (distance from the heel
to first metatarsal head). A vertical sliding calliper was
then positioned at 50% of the FL, and subsequently used
to measure the height of the dorsal arch (DH). The AHI
was calculated as the ratio DH:TFL [6]. The subject then
stood up with their weight equally distributed on both
feet (50% WB) and the measurements were repeated. A
final set of measurements were also taken with the sub-
ject standing with 90% of their body weight distributed
on the right foot (90% WB). A load of 90% BW on the
right foot was achieved by asking subjects to lift their left
foot off the weighing scale without leaning to either side,
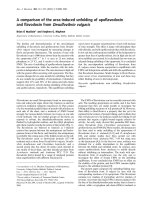
Figure 1 The Arch height index measurement device (AHIMS).
The heel is placed against the heel cup (A) and the sliding callipers D
and C are aligned against the distal phalanx and first metatarsal head
respectively. A third calliper (B) is lowered to the dorsal arch at 50% of
the FL.
Pohl and Farr Journal of Foot and Ankle Research 2010, 3:14
/>Page 3 of 6
until the scale showed that only 10% BW remained on
that foot.
The digital photographic method involved the same
subject set-up as described for the AHIMS. As with the
AHIMS, blocks were placed under the right foot with the
left foot positioned behind on the weighing scale. A small
mark was made on the first metatarsal head to enable the
identification of this landmark in the photos. A digital
camera (Model Powershot A540, Canon, Tokyo, Japan)
was positioned on a block (height = 4 cm) at a fixed dis-
tance of 55 cm from the medial border of the right foot
and 10 cm forward of the back of the heel (Figure 2). The
foot to camera distance was selected based on pilot test-
ing to ensure that the largest expected foot size could be
photographed (men's size 13.5 UK). A calibration photo
was first taken where an object with known distances (10
cm) was positioned in the plane of the medial arch (55 cm
from the camera). The centre of the calibration object
was horizontally located approximately perpendicular to
the line of view of the camera lens. The calibration object
was removed and photos were then taken of the medial
aspect of the foot during both sitting (10% WB) and
relaxed standing (50% and 90% WB).
All digital photos were then downloaded onto a PC
where they were processed using ImageJ software (NIH,
Bethesda, USA). Briefly, this software allowed the digitiz-
ing of selected co-ordinates to calculate the foot measure-
ments needed to determine AHI (Figure 3). Co-ordinates
were exported from the software as pixels and the cali-
bration photo allowed the conversion of pixels to cm. To
assist with the digitizing of the foot photos lines were
drawn on the image indicating the distal end of the hal-
lux, the most posterior aspect of the posterior heel, and
the horizontal supporting surface (Figure 3). The FL was
obtained by digitizing points at the distal end of the hal-
lux and posterior aspect of the heel. The total foot length
was then halved to determine 50% of the total foot length.
An additional vertical line was then drawn perpendicular
from the supporting surface to the dorsum of the foot at
50% of the foot length. The DH was determined by digi-
tizing co-ordinates at the top and bottom of this line.
Finally, a co-ordinate on the first metatarsal head was dig-
itized to enable the calculation of TFL. No enhancements
or modifications were made to any of the digital images.
Data analysis
To compare the intra-tester reliability of both the AHIMS
and photo methods, intraclass correlation coefficients
(ICC 3,1) were calculated for the between-day measure-
ments of both techniques [11]. In addition to ICC values,
the between-day standard error of measurement (SEM)
was also calculated for each method [12]. Both ICC and
SEM were calculated for the variables AHI, TFL and DH.
All ICC and SEM reliability variables were assessed dur-
ing both sitting and standing. Additionally, the relation-
ship between AHI as measured by the AHIMS and photo
methods was examined. A Spearman's rank order corre-
lation was performed between AHI (AHIMS) and AHI
(digital photo) during standing (50% WB).
Results
Descriptive statistical values for TFL, DH and AHI for
both the AHIMS and photo methods are presented in
Figure 2 Setup for the digital photographic method. The blocks
(A) were placed under the heel and ball of the right foot with the me-
dial border lined up with the near edge. The left foot was placed on the
scale (B). The camera was placed on another block (C) a fixed distance
from the posterior aspect of the heel (10 cm) and medial aspect of the
foot (55 cm). A set square (D) was placed in plane with the medial bor-
der of the right foot for one of the digital photos to serve as a calibra-
tion object.
4.5cm
10cm
55cm
4 cm
4.5cm
15cm
A
A
B
C
D
Figure 3 Digital photographic image used to calculate FL, TFL
and AH. Lines were drawn on the image indicating the distal end of
the hallux, the most posterior aspect of the posterior heel, and the hor-
izontal supporting surface. The co-ordinates A-E were digitized and
used to calculate the foot measurements. The horizontal distance be-
tween A and B gave FL. Point C was placed at the horizontal midpoint
between A and B. The vertical distance between C and D represents
AH. The horizontal distance between B and E yielded the TFL.
Pohl and Farr Journal of Foot and Ankle Research 2010, 3:14
/>Page 4 of 6
Table 1. For both measurement techniques, the AHI low-
ered from sitting to standing. However, there was little
difference between the 50% WB and 90% WB standing
conditions, with only a 0.004 change in AHI measured.
Therefore, reliability data were only presented for the sit-
ting and 50% WB standing conditions.
The intra-tester reliability values for foot arch measure-
ments using both methods are shown in Table 2. The
mean absolute difference for between-day AHI measure-
ments was less than 0.009 and similar for both the
AHIMS and digital photographic techniques. There were
no discernible differences between the two measurement
techniques in terms of either SEM or ICC values, with
both demonstrating excellent reliability. ICCs were in
excess of 0.86 and SEM values for the foot measurements
used to calculate AHI (TFL and DH) were equal to or less
than 0.2 cm.
The results of the Spearman's rank order correlation
suggested there was a strong positive relationship
between AHI measurements collected using AHIMS and
photographic methods (p < 0.00, ρ = 0.90). The individual
subject rankings of AHI (low to high) for each method
(AHIMS v digital photo) are listed in Table 3. The abso-
lute difference between the two ranks was ≤ 2 in 16 out of
20 subjects. In general, the AHI values found using the
digital photos were greater than the values measured
using the AHIMS (Tables 1 and 3).
Discussion
The purpose of this study was to compare the intra-tester
reliability of two different methods of assessing static
arch measurements. The results suggest that arch mea-
surements calculated using a digital photographic
method were of a similar reliability to the same variables
derived using a mechanical callipers device (AHIMS).
Moreover, both methods demonstrated a high level of
reliability when calculating AHI with ICC's exceeding
0.86 and SEM's below 0.009.
The ICC values of TFL, DH and AHI measured using
the AHIMS were in agreement with previous studies that
reported ICC's ranging from 0.91 to 0.99. This provides
further confirmation that arch measurements can be col-
lected with excellent reliability when using mechanical
calliper devices. The mean AHI value collected during
standing using the AHIMS was also similar to the mean
values reported in the literature using a similar device [7-
9]. However, this value was considerably greater than the
mean value of 0.292 reported by Williams and McClay
[6]. Butler and colleagues [8] postulated that their mean
value of 0.340 was greater than that of Williams and
McClay [6] due to the two respective studies collecting
standing AHI using different amounts of body weight
applied to the measured foot (50% WB versus 90% WB
Table 1: Mean and standard deviation (SD) values of
truncated foot length (TFL), dorsum height (DH) and arch
height index (AHI) for both the AHIMS and digital
photographic techniques.
AHIMS Digital Photo
Mean SD Mean SD
Sitting (10% WB)
TFL (cm) 18.1 0.8 17.4 0.8
DH (cm) 6.8 0.5 6.7 0.5
AHI 0.375 0.020 0.384 0.023
Standing (50% WB)
TFL 18.4 0.8 17.7 0.8
DH 6.3 0.6 6.4 0.6
AHI 0.345 0.025 0.361 0.025
Standing (90% WB)
TFL 18.4 0.8 17.8 0.8
DH 6.3 0.5 6.4 0.6
AHI 0.342 0.024 0.357 0.028
Table 2: Between-day mean absolute differences, standard error of measurement (SEM) and intraclass correlation
coefficients (ICC) for both measurement techniques.
AHIMS Digital Photo
Mean difference SEM ICC Mean difference SEM ICC
Sitting (10% WB)
TFL 0.2 0.2 0.94 0.3 0.2 0.91
DH 0.1 0.1 0.94 0.1 0.1 0.93
AHI 0.009 0.009 0.87 0.008 0.008 0.88
Standing (50% WB)
TFL 0.3 0.2 0.93 0.3 0.2 0.92
DH 0.2 0.2 0.94 0.1 0.1 0.95
AHI 0.008 0.007 0.92 0.007 0.006 0.94
Pohl and Farr Journal of Foot and Ankle Research 2010, 3:14
/>Page 5 of 6
respectively). However, the present investigation found
no differences between AHI when measured during 50%
WB or 90% WB, thus indicating that the two loading con-
ditions produce a similar measurement outcome.
Although values for AHI have not been reported for the
digital photographic method before, the good reliability
values for dorsum height are in agreement with McPoil
and colleagues [5]. However, given that McPoil et al. [5]
did not reposition the participant when assessing reliabil-
ity, we were curious to explore this further. Indeed, the
high reliability of the foot measurements in the present
study confirms that the effect of participant positioning
between testing sessions was minimal. Moreover, the ICC
and SEM values for all foot variables were equivalent to
those measured using the AHIMS. This implies that
within the context of a single laboratory, a digital photo-
graphic method may be used to measure AHI reliably in
the absence of mechanical callipers. This is beneficial
given that custom built calliper devices can be expensive
to construct compared to the cost of a digital camera.
There was a strong correlation between AHI measure-
ments taken using AHIMS and digital photographic
methods. Thus, individuals with high and low arches are
likely to be identified correctly using either measurement
technique. It is perhaps not surprising that both methods
were highly correlated since they have both been shown
to be highly correlated with equivalent radiographic mea-
surements [5,6]. However, it was noted that mean AHI
values measured using digital photos were of a greater
magnitude than those recorded using the AHIMS. From
the results in Table 1, it would appear that this systematic
offset was the result of a shorter TFL being measured in
the digital photo method since DH was similar between
the two techniques. It is possible that this was the result
of the TFL distance (17-20 cm) exceeding the dimensions
of the calibration object (10 cm) which might introduce
some calibration error. The improvement of calibration
procedures such as calibrating over a greater horizontal
distance or even using multiple calibration objects, has
the potential to increase the validity of TFL measure-
Table 3: Individual subject rankings based on AHI during 50% WB.
Subject AHIMS Digital Photo Rank Difference
AHI Value Rank AHI Value Rank
D0.3091 0.353 1 0
J0.3092 0.363 4 -2
P0.3103 0.380 5 -2
O0.3184 0.320 2 2
S0.3225 0.401 3 2
L0.3286 0.359 7 -1
B0.3307 0.384 8 -1
H0.3378 0.335 6 2
A0.3399 0.379 11 -2
C0.34010 0.333 15 -5
F0.34411 0.397 10 1
N0.34712 0.349 9 3
I0.35413 0.389 14 -1
R0.36114 0.356 12 2
E0.36515 0.323 20 -5
T0.37116 0.335 16 0
K0.37217 0.378 19 -2
Q0.37818 0.372 13 5
G0.37919 0.330 17 2
M0.38220 0.383 18 2
Subjects are listed sequentially from lowest to highest values of AHI as measured using the AHIMS. The numerical rank of each s
ubjects' AHI
is also listed for the digital photographic method alongside the AHIMS rank. The rank difference was calculated the digital photographic rank
subtracted from the AHIMS rank.
Pohl and Farr Journal of Foot and Ankle Research 2010, 3:14
/>Page 6 of 6
ments conducted using a digital cameras. Given that the
digital photographic method was highly correlated with
the AHIMS in terms of AHI, it could be speculated that
establishing a different set of norms for the photographic
method might be a feasible solution. However, a clinical
measurement tool such as AHI is much more useful
when results can be confidently compared between mul-
tiple clinical and research centres. It is presently
unknown how equipment and experimental setup might
influence the foot variables derived from the digital pho-
tos. While good agreement of AHI values between differ-
ent laboratories has been reported using the AHIMS [9],
inter-laboratory comparisons have not been conducted
using digital photographic methods. Studies comparing
the results from different laboratories and clinics are war-
ranted, in addition to investigating the influence of differ-
ent camera placements and calibration procedures.
There were some limitations with the current study.
Firstly, we only collected intra-tester reliability data.
Therefore, it remains to be seen whether the findings can
be generalised between different testers. However, strong
inter-tester reliability has been reported previously for
both the AHIMS [6,8] and digital photographic method
[5]. Secondly, it is worth noting that the subjects used in
the present investigation were lean and asymptomatic
with no notable foot deformities. In cases of pathology,
the presence of swelling and deformity may introduce
potential error in both the reliability and validity of the
measurements taken using both methods. Future work is
needed to determine the feasibility of using the AHI mea-
surement in patients with clinical foot pathologies.
Conclusion
In summary, this study demonstrated that AHI calculated
using a digital photographic method can be determined
reliably. Moreover, this variable can be obtained with
equivalent reliability to a previously established method
using mechanical callipers. However, AHI values mea-
sured using digital photos were of a greater magnitude
than those recorded using callipers. Therefore, future
studies are needed to establish whether the digital photo-
graphic method can be utilised validly for between labo-
ratory/clinic comparisons.
Competing interests
The authors declare that they have no competing interests.
Authors' contributions
MBP developed the rationale for the study. MBP and LF designed the study
protocol. LF conducted the data collections and MBP analysed the data. MBP
and LF drafted the manuscript. All authors have read and approved the final
manuscript.
Acknowledgements
This work was supported in part by the Alberta Heritage Foundation for Medi-
cal Research, SOLE Inc, and the University of Calgary Olympic Oval High Perfor-
mance Fund. The authors gratefully acknowledge the help of Brian Noehren,
Chandra Lloyd and Andrea Bachand for their assistance with the project.
Author Details
1
Faculty of Kinesiology, University of Calgary, AB, Canada and
2
Running Injury
Clinic, University of Calgary, AB, Canada
References
1. Kaufman KR, Brodine SK, Shaffer RA, Johnson CW, Cullison TR: The effect
of foot structure and range of motion on musculoskeletal overuse
injuries. American Journal of Sports Medicine 1999, 27:585-593.
2. Williams DS, McClay IS, Hamill J: Arch structure and injury patterns in
runners. Clinical Biomechanics 2001, 16:341-347.
3. Pohl MB, Rabbito M, Ferber R: The role of tibialis posterior fatigue on
foot kinematics during walking. J Foot Ankle Res 2010, 3:6.
4. Cobb SC, Tis LL, Johnson JT, Wang Y, Geil MD, McCarty FA: The effect of
low-mobile foot posture on multi-segment medial foot model gait
kinematics. Gait & Posture 2009, 30:334-339.
5. McPoil TG, Cornwall MW, Medoff L, Vincenzino B, Forsberg K, Hilz D: Arch
height change during sit-to-stand: an alternative for the navicular drop
test. J Foot Ankle Res 2008, 1:3.
6. Williams DS, McClay IS: Measurements used to characterize the foot and
the medial longitudinal arch: Reliability and validity. Physical Therapy
2000, 80:864-871.
7. Zifchock RA, Davis I, Hillstrom H, Song JS: The effect of gender, age, and
lateral dominance on arch height and arch stiffness. Foot & Ankle
International 2006, 27:367-372.
8. Butler RJ, Hillstrom H, Song J, Richards CJ, Davis IS: Arch height index
measurement system - Establishment of reliability and normative
values. Journal of the American Podiatric Medical Association 2008,
98:102-106.
9. Richards CJ, Card K, Song J, Hillstrom H, Butler R, Davis I: A novel arch
height index measurement system (AHIMS): intra- and inter-rater
reliability. Proceedings of American Society of Biomechanics Annual
Meeting Toledo 2003.
10. McGinley JL, Baker R, Wolfe R, Morris ME: The reliability of three-
dimensional kinematic gait measurements: A systematic review. Gait &
Posture 2009, 29:360-369.
11. Shrout PE, Fleiss JL: Intraclass correlations - uses in assessing rater
reliability. Psychological Bulletin 1979, 86:420-428.
12. Portney LG, Watkins MP: Foundations of Clinical Research: Applications to
Practice Second edition. Upper Saddle River: Prentice-Hall, Inc; 2000.
doi: 10.1186/1757-1146-3-14
Cite this article as: Pohl and Farr, A comparison of foot arch measurement
reliability using both digital photography and calliper methods Journal of
Foot and Ankle Research 2010, 3:14
Received: 4 June 2010 Accepted: 14 July 2010
Published: 14 July 2010
This article is available from: 2010 Pohl and Farr; licensee BioMed Central Ltd. This is an Open Access article distributed under the terms of the Creative Commons Attribution License ( .0), which permits unrestricted use, distribution, and reproduction in any medium, provided the original work is properly cited.Journal of Foot and Ankle Research 2010, 3:14