Báo cáo y học: "Foot kinematics in patients with two patterns of pathological plantar hyperkeratosi" pdf
Bạn đang xem bản rút gọn của tài liệu. Xem và tải ngay bản đầy đủ của tài liệu tại đây (1.21 MB, 12 trang )
RESEARCH Open Access
Foot kinematics in patients with two patterns
of pathological plantar hyperkeratosis
Andrew H Findlow
*
, Christopher J Nester
†
, Peter Bowker
†
Abstract
Background: The Root paradigm of foot function continues to underpin the majority of clinical foot biomechanics
practice and foot orthotic therapy. There are great number of assumptions in this popular paradigm, most of
which have not been thoroughly teste d. One component supposes that patterns of plantar pressure and
associated hyperkeratosis lesions should be associated with distinct rearfoot, mid foot, first metatarsal and hallux
kinematic patterns. Our aim was to investigate the extent to which this was true.
Methods: Twenty-seven subjects with planter pathological hyperkeratosis were recruited into one of two groups.
Group 1 displayed pathological plantar hyperkeratosis only under metatarsal heads 2, 3 and 4 (n = 14). Group 2
displayed pathological plantar hyperkeratosis only under the 1
st
and 5
th
metatarsal heads (n = 13). Foot kinematics
were measured using reflective markers on the leg, heel, midfoot, first metatarsal and hallux.
Results: The kinematic data failed to identify distinct differences between these two groups of subjects, however
there were several subtle (generally <3°) differences in kinematic data between these groups. Group 1 displayed a
less everted heel, a less abducted heel and a more plantarflexed heel compared to group 2, which is contrary to
the Root paradigm.
Conclusions: There was some evidence of small differences between planter pathological hyperkeratosis groups.
Nevertheless, there was too much similarity between the kinematic data displayed in each group to classify them
as distinct foot types as the current clinical paradigm proposes.
Background
Clinical diagnosis and orthotic management of mechani-
cally related foot disorders is founded on a the generally
accepted Root et al [1,2] paradigm of foot function.
This paradigm was developed in response to a clinical
need for a conceptual framework to classify and explain
foot pathologies. Despite a lack of kinematic data s up-
porting such concepts, ‘mobile’ and ‘rigid’ foot types are
central to the paradigm. The belief is that the mobile
foot type is characterised by a more everted heel and a
lower medial arch profile compared to the rigid foot
type. The assumed differences in foot kinematics
between the mobile and rigid foot types are associated
with similarly distinct patterns of load distribution
under the forefoot . For the mobile foot type pressure is
primarily located under the second and third metatarsal
heads. This is said to be a consequence of medial distri-
bution of load under the forefoot due to rearfoot ever-
sion and dorsiflexion of the first metatarsal head relative
to the second. This leaves the second metatarsal head
relatively “exposed” and bearing substantial load, with
progressively less load on the third, fourth and fifth
metatarsals. The dorsiflexion of the first but not the sec-
ond metatarsal is said to be due to its greater mobility
and recent data lends some credibility to this [3,4].
Thus, the mobile foot is thought to be associated with
greatest load on metatarsal head two with progressively
less on three and four.
In contrast, in the rigid foot type the relatively less pro-
nated, or supinated rearfoot position, leads to more load
under the lateral rather than medial forefoot. In further
contrast to the mobile foot type, the mobility of the lat-
eral forefoot in the rigid foot type is reduced (because the
foot is more ‘rigid’) and the fifth metatarsal does not dor-
siflex under the increased lateral loading. It thus bears
* Correspondence:
† Contributed equally
1
Centre for Health, Sport and Rehabilitation Sciences Research, School of
Health, Sport and Rehabilitation Sciences, University of Salford, Salford M6
6PU, England, UK
Findlow et al. Journal of Foot and Ankle Research 2011, 4:7
/>JOURNAL OF FOOT
AND ANKLE RESEARCH
© 2011 Findlow et al; lic ensee BioMed Central Ltd. This is an Open Access article distributed under the terms of the Creative Commons
Attribution License ( which permits unrestricted use, distribution, and reproduction in
any medium, provided the original work is prop erly cited.
substantial loads. The relatively reduced load under the
medial forefoot is thought to provide less resistance to
the windlass mechanism, that plantarflexes the first meta-
tarsal as the hallux dorsiflexes during terminal stance.
The subsequent greater first metatarsal plantarflexion
compared to the mobile foot type increases the height of
the medial arch. The relatively plantarflexed position of
the first metatarsal is believed to result in relative unload-
ing of the second and third metatarsals and leave the first
metatarsal bearing substantial loads. Thus, the rigid foot
type is associated with greatest load under the metatarsal
heads one and five.
One proposed clinical manifestation of the hypothetical
differences in foot kinematics and load distribution
under the forefoot between mobile and rigid foot types, is
the development of distinct patterns of pathological plan-
tar hyperkeratosis (PPH). The thickening of the stratum
corneum in response to repeated high levels of load is
generally acknowledged as associated w ith an increased
plantar pressure [5-8]. Thus, it is supposed that the pat-
tern of PPH distribution under the metatarsal heads will
reflect the pattern of load distribution under the forefoot,
which according to the clinical paradigm, is associated
with distinc t patterns of foot kinematics and the ‘mobile’
and ‘rigid’ foot types. An important consequence of the
formation of PPH is that it is acknowledged clinically to
be a precursor to plantar foot pathologies in high-risk
category patients, for example neuropathic plantar foot
ulceration in people with diabetes.
There are clearly a great number of assumption s in
this popular clini cal paradigm of foot function. Rather
than break the paradigm down into its constituent
assumptions and evaluate each in isolation, in this study
we chose the take a pragmatic approach to evaluating
the foot type concepts within the paradigm. According
to the paradigm, patterns of foot pressure and PPH
lesions should be associated with distinct rearfoot, mid
foot, first metatarsal and hallux kinematic patterns. Our
aim was to investigate the extent to which this was true.
Methods
Following ethical approval (University of Salford E thics
committee) 27 subjects (table 1) who attended the Uni-
versityPodiatryclinicevery4-8weeksfordebridement
of plantar callus were recruited and gave informed con-
sent. The inclusion c riterion was one of two types of
forefoot PPH pattern. Group 1 displayed PPH only
under metatarsal heads 2, 3 and 4. Group 2 displayed
PPH only under the 1
st
and 5
th
metatarsal heads
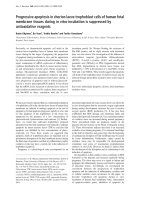
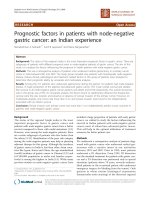
(n = 13). PPH (callus) was a distinct area of thickened
and hardened upper layer of the skin having distinct
boundaries with normal skin, and a regular oval outline
(Figure 1). Whilst no measure of foot posture or type
was used, anecdotally, subjects in Group 1 had a physi-
cal appearance of pes planus (low medial arch profile)
and those in Group 2 displayed pes cavus (high medial
arch profile) . These were consistent with the Root para-
digm. None of the subjects displayed heloma durum. All
subjects showed the same PPH pattern on both feet,
except for three subjects who displayed the pattern
under the left forefoot only.Thus,totalsamplewas24
limbs from group 1 (11 right, 13 left), 27 limbs from
group 2 (13 right, 14 left). All subjects had negative his-
tory of lower limb injury or systemic disease (e.g. dia-
betes, rheumatoid arthritis).
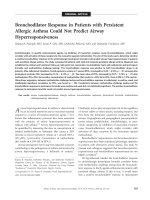
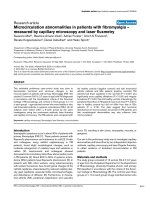
Foot kinematics were measured using reflective mar-
kers on the leg, heel, midfoot, first metatarsal and hallux
[9-13] (figure 2) and 100 Hz infrared c ameras [14]. The
performance of the six-camera Qualisys ProReflex sys-
tem was tested prior subject data collection to optimise
the position of the cameras f or the 6 mm markers used
in the study. The accuracy and precision (RMS error o f
0.33 mm, SD 0.31 mm) of the Qualisys ProReflex system
using this c onfiguration are better than some previous
results (e.g. Ehara et al [15] RMS between 0.9 mm and
6.3 mm, SD 0.8 mm to 6.0 mm). Each subject was
allowed a reasonable period of time to become familiar
to the gait lab environment and the marker clusters
before ten gait trials at a self-selected pace were
Table 1 subject descriptive statistics
n Mean Std. Dev Std. Error 95% Confidence Interval for Mean Min Max Significant difference
Lower Bound Upper Bound
AGE PPH 234 14 46.48 15.92 4.25 37.29 55.67 22.73 76.97 0.352
PPH 1 and 5 13 52.44 16.69 4.63 42.35 62.52 27.18 75.21
Total 27 49.35 16.29 3.13 42.92 55.78 22.73 76.97
WEIGHT PPH 234 14 82.86 13.63 3.64 74.99 90.73 52.40 109.8 0.120
PPH 1 and 5 13 74.31 13.92 3.86 65.90 82.72 46.00 96.40
Total 27 78.74 14.19 2.73 73.13 84.35 46.00 109.8
HEIGHT PPH 234 14 1.70 0.10 0.03 1.64 1.75 1.58 1.87 0.034
PPH 1 and 5 13 1.62 0.07 0.02 1.58 1.66 1.52 1.71
Total 27 1.66 0.09 0.02 1.63 1.70 1.52 1.87
Findlow et al. Journal of Foot and Ankle Research 2011, 4:7
/>Page 2 of 12
recorded (walking speed was not measured). Local co-
ordinate frames (LCF) were defined for each segment.
For the tibia anatomical markers on both malleoli, fibula
head and ti bial tuberosity were used to align the LCF
relativ e to the technical markers on the mid shin [9-11].
For the heel and midfoot the LCF was set parallel to the
global system when in relaxed standing. For the first
metatarsal and hallux, reflective markers were positioned
on the plates to enable the anterior/posterior (x) axis to
follow the approximate long axis o f the me tatarsal and
hallux respectively. The medial/lateral axes were 90° to
the x-axis and parallel to the supporting surface. Rota-
tions between distal and proximal adjacent segments
were calculated using Euler rotation sequence z x y.
Data were normalised to 0-100% of stance and averaged
across ten trials. The reference position (0 degrees) was
the foot position when the subject stood upright (figure 2).
Other studies have used a subtalar “neutral” position
[16-18], which lacks validity(hasnoprovenfunctional
meaning) and has been shown to be more subjective
[19-23].
The parameters used to characterise foot kinematics
in the two groups were directly related to the clinical
paradigm and enabled a comprehensive exploration of
foot kinematics. These were: the angular position of
each joint in each plane at each of 7 gait events: Heel
Contact (HC), Foot Flat (FF), Ankle Neutral (AN), Heel
Off (HO), Maximu m Ankle Dorsiflexion (MAD), M axi-
mum Toe Dorsiflexion (MTD), and Toe Off (TO). In
addition, the range of motion (ROM)ateachjointand
in each plane of motion was derived durin g HC to FF,
FFtoAN,ANtoHO,HOtoMADandHOtoTO.
Finally, the timing of FF, AN, HO, MAD and MTD
were derived (% of stance).
Ankle neutral was defined as the time at which the
sagittal plane leg/heel data was 0°. Foot marker veloci ty
and displacement data were used to detect HC, FF, HO
and TO [24-27]. The vertical velocity of the origin and
x and y-displacement of the heel LCF was used to detect
HC and HO respectively. Y-displacement of the origin
of the forefoot LCF was used to detect FF. x-axis displa-
cement of the origin of the hallux LCF was used to
detect TO. Differences (error in seconds) between force
plate and foot kinematic data definitions of these events
were tested in a pilot study on 11 subjects and are
detailed in table 2. The mean errors are no greater than
0.024 seconds, or <3% of stance.
Differences between groups were tested using
ANOVA. However, the data could be additionally classi-
fied using side (i.e. differences between left and right
limb), to determine if any variances in these data were
due to interaction or covariance of these factors;
ANOVA was computed with ‘Two-Factor Interactions’
i.e. ‘PPH group’ and ‘side’.
Results
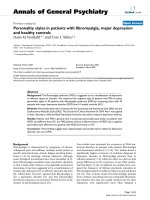
The mean kinematic data during stan ce for each group
are illustrated in figures 3, 4, 5 and 6. There were no
statistically significant differences in the PPH groups
based on the side i.e. between left and right limbs. How-
ever, there were statistically significant differences
between group 1 and 2 in terms of the relative position
and ROM at the joint studied (tables 3 and 4). Group 1
displayed greater heel inversion at heel c ontact (-5.4°
compared to -3.1°), greater heel plantarflexion at foot
flat (-9.2° compared to 3.3), but less heel dorsiflexion at
)*
Figure 1 Example of callus patterns. A - Example of callus pattern
for group 1 - under metatarsal heads 2, 3 and 4; B - Example of the
callus pattern for group 2 - under metatarsal heads 1 and 5.
Figure 2 Markers located on 5 plates. To define co-ordinate
frames for the leg, heel, mid foot, first metatarsal and hallux.
Markers on the skin of the shank were used to align the tibial LCF
to the shank anatomy.
Findlow et al. Journal of Foot and Ankle Research 2011, 4:7
/>Page 3 of 12
the time of heel off and time of maximum ankle dorsi-
flexion (6.7° compared to 8.9°). Group 1 displayed
greater heel plantarflexion at toe off (-9.0° compared to
-5.1°). In the transverse plane, the heel in the feet of
group 1 was less abducted at the time of ankle neutral
(-1.1° compared to 1.5°), heel off (-0.4° compared to
1.5°) and the time of maximum ankle dorsiflexion (-2.1°
Table 2 Mean (SD) error in detection of foot contact
events (seconds)
Contact event
Heel
contact
Foot flat Heel off Toe off
Mean error
(seconds)
0.007
(0.005)
0.021
(0.020)
0.024
(0.022)
0.016
(0.015)
Figure 3 Motion of heel LCF relative to leg LCF during stance phase of gait.
Findlow et al. Journal of Foot and Ankle Research 2011, 4:7
/>Page 4 of 12
comp ared to -0.1°). The heel was also more adducted at
the time of maxi mum hallux dorsiflexion (-6.1° com-
pared to -3.8°).
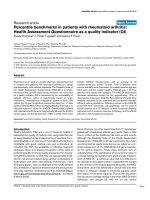
For the midfoot/heel, the midfoot of group 1 was
more plantarflexed at heel contact (-9.3° compared to
-6.2°), foot flat (-5.7° compared to -2.9°), at the time of
maximum hallux dorsiflexion (-10.8° compared to 2.9)
and toe off (-15.3° compared to -11.1°). The mid foot
was also more inverted relative to the heel at foot flat
(-3.4° compared to -1.6°). For the first metatarsal/mid
Figure 4 Motion of midfoot LCF relative to heel LCF during stance phase of gait.
Findlow et al. Journal of Foot and Ankle Research 2011, 4:7
/>Page 5 of 12
foot, in group 1 the first metatarsal was more dorsi-
flexed at toe off compared to group 2 (3.5° compared to
1.5°). There were no statistically significant differences
in the position of the first metatarsal phalangeal joint
between groups 1 and 2.
Statisticall y significant differences between group 1 and
2 in terms of the range of motion in the 5 phases of
stance are detailed in table 4. Group 1 displayed more
heel eversion motion between heel contact and foot flat
(1.1° more) and between ankle neutral and heel off
Figure 5 Motion of 1st metatarsal LCF relative to midfoot LCF during stance phase of gait.
Findlow et al. Journal of Foot and Ankle Research 2011, 4:7
/>Page 6 of 12
(1.2° more). They displayed more dorsiflexion between
foot flat and ankle neutral (2.3° more), but less dorsiflex-
ion between ankle neutral and heel off (2.3° less). Group
1 displayed more heel plantarflexion betw een maximum
hallux dorsiflexion and toe off (1.7° more).
For the midfoot/heel, group 1 displayed a greater
range of inversion between heel contact and foot flat
(1.7° more), more dorsiflexion between foot flat and
ankle neutral (2.5° more) and more plantarflexion
between maximum hallux dorsiflexion and to e off (1.4°
Figure 6 Motion of hallux LCF relative to 1st metatarsal LCF during stance phase of gait.
Findlow et al. Journal of Foot and Ankle Research 2011, 4:7
/>Page 7 of 12
Table 3 Significant differences between the PPH groups in angular displacement for the ankle/subtalar joint complex
and midtarsal joint p ≥ 0.05
Joint/Complex Gait event Cardinal Body Plane Group 1 (PPH 2, 3 and 4) Group 2 (PPH 1 and 5)
mean St. Dev 95% CI (upper/lower) mean St. Dev 95% CI (upper/lower)
Leg/Heel HC frontal -5.4° 2.7° -10.7°/-0.17° -3.1° 2.9° -8.8°/2.6°
FF sagittal -9.2° 2.4° -13.9°/-4.5° 3.3° 3.3° -3.2°/9.8°
AN frontal 0.9° 1.7° -2.4°/4.2° 2.4° 2.3° -2.1°/6.9°
transverse -1.1° 2.6° -6.2°/4.0° 1.5° 3.2° -4.8°/7.8°
HO transverse -0.4° 2.3° -4.9°/4.1° 1.5° 3.5° -5.4°/8.4°
sagittal 6.7° 2.5° 1.8°/11.6° 8.9° 3.3° 2.4°/15.4°
MAD transverse -2.1° 3.1° -8.2°/4.0° 0.1° 3.7° -7.2°/7.4°
sagittal 9.3° 2.9° 3.6°/15.0° 11.5° 3.3° 5.0°/18.0°
MTD transverse -6.1° 3.7° -13.4°/1.2° -3.8° 3.9° -11.4°/3.8°
TO sagittal -9.0° 4.4° -17.6°/-0.4° -5.1° 5.2° -15.3°/5.1°
Mid foot/Heel HC sagittal -9.3° 3.1° -15.4°/-3.2° -6.2° 2.4° -10.9°/-1.5°
FF frontal -3.4° 2.5° -9.0°/0.8° -1.6° 3.0° -8.3°/3.5°
sagittal -5.7° 2.4° -10.4°/-1.0° -2.9° 3.2° -9.2°/3.4°
MTD sagittal -10.8° 5.0° -20.6°/-1.0° 2.9° 2.9° -2.8°/8.6°
TO sagittal -15.3° 4.9° -24.9°/-5.7° -11.1 3.2° -3.1°/9.5°
First metatarsal/Mid foot HC transverse 4.2° 4.2° -4.0°/12.4° 1.6° 3.0° -4.3°/7.5°
sagittal 0.9° 3.9° -6.7°/8.5° -0.9° 3.6° -8.0°/6.2°
TO sagittal 3.5° 3.3° -3.0°/10.0° 1.5° 3.4° -5.2°/8.2°
Positive results represent everted (frontal plane), abducted (transverse plane) and dorsiflexed positions.
Table 4 Significant differences between the PPH groups in ROM for the ankle/subtalar joint complex and midtarsal
joint (p ≥ 0.05)
Joint/Complex Gait event Cardinal Body Plane Group 1 (PPH 2, 3 and 4) Group 2 (PPH 1 and 5)
mean St. Dev 95% CI (upper/lower) mean St. Dev 95% CI (upper/lower)
Leg/heel HC to FF frontal 5.1° 2.2° 0.8°/9.4° 4.0° 1.5° 1.1°/6.9°
FF to AN sagittal 9.1° 2.5° 4.2°/14° 6.8° 3.4° 0.1°/13.5°
AN to HO frontal 1.1° 1.8° -2.4°/4.6° -0.1° 1.6° -3.2°/3.0°
sagittal 6.8° 2.5° 1.9°/11.7° 9.1° 3.4° 2.4°/15.8°
MTD to TO sagittal -6.6° 2.0° -10.5°/-2.6° -4.9° 2.1° -9.0°/-0.8°
mid foot/heel HC to FF frontal -4.1° 1.7° -7.4°/-0.8° -2.4° 1.6° -5.5°/0.7°
FF to AN transverse 0.1° 1.4° -2.6°/2.8° 0.9° 1.6° -2.2°/4.0°
sagittal 5.9° 2.6° 0.8°/11.0° 3.4° 2.4° -1.3°/8.1°
AN to HO transverse 1.0° 1.3° -1.6°/3.6° 0.2° 1.4° -2.5°/2.9°
HO to MAD frontal 0.2° 0.8° -1.4°/1.8° -0.9° 1.0° -2.9°/1.1°
MTD to TO transverse -0.2° 1.2° -2.6°/2.2° 0.5° 1.3° -2.1°/3.1°
sagittal -4.5° 1.9° -8.2°/-0.8° -3.1° 1.9° -6.8°/0.6°
First metatarsal/mid foot FF to AN frontal -4.0° 3.1° -10.1°/2.1° -2.0° 2.5° -6.9°/2.9°
transverse -4.4° 4.4° -13.0°/4.2° -2.4° 2.1° -6.5°/1.7°
sagittal -3.8° 3.3° -10.3°/2.7° -2.2° 1.5° -5.1°/0.7°
MTD to TO transverse 1.6° 1.3° -1.0°/4.2° 1.0° 0.9° -0.8°/2.8°
sagittal 4.0° 1.9° 0.3°/7.7° 2.0° 2.0° -1.9°/5.9°
1st MPJ MTD to TO frontal -0.6° 2.5° -5.5°/4.3° -2.0° 2.4° -6.7°/2.7°
Positive results represent eversion (frontal plane), abduction (transverse plane) and dorsiflexion movements.
Findlow et al. Journal of Foot and Ankle Research 2011, 4:7
/>Page 8 of 12
more). For the first metatarsal/mid foot, group 1 dis-
played a greater range of inversion (2.0° more), adduc-
tion (2.0° more) and plantarflexion (1.6° more) between
foot flat and ankle neutral. The only statistical difference
at the first metatarsal phalangeal joint was less inversion
of the hallux in group 1 between maximum hallux dor-
siflexion and toe off (1.4° less). All the statistically signif-
icant differences in the ROM data (table 4) correspond
to the statistically significant differences in angular
values at the seven specific gait events (table 3). In addi-
tion, the ROM data can also be affected by the time at
which the gait events occurred.
The timing of ankle neutral was significantly later in
group 1 (36.4% vs. 31.1%, p = 0.02), and maximum
ankle dorsiflexion occurred earlier (76.3% vs. 79.4%, p =
0.01) (Table 5). The total time between ankle neutral
and maximum ankle dorsiflexion was therefore 8.4% o f
stance less in group1.
Discussion
Overall the patterns and direction of movement in b oth
groups of subjects were very similar (figures 3, 4, 5 and 6).
The 95% CI (table 3 and 4) indicate that the kinematic
data from feet in one group were often common to that of
the other group. In the clinical paradigm of foot function
the mob ile and rigid foot types and their associated P PH
patterns are supposed to exhibit quite distinct foot kine-
matic data. The lack of gross and consistent differences in
kinematic data between the feet in each group is contrary
to the current clinical paradigm of foot function. From
this we conclude that classification of foot type (mobile,
rigid) using the pattern of forefoot PPH lesions and
making assumptions regarding foot kinematics based on
this classification is unreliable.
Whilst the kinematic data failed to identify distinct
differences between these two groups of subjects, there
were several subtle (generally <3°) differences in kine-
matic data between the two groups. This was in both
the position of the foot segments (table 3), which is sen-
sitive to differences between groups in the position of
the foot when in relaxed standing (used to set the
0 degrees position), and the data describing the range of
motion between segments (table 4), which is sensitive to
the timing of gait events used to define the range of
motion data. According to the paradigm group 1 (asso-
ciated with the mobile foot type) should display a more
pronated foot, greater heel eversion, a lower medial
arch, and greater first metatarsal dorsiflexion, with sub-
sequently less hallux dorsiflexion. In fact group 1 (figure
3) displayed a less everted heel, a less externally rotated
abducted heel and a more plantarflexed heel compared
to group 2, which is contrary to the paradigm. For the
mid foot/heel segment (figure 4) the foot is less dorsi-
flexed throughout stance, which might be associated
with a higher medial arch compared to group 2, again
contrary to the paradigm. The first metatarsal sagittal
plane motion relative to the mid foot segment (figure 5),
and the more dorsiflexed position of hallux between HO
and MTD (figure 6) are also all contrary to the clinical
paradigm. However, it should be reme mbered that these
data only describe the position of the foot in each group
relative to the position of the feet during normal stand-
ing (which was used to define the 0° position). This is
not the same as stating that the foot bones and joints
are actually more pronated, everted and so on, since the
position of the bones under the skin is not known and
the position of the bones in relaxed standing is not
known. What these data describe, therefore, are differ-
ences between the two groups in the relationship
between the movement of the foot joints in stance and
the position the same joints adopt when stood relaxed.
The range of motion data (table 4) indicates that
group 1, which the paradigm associates with a more
mobile foot type, did display great er motion during
stance. Of the statistically significant differences between
the two groups (table 4), 72% indicated greater move-
ment in the group 1 compared to group 2 (13 of 18 dif-
ferences). However, differences were generally small in
absolute terms, all were < = 2.5°. The clinical impor-
tance of such small differences is unknown and the 95%
CI indicates considerable commonality in the kinematics
of individual feet in each group. Thus, whilst there is
evidence for greater mobility within group 1, as the clin-
ical paradigm suggests, the nature and extent of the
Table 5 Mean and standard deviation of the stance phase timing events for each of the PPH groups, and the ANOVA
showing significant differences between the PPH groups (p ≥ 0.05*)
Timing event Group 1 (PPH 2, 3 and 4) Group 2 (PPH 1 and 5) ANOVA
Mean SD Mean SD p value Side p value PPH group Covariance
FF 8.8 1.7 8.0 1.8 0.977 0.127 0.679
AN* 36.4 7.8 31.1 7.8 0.712 0.023 0.597
HO 63.3 5.7 66.6 6.3 0.703 0.064 0.718
MAD* 76.3 4.8 79.4 3.9 0.638 0.014 0.664
MTD 95.8 1.0 96.2 1.3 0.065 0.169 0.852
Findlow et al. Journal of Foot and Ankle Research 2011, 4:7
/>Page 9 of 12
greater mobility is not sufficient to warrant classification
of the feet we studied as consistently or distinctly more
‘mobile’.
A critical part of the mobile foot type (group 1) para-
digm is the assumed greater dorsiflexion of the first
metatarsal in response to load under the medial forefoot
and a resultant reduced hallux dorsiflexion in late
stance . In both groups, the first metatarsal underwent a
small amount of plantarflexion motion after forefoot
loading, with the metatarsal of group 1 plantarflexing
more than t hat of group 2 (figur e 5). After the time of
maximum ankle dorsiflexion the first metatarsal in
group 1 displayed more plantarflexion motion than in
group 2 (figure 5), which is contrary to the clinical para-
digm. Furthermore, the first metatarsal phalangeal joint
in group 1 shows a position of greater dorsiflexion dur-
ing propulsion, which also conflicts with the clinical
paradigm.Again,itshouldberememberedthatthis
relates only to its position relative to its position during
standing which was used to set 0°. Another theory of
foot motion [28,29] suggests that the foot with greater
hallux dorsiflexion during stance would be associated
with a less pronated rearfoot, and this was the case for
group 1 compared to group 2. However, in all these
cases the actual differences in motion are small (figure 3)
and none were statistically significant.
Root’ s paradigm proposes that the subtalar joint
passes through its neutral position in the middle of
stance (~50%) and at the same time as the tibia is verti-
cal above the foot (in the sagittal plane), which broadly
equates to AN in this study. Whilst we did not me asure
the rearfoot to leg angle w hen the STJ was in neutral,
all prior report s state that the position of the heel when
stood relaxed is everted relative to when the STJ is in
its neutral position [2]. Since neither group was in an
inverted rearfoot position at 50% of stance (i.e. more
inverted than when stood relaxed), it is seems inconcei-
vable that the subtalar joint was in its neutral position
in the middle of mid stance, or when AN occurred.
Furthermore, AN did not consistently occur at the mid-
dle of stance nor coincide with an inverted rearfoot
posit ion. Within the data presented in this study the leg
and foot never simultaneously assume Roots ‘ neutral
stance position’ at any point in the stance phase of gait.
It therefore seems unlikely that examination of the foot
based on placing the STJ in neutral when a patient is
stood upright (as proposed by Root) offers a valid repr e-
sentation of dynamic function. This adds furth er to the
existing evidence that static evaluation of the foot does
not reflect dynamic foot function [22,30-33].
Root’s paradigm sugg ests that transverse plane rota-
tion of the lower leg drives supination of the subtalar
joint from the middle of midstance to just after heel off,
creating a so-called ‘ rigid lever’ for efficient propulsion.
The results of this study clearly show that from AN to
TO the rearfoot, forefoot, first ray and hallux are not
rigid and that these foot segments are moving relative
to each other. The flaw in the prior assumption by Root
was that the ankle was the sole provider of the required
plantarflexion. If it was, it might well require a rigid foot
to effectively apply load to the ground for propulsion.
These kinematic data demonstrate that many articula-
tions in the foot contribute to the plantarflexion
required to move the body forwards.
Group 2 displayed a more everted and abducted heel
relative to the leg, and more dorsiflexed mid foot to
heel position (table 3, figure 4). Thus foot pronation was
associated with earlier ankle neutral (heel to leg = 0°)
and a later time to peak heel/leg dorsiflexion. Though
not statistically significant, this was also associated with
less hallux dorsiflexion (figure 3 ). These results concur
to some degree with those of a p revious pilot study [34]
which reported that loss of hallux dorsiflexion (induced
using a rigid insole) was associated with later peak in
heel/leg dorsiflexion (a prolonging of ankle dorsiflexion).
Since the CI for both groups is high these differences
are not definitive of each group.
There are several reasons why the foot kinematics we
measured and the foot kinematics described in the clini-
cal paradigm might not be strongly associated with the
pattern of PPH. Callus develops under the metatarsal
heads in response to load, and thus motion of individual
metatarsals, and the motion of other bones within the
foot will influence the extent to which the kinematics we
measured are associated with forefoot plantar loading.
For example, for heel/leg kinematics to be strongly asso-
ciated with, or even predictive of, forefoot loading pat-
terns, all other structures between the rearfoot and
metatarsal heads would need to be rigid, or have predict-
able mechanical characteristics. There is good evidence
that mid foot and metatarsal bones are capable of consid-
erable motion and that this varies between subjects
[35-37]. Other mechanisms will also influence the extent
to which bone kinematics are associated with forefoot
loading and PPH patterns. Hamel et al [38] described
how toe flexion assisted by muscle action and plantar fas-
cia forces influences load distribution between the toes
and forefoot. Sharkey et al [39] had earlier shown how
plantar fascia relea se altered foref oot load distribution. It
follows that for two feet with the same foot kinematics,
differences in the influence of the toe flexors, plantar fas-
cia and other plantar soft tissues could result in different
forefoot loading patterns . A further issue is that we used
the presence of PPH to indicate forefoot pressure because
this was an integral part of the clinical paradigm we
sought to pragmatically investigate. However, the thresh-
old at which PPH form ation is triggered might vary
between different people. Thus, the presence of PPH
Findlow et al. Journal of Foot and Ankle Research 2011, 4:7
/>Page 10 of 12
might reflect a low threshold to skin loading rather than
a specific foot kinematic pattern that results in specific
forefoot loading characteristics.
Conclusions
There was some ev idence of small diffe rences in foot
kinematics between subjects with PPH under metatarsal
heads 1 and 5, and subjects with PPH under metatarsal
heads 2 and 3. Though small the differences are large as
a percentage of the motion occurring. There was a clear
difference in the time of ankle neutral (AN) and maxi-
mum ankle dorsiflexion (MAD) between groups. The
significance of these differences is unknown and there
was too much similarity between the kinematic data dis-
played in each group to classify them as distinct foot
types as the current clinical paradigm proposes. PPH
lesion distribution is a poor basis for classification of
foot kinematics.
Authors’ contributions
AHF conceived, designed and carried out the kinematic studies; performed
the statistical analysis and drafted the manuscript.
CJN helped in the design of the kinematic studies and to draft the
manuscript.
PB helped in the design of the kinematic studies.
All authors have read and approved the final manuscript.
Competing interests
There are no financial competing interests (political, personal, religious,
ideological, academic, intellectual, commercial or any other) to declare in
relation to this manuscript
Received: 5 August 2010 Accepted: 9 February 2011
Published: 9 February 2011
References
1. Root ML, Weed JH, Sgarlato TE, Bluth DR: Axis of motion of the subtalar
joint. J Am Podiatry Assoc 1966, 56:149-155.
2. Root ML, Orien WP, Weed JH: Normal and Abnormal function of the Foot
Los Angeles: Clinical Biomechanics Corp; 1977.
3. Nester C, Jones R, Liu A, Howard D, Lundberg A, Arndt T, Lundgren P,
Stacoff A, Wolf P: Invasive study of rearfoot, midfoot and forefoot
kinematics during walking. J Biomech 2006, 39:S77-S77.
4. Halstead J, Turner DE, Redmond AC: The relationship between hallux
dorsiflexion and ankle joint complex frontal plane kinematics: A
preliminary study. Clin Biomech 2005, 20:526-531.
5. Sage RA, Webster JK, Fisher SG: Outpatient Care and Morbidity Reduction
in Diabetic Foot Ulcers Associated with Chronic Pressure Callus. JAm
Podiatry Assoc 2001, 91:275-279.
6. Freeman DB: Corns and calluses resulting from mechanical
hyperkeratosis. Am Fam Physician 2002, 65:2277-2280.
7. Menz HB, Zammit GV, Munteanu SE: Plantar pressures are higher under
callused regions of the foot in older people. Clin Exp Dermatol 2007,
32:375-380.
8. Jannink M, van Dijk H, Ijzerman M, Groothuis-Oudshoorn K, Groothoff J,
Lankhurst G: Effectiveness of custom-made orthopaedic shoes in the
reduction of foot pain and pressure in patients with degenerative
disorders of the foot. Foot Ankle Int 2006, 27:974-979.
9. Cappozzo A: Three-dimensional analysis of human walking: Experimental
methods and associated artifacts. Hum Mov Sci 1991, 10:589-602.
10. Cappozzo A, Catani F, Della Croce U, Leardini A: Position and orientation
in space of bones during movement: anatomical frame definition and
determination. Clin Biomech 1995, 10:171-178.
11. Cappozzo A, Catani F, Leardini A, Benedetti MG, Della Croce U: Position
and orientation in space of bones during movement: experimental
artefacts. Clin Biomech 1996, 11:90-100.
12. Cappello A, Cappozzo A, Della Croce U, Leardini A, Allard P, Lundberg A,
Vaughan CL: Bone position and orientation reconstruction using external
markers. Three-dimensional Analysis of Human Locomotion Chichester.: John
Wiley & Sons Ltd; 1997, 147-172.
13. Cappozzo A, Cappello A, Della Croce U, Pensalfini F: Surface-marker cluster
design criteria for 3-D bone movement reconstruction. IEEE Trans Biomed
Eng 1997, 44:1165-1174.
14. Qualisys: ProReflex. Gothenburg, Sweden: Qualisys Medical AB, Adaptive
Optics Associates Inc;, 2.57 2000.
15. Ehara Y, Fujimoto H, Miyazaki S, Tanaka S, Yamamoto S: Comparison of the
performance of 3D camera systems. Gait Posture 1995,
3:166-169.
16.
Bailey DS, Perillo JT, Forman M: Subtalar joint neutral. A study using
tomography. J Am Podiatr Med Assoc 1984, 74:59-64.
17. Cook A, Gorman I, Morris J: Evaluation of the neutral position of the
subtalar joint. J Am Podiatr Med Assoc 1988, 78:449-451.
18. Picciano AM, Rowlands MS, Worrell T: Reliability of open and closed
kinetic chain subtalar joint neutral positions and navicular drop test. J
Orthop Sports Phys Ther 1993, 18:553-558.
19. Elveru RA, Rothstein JM, Lamb RL: Goniometric reliability in a clinical setting.
Subtalar and ankle joint measurements. Phys Ther 1988, 68:672-677.
20. Elveru RA, Rothstein JM, Lamb RL, Riddle DL: Methods for taking subtalar
joint measurements. A clinical report. Phys Ther 1988, 68:678-682.
21. Freeman AC: A study of inter-observer and intra-observer reliability in
the measurement of resting calcaneal stance position, and neutral
calcaneal stance position. Bri J Pod Med Surg 1990, 2:6-8.
22. Menz HB: Clinical hindfoot measurement: a critical review of the
literature. The Foot 1995, 5:57-64.
23. Menz HB, Keenan AM: Reliability of two instruments in the measurement
of closed chain subtalar joint positions. The Foot 1997, 7:194-201.
24. Mickelborough J, van der Linden ML, Richards J, Ennos AR: Validity and
reliability of a kinematic protocol for determining foot contact events.
Gait Posture 2000, 11:32-37.
25. Findlow AH, Nester CJ, Bowker P, Armstrong DG: Kinematic data can be
used to identify the time of heel contact, foot flat, heel off and toe off.
2003/04/03/. The Midwest Podiatry Conference 2003.
26. Findlow AH, Nester CJ, Bowker P: Repeatability of kinematic data for five
segment foot/ankle model, and validation of its use in the definition of
key gait events. 2003/07/06/. International Society of Biomechanics XIXth
Congress 2003.
27. Findlow AH, Nester CJ, Bowker P: Deriving gait temporal events from foot
kinematic data. 2003/09/01/. Biomechanics of the Lower Limb in Health,
Disease and Rehabilitation 2003.
28. Dananberg HJ: Gait style as an etiology to chronic postural pain. Part I.
Functional hallux limitus. J Am Podiatr Med Assoc 1993, 83:433-441.
29. van Gheluwe B, Dananberg HJ, Hagman F, Vanstaen K: Effects of hallux
limitus on plantar foot pressure and foot kinematics during walking. J
Am Podiatr Med Assoc 2006, 96:428-436.
30. McPoil TG, Cornwall MW: Relationship between neutral subtalar joint
position and pattern of rearfoot motion during walking. Foot Ankle Int
1994, 15:141-145.
31.
Pierrynowski MR, Smith SB: Rear foot inversion/eversion during gait
relative to the subtalar joint neutral position. Foot Ankle Int 1996,
17:406-412.
32. McPoil TG, Cornwall MW: The relationship between static lower extremity
measurements and rearfoot motion during walking. J Orthop Sports Phys
Ther 1996, 24:309-314.
33. McPoil TG, Cornwall MW: Relationship between three static angles of the
rearfoot and the pattern of rearfoot motion during walking. J Orthop
Sports Phys Ther 1996, 23:370-375.
34. Hall C, Nester CJ: Sagittal Plane Compensations for Artificially Induced
Limitation of the First Metatarsophalangeal Joint: A Preliminary Study. J
Am Podiatr Med Assoc 2004, 94:269-274.
35. Nester C, Jones RK, Liu A, Howard D, Lundberg A, Arndt A, Lundgren P,
Stacoff A, Wolf P: Foot kinematics during walking measured using bone
and surface mounted markers. J Biomech 2007, 40:3412-3423.
36. Arndt A, Wolf P, Nester C, Liu A, Jones R, Howard D, Stacoff A, Lundgren P,
Lundberg A: Intrinsic foot motion measured in vivo during barefoot
running. J Biomech 2006, 39:S182-S182.
Findlow et al. Journal of Foot and Ankle Research 2011, 4:7
/>Page 11 of 12
37. Arndt A, Wolf P, Liu A, Nester C, Stacoff A, Jones R, Lundgren P,
Lundberg A: Intrinsic foot kinematics measured in vivo during the stance
phase of slow running. J Biomech 2007, 40:2672-2678.
38. Hamel AJ, Sharkey NA, Buczek FL, Michelson J: Relative motions of the
tibia, talus, and calcaneus during the stance phase of gait: a cadaver
study. Gait Posture 2004, 20:147-153.
39. Sharkey NA, Donahue SW, Ferris L: Biomechanical consequences of
plantar fascial release or rupture during gait. Part II: alterations in
forefoot loading. Foot Ankle Int 1999, 20:86-96.
doi:10.1186/1757-1146-4-7
Cite this article as: Findlow et al.: Foot kinematics in patients with two
patterns of pathological plantar hy perkeratosis. Journal of Foot and Ankle
Research 2011 4:7.
Submit your next manuscript to BioMed Central
and take full advantage of:
• Convenient online submission
• Thorough peer review
• No space constraints or color figure charges
• Immediate publication on acceptance
• Inclusion in PubMed, CAS, Scopus and Google Scholar
• Research which is freely available for redistribution
Submit your manuscript at
www.biomedcentral.com/submit
Findlow et al. Journal of Foot and Ankle Research 2011, 4:7
/>Page 12 of 12