Báo cáo y học: " Relationships between the Foot Posture Index and foot kinematics during gait in indivi" pdf
Bạn đang xem bản rút gọn của tài liệu. Xem và tải ngay bản đầy đủ của tài liệu tại đây (1.04 MB, 8 trang )
JOURNAL OF FOOT
AND ANKLE RESEARCH
Relationships between the Foot Posture Index
and foot kinematics during gait in individuals
with and without patellofemoral pain syndrome
Barton et al.
Barton et al. Journal of Foot and Ankle Research 2011, 4:10
(14 March 2011)
RESEARCH Open Access
Relationships between the Foot Posture Index
and foot kinematics during gait in individuals
with and without patellofemoral pain syndrome
Christian J Barton
1,2*
, Pazit Levinger
2
, Kay M Crossley
3,4
, Kate E Webster
2
, Hylton B Menz
2
Abstract
Background: Foot posture assessment is commonly undertaken in clinical practice for the evaluation of individuals
with patellofemoral pain syndrome (PFPS), particularly when considering prescription of foot orthoses. However,
the validity of static assessment to provide insight into dynamic function in individuals with PFPS is unclear. This
study was designed to evaluate the extent to which a static foot posture measurement tool (the Foot Posture
Index - FPI) can provide insight into kinematic variables associated with foot pronation during level walking in
individuals with PFPS and asymptomatic controls.
Methods: Twenty-six individuals (5 males, 21 females) with PFPS aged 25.1 ± 4.6 years and 20 control participants
(4 males, 16 females) aged 23.4 ± 2.3 years were recruited into the study. Each participant underwent clinical
evaluation of the FPI and kinematic analysis of the rearfoot and forefoot during walking using a three-dimensional
motion analysis system. The association of the FPI score with rearfoot eversion, forefoot dorsiflexion, and forefoot
abduction kinematic variables (magnitude, timing of peak and range of motion) were evaluated using partial
correlation coefficient statistics with gait velocity entered as a covariate.
Results: A more pronated foot type as measured by the FPI was associated with greater peak forefoot abduction
(r = 0.502, p = 0.013) and earlier peak rearfoot eversion relative to the laboratory (r = -0.440, p = 0.031) in the PFPS
group, and greater rearfoot eversion range of motion relative to the laboratory (r = 0.614, p = 0.009) in the control
group.
Conclusion: In both individuals with and without PFPS, there was fair to moderate association between the FPI
and some parameters of dynamic foot function. Inconsistent findings between the PFPS and control groups
indicate that pathology may play a role in the relationship between static foot posture and dynamic function. The
fair association between pronated foot posture as indicated by the FPI and earlier peak rearfoot eversion relative to
the laboratory observed exclusively in those with PFPS is consistent with the biomechanical model of PFPS
development. However, prospective studies are required to determine whether this relationship is causal.
Background
Foot posture assessment is frequently undertaken in
clinical practice for the evaluation of individuals with
lower limb overuse injuries, particularly when consider-
ing prescription of foot orthoses. One condition for
which foot posture assessment is commonly performed
is patellofemoral pain syndrome (PFPS) [1,2], as it is
believed that individuals with PFPS who demonstrate
signs of excessive foot pronation are likely to benefit
from foot orthoses [1,2]. It is theorised that controlling
excessive foot pronation will, in turn, limit the amount
of tibial and femoral rotation; kinematic variables linked
to patellofemoral joint loading [3-5].
Despite a paucity of empirical evidence supporting the
theoretical rationale underpinning foot orthoses pre-
scription for individuals with PFPS, most studies evalu-
ating the foot orthoses efficacy in this population have
only included individuals with signs of “excessive” pro-
nation [6]. However, thereisnoconsensusamongst
these studies for the most valid method to evaluate foot
* Correspondence:
1
School of Physiotherapy, Faculty of Health Sciences, La Trobe University,
Bundoora, Victoria, Australia
Full list of author information is available at the end of the article
Barton et al. Journal of Foot and Ankle Research 2011, 4:10
/>JOURNAL OF FOOT
AND ANKLE RESEARCH
© 2011 Barton et al; licensee BioMed Central Ltd. This is an Open Access article distributed under the terms of the Creative Commons
Attribution License (http: //creativecommons.org/licenses/by/2.0), which permits unrestricted use, distribution, and reproduction in
any medium, provided the original work is properly cited.
pronation [6]. Additionally, the reliability and validity of
previous methods used for individuals with PFPS have
not been adequately examin ed [6]. Considering the
emphasis on assessing foot pronation when prescribing
foot orthoses for individuals with PFPS, valid, reliable
and easy to implement clinical tests are essential. Raze-
ghi and Batt [7] completed a critical review of clinically
based foot classification and observed that many clini-
cally based measures of foot posture possessed good
reliability and face validity. However, they noted that the
ability of foot posture assessments to predict dynamic
function has not been well established [7].
One easy to implement clinical assessment tool to
evaluate foot posture with good face validity is the Foot
Posture Index (FPI) [8]. The FPI evaluates the multi-
segmental nature of foot posture in all three planes and
does not re quire the use of specialised equipme nt [8].
Additionally, our recent study indicated that the FPI was
able to detect differences between those with and with-
out PFPS (i.e. more pronated foot type in the PFPS
group) and also possessed high intra- and inter-rater
reliability individuals with PFPS (ICCs) [9]. Although
this study provided some justification for the use of the
FPI in clinical and research settings involving individuals
with PFPS, its ability to provide insight into dynamic
function in this population is unclear.
A number of studies attempting t o correlate clinical
measures of foot posture with dynamic foot function dur-
ing gait in healthy individuals have been published
[10-13] since Razeghi and Batt’s [7] review. Although all
of these studies reported static clinical measurements to
be associated with dynamic function, a number of metho-
dological issues need to be considered, particularly when
attempting to apply these findings to a PFPS population.
Three of these studies [10,11,13] used two dimensional
video analysis, which may not provide adequate represen-
tation of the multiplanar three-dimensional m otion
occ urring at the foot dur ing gait. Additionally, one study
evaluated arch height [13] which has subsequently been
found to poorly discriminate between individuals with
PFPS and controls [9]; and two [10,11] evaluated longitu-
dinal arch angle, which exhibits poo r reliability in indivi-
duals with PFPS [9]. Finally, all four studies [10-13]
evaluated an asymptomatic population, limiting their
applicability to a PFPS population.
In a recent study, Chuter [12] evaluated the relation-
ship between three-dimensional rearfoot kinematics and
the FPI and reported that the FPI score was able to
explain 85% of the variance in peak rearfoot eversion.
However, like other studies which evaluated clinical foot
posture measures [10,11,13], these findings were limited
to a population without defined pathology. Only one
study has evaluated the association of static with
dynamic foot function in individuals with PFPS [14].
Although this study reported that static relaxed calca-
neal angle was able to explain 59% of the variance in
peak rearfoot eversion [14], the three dimensional mar-
ker based analysis used for static assessment is not easily
replicated in a clinical setting.
Considering the findings presented above, there
appears to be a paucity of studies evaluating relationships
between static foot posture and dynamic foot function,
specifically in individuals with PFPS. The two studies
evaluating three dimensiona l kinematics have included
only one kinematic variable: the magnitud e of peak rear-
foot eversion [12,14]. Therefore, the effect of static foot
posture on other kinematic parameters associated with
foot pronation often observed visually in a clinical set-
ting, such as forefoot dorsiflexion (arch flattening) and
abduction, remai ns unclear. Additionally, the association
of foot posture with kinematics previously linked to PFPS
including peak rea rfoot eversion timing [15-18] and
range of motion [16] has not been previously evaluated.
Considering the good face validity and previously estab-
lished reliability of the FPI in individuals with PFPS [9],
this study was designed to further investigate its validity
(i.e. ability to provide insight into dynamic function). Spe-
cifically, the degree of correlation between the FPI and
(i)forefootdorsiflexion;(ii) forefoot abduction, and
(iii) rearfoot eversion kinematics during walking was eval-
uated in individuals with PFPS and asymptomatic controls.
Methods
Participants
Patellofemoral pain syndrome and control participants
were recruited from a case-control study evaluating
lower limb kinematics [18]. All participants were
recruited via advertisements placed at La Trobe
University, Melbourne University and on noticeboards
in the greater Melbourne area. All participants gave
written informed consent prior to participation and
were recruited into the study over the same period of
time. Ethical approval was granted by La Trobe
University’ s Faculty of Health Sciences Human Ethics
Committee. Participants included 26 indi viduals with
PFPS (5 males and 21 females) and 20 asymptomatic
controls (4 males and 16 females). Mean (SD) age,
height and mass of the PFPS participants was 25.1
(4.6) years, 168.6 ( 8.4) cm, and 66.7 (12.8) kg respec-
tively. Mean (SD) age, height and mass of the control
participants was 23.4 (2.3) years, 171.1 (8.4) cm, and
66.0 (15.4) kg, respectively. The physical activity le vels
of participants from each group was measured using
the long version of the 7 day self administered Interna-
tional Physical Activity Questionnaire (IPAQ) [19].
Mean (SD) weekly activity levels were 5801 (2991) and
4761 (3937) metabolic equivalents for the PFPS and
control groups, respectively.
Barton et al. Journal of Foot and Ankle Research 2011, 4:10
/>Page 2 of 7
Diagnosis of PFPS was based on definitions used in
previous RCTs [20,21]. Inclusion criteria were: aged 18 -
35 years old; insidious onset of peripatellar or retropa-
tellar knee pain of at least 6 weeks durat ion; worst pain
in the previous week of at least 30 mm on a 100 mm
visual analogue scale; pain provoke d by at least two
activiti es from running, walking, hoping, squatting, stair
negotiation, kneeling, or prolonged sitting; pain elicited
by patellar palpation, PFJ compression or resisted iso-
metric quadriceps contraction. Exclusion criteria were:
concomitant injury or pain arising from the lumbar
spine or hip; k nee internal derangement; knee ligament
insufficiency; previous knee surgery; PFJ instability; or
patellar tendinopathy. As the same participants were
also recruited for a foot orthoses clinical prediction rule
study, additional exclusion criteria included use of foot
orthoses in the previous five years. Control participants
were required to be 18 - 35 years old, have no history of
surgery or significant injury to the low back of lower
limbs, have suffered no low back or lower limb pain in
the previous six months which caused them to seek
treatment or alter physical activity levels, and have not
worn foot orthoses in the previous five years.
Procedures
Each participant attended a single data collection session
involving evaluation of the FPI and lower limb k ine-
matics during walking. The tested limb used in the
PFPS group was the symptomatic (in those with unilat-
eral symptoms) or most symptomatic (in those with
bilateral symptoms) limb. The tested limb in the control
group was randomly selected to match the proportion
of left and right limbs evaluated in the PFPS group.
Prior to motion analysis testing, the FPI was recorded
by a single rater with previously established intra-rater
(ICC = 0.88 - 0.97) and inter-rater reliability (0.79 -
0.88) in a PFPS population [9].
Foot posture was evaluated using the FPI, a six item
foot posture assessment tool, where each item is scored
between -2 and +2 to give a sum total between -12
(highly supinated) and +12 (highly pronated) [8]. Items
include: talar head palpation, curves above and below
the lateral malleoli, calcaneal angle, talonavicular bulge,
medial longitudinal arch, and forefoot to rearfoot
alignment [8].
Kinematic analysis
Motion analysis was conducted using a three dimen-
sional motion analysis system (Vicon MX system,
Oxford Metrics Ltd, Oxford, England) with 10 cameras
(8 × MX3 and 2 × MX40) operating at a sampling fre-
quency of 100 Hz. Ground reaction forces were col-
lected using two force plates (Kistler, type 9865B,
Winterthur,Switzerland;andAMTI,OR6,USA)ata
sampling frequency of 1000 Hz. Retro-reflective markers
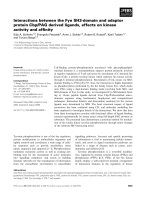
were placed on specific anatomical landmarks in accor-
dance with the Oxford Foot Mo del (OFM) and PlugIn
Gait as described by Stebbins et al [22] (see Figure 1).
This allowed the formation of forefoot, rearfoot and
tibial segments. The forefoot segment was formed by
markers placed on the base of first meta tarsal, head of
first metatarsal, head of fifth metatarsal, and base of
fifth metatarsal. The rearfoot segment was formed by
three markers bisecting the heel (distal, wand, and prox-
imal), and markers placed on the lateral calcaneus and
sustentaculum tali. The tibial segment was formed by
markers placed on the head of the fibula, tibial tuberos-
ity, anterior border of tibia, lateral aspect of tibia (5 cm
wand), and medial and lateral malleoli. Additionally, the
knee joint centre calculated from PlugIn Gait was used
to define the tibial segment in the OFM. The following
additional marker plac ements were required for the Plu-
gIn Gait model to form the thigh and hip segments: lat-
eral aspect of the femur (5 cm wand), the anterior
superior iliac spine, and the sacrum (see Figure 1).
A rel axed standing calibration trial was then captured
with knee alignment devices (KADs) in situ. The knee
joint centre calculated from this static trial was used to
define the tibial segment in the OFM. Prior to the walk-
ing trials, t he KADs and the calibration markers used to
define segment axes were removed (medial malleoli,
proximal heel, and first metatarsal head). Practice walk-
ing trials to allow familiarisation with the instrumenta-
tion and environment were then performed. Once
participants were comfortable and walking with consis-
tent velocity, motion analysis data collection com-
menced. Each participant was asked to walk at their
natural comfortable speed across a 12 m walkway. Five
successful trials (i.e. instrumented foot landed within the
borders of the first force plate they traversed) were
A
B
Figure 1 Anterior view of Oxford foot model and plug-in-gait
marker placements (A) and posterior view of Oxford foot
model marker placements (B) for the static trial.
Barton et al. Journal of Foot and Ankle Research 2011, 4:10
/>Page 3 of 7
collected for each participant. Participants were not
made aware of the force pla tes and their starting p osi-
tion was modified by the investigator to enhance the
chances of a successful trial.
Data processing
Each trial was reconstructed and the retro reflective
markers identified and labelled within the Vicon Nexus
software. Initial heel strike and toe off were defined
using force platform data. The second heel strike (sig-
nalling the end of the gait cycle) was defined as the
point where the movement trajectory of the ipsilateral
heel wand marker became stationary. Data processing
was completed by applying the OFM. Processed data
were then exported to a purposely developed Microsoft
Excel (Microsoft Corporation, Redmond, Washington,
USA) template for analysis. Variables of interest
included magnitude and timing of peak angles and
ranges of motion during stance for:
(i) Rearfoot relative to the laborat ory (floor) -
eversion
(ii) Rearfoot relative to tibia - eversion
(iii) Forefoot relative to rearfoot - dorsiflexion and
abduction
Statistical analysis
Prior to statistical analysis the ordinal FPI data were con-
verted into Rasch transformed scores to allow parametric
analysis of interval data [23]. Partial correlations with gait
velocity entered as a co-variate were calculated to deter-
mine the association between each of the FPI Rasch-
transformed sc ores and kinematic measures during walk-
ing. Gait velocity was included as a co-variate during sta-
tistical analysis due to previous PFPS case control
research indicating that some indiv iduals with PFPS may
reduce their gait velocity [24], and the reported effects
this reduction can have on lower limb kinematics
[25-27]. Based on previous recommendations [28], corre-
lations from 0.00 to 0.25 were considered poor, 0.25 to
0.50 were considered fair, 0.50 to 0.75 were considered
moderate to good, and 0.75 to 1.00 were considered
excellent. All statistical calculations were completed
using SPSS version 17.0 (SPSS Inc, Chicago, Illinois,
USA).
Results
Participant characteristics
There were no significant differences between the
groups for age (p = 0.116), height (p = 0.316), mass (p =
0.73), or weekly physical activity levels (p = 0.370).
There was a t rend toward a reduct ion in gait velocit y
for the PFPS compared to the control group (1.37 ±
0.13 m/s versus 1.45 ± 0.16 m/s, p = 0.073). Foot Pos-
ture Index scores for the PFPS and control groups ran-
ged from -1 to 10 and -1 to 6 respectively. The number
of participants from both groups falling into each foot
type categories defined by Redmond et al [8] can be
found in Table 1.
Association between foot posture measurements and
foot kinematics
Correlations between the FPI and kinematic variables
for both groups can be found in Table 2. A more p ro-
nated foot type as measured by the FPI was associated
with greater peak forefoot abduction (r = 0.502, p =
0.013) and earlier peak rearfoot eversion relative to the
laboratory (r = -0.440, p = 0.031) in the PFPS group,
explaining 28 and 23% of variance, respectively. Addi-
tionally, a more pronated foot type as measured by the
FPI was associated with greater rearfoot eversion range
of motion relative to the laborator y in the control group
(r = 0.614, p = 0.009), explaining 37% of variance.
Discussion
Foot posture is frequently evaluated in individuals with
PFPS, particularly when considering prescription of foot
orthoses. Evaluation of foot posture is often performed
under the assumption that measuring static structure
will provide insight into dynamic function, although this
is largely unproven [7]. The current study is the first to
evaluate the relationship between a clinical measure of
foot posture with established reliability (the FPI) in indi-
viduals with PFPS [9] and three-dimensional kinematics
associated with foot pronation.
In the c urrent study, a more pronated foot, as indi-
cated by the FPI, demonstrated fair association with ear-
lier timing of peak rearfoot eversion relative to the
laboratory during walking in the PFPS group. This find-
ing is consistent with other recent findings by our
group. In separate cohorts we found that individua ls
with PFPS possessed both earlier peak rearfoot eversion
during walking [18], and a more pronated foot as mea-
sured by the FPI [9]. This indicates that earlier peak
rearfoot eversion relative to the laboratory may be in
part due to foot structure in individuals w ith PFPS.
Table 1 Number of participants from each group with
foot types defined by the Foot Posture Index
Highly
supinated
(-5 to -12)
Supinated
(-1 to -4)
Normal
(0 to
+5)
Pronated
(+6 to
+9)
Highly
pronated
(+10 to
+12)
PFPS
group
021581
Control
group
011810
Barton et al. Journal of Foot and Ankle Research 2011, 4:10
/>Page 4 of 7
Considering this association did not occur in the control
group, the relationship may be of particular significance
to the development of PFPS. This may indicate that a
more pronated foot posture results in more rapid
dynamic foot pronation in people who are predisposed
to PFPS development. Prospective studies are required
to determine if this relationship is causal.
When measured relative to the tibia, rearfoot eversion
timing differences during gait have been consistently
reported in previous PFPS case control studies [15-18].
However, unlike kinematic measurement relative to the
laboratory, the FPI did not provide insight into peak rear-
foot eversion timing relative to the tibia during walking in
either group. A possible explanation for the inconsistent
findings between the two methods of rearfoot kinematic
evaluation for the PFPS group may be the influence of
tibial structure and function. When broken down, the
majority of the six FPI components evaluate solely foot
structure, with the exception of curves above and below
the lateral malleolli. Additionally, two of these measures
directly evaluate the rearfoot: talar head palpation and cal-
caneal angle. Therefore, a relationship with rearfoot
motion relative to the lab may be expected. Conversely,
none of the FP I components evalu ates tibial structu re,
indicating a relationship may be less likely.
The presence of symptoms may partly explain th e dif-
ferent associations between static and dynamic foot func-
tion found in individuals with PFPS compared to
controls. However, an alternative explanation may be the
presence of greater variation in foot posture for the PFPS
group. The FPI scores for the PFPS group ranged from -1
to 10, with nine out of the 26 participan ts considered to
possess a pronated foot type (>+5) [8]. However, in the
control group, FPI scores ranged only from -1 to 6, with
just one out of 20 participants considered to possess a
pronated foot type. This lower variation in the control
group will reduce the likelihood of finding a statistically
significant association between the two variables [28].
Despite having less variation in foot posture, relation-
ships between the FPI and kinematic s not evident in the
PFPS group were identified in the co ntrol group. A more
pronated foot as measured by the FPI was moderately
associated with greater rearfoot eversion range of motion
relative to the laboratory. Interestingly, none of the three
significant findings in this study were consistent between
the two groups. Without prospective evaluation, it cannot
be determined which of these relationships are causes
and which are effects in relation to PFPS. However, they
do highlight the need for caution when interpreting
results based on asymptomatic populations. Results from
the current study indicate that previous and future corre-
lations identified when evaluating only asymptomatic
populations may not exist in patients with PFPS.
Foot posture is often evaluated based on the assumption
that it will provide insight into the magnitude of foot pro-
nation during gait [7]. The FPI was recently found to pos-
sess good reliability and ability to discriminate between
individuals with PFPS and controls [9]. However, findings
from the current study indicate that insight into dynamic
function from assessing the FPI may be limited to moder-
ate and fair associations with peak forefoot abduction and
timing of rearfoot eversion, respectively, in the PFPS
group. Neither peak forefoot dorsiflexion, nor peak rear-
foot eversion was associated with the FPI in either group,
implying its utility in guiding clinical decisions when con-
sidering foot orthoses to control rearfoot eversion or fore-
foot dorsiflexion magnitude may be limited. Considering
this, development of a reliable and easy to implement clin-
ical assessment tool to evaluate dynamic foot function
may be needed. This could potentially replace current
static foot posture evaluation and provide greater guidance
when considering foot orthoses prescription for indivi-
duals with PFPS.
Increased magnitude of peak rearfoot eversion during
gait has been commonly c onsidered as a potential con-
tributor to PFPS [2,29]. However, previous case control
findings indicate that greater peak rearfoot eversion is
not present in individual s with PFPS during gait [15-18].
Additionally, findings from this study imply that a more
Table 2 Correlations between the Foot Posture Index
score and foot kinematics
PFPS group Control group
r value p value r value p value
Magnitude of peak angles
Rearfoot eversion
relative to laboratory
0.300 0.155 0.214 0.410
Rearfoot eversion
relative to tibia
0.167 0.435 0.230 0.374
Forefoot dorsiflexion 0.031 0.886 -0.188 0.470
Forefoot abduction 0.502* 0.013 0.168 0.520
Timing of peak angles
Rearfoot eversion
relative to laboratory
-0.440* 0.031 0.088 0.736
Rearfoot eversion
relative to tibia
-0.052 0.811 0.082 0.755
Forefoot dorsiflexion -0.172 0.420 -0.321 0.209
Forefoot abduction 0.239 0.260 -0.327 0.200
Range of motion
Rearfoot eversion
relative to laboratory
0.135 0.528 0.614** 0.009
Rearfoot eversion
relative to tibia
0.026 0.903 -0.122 0.640
Forefoot dorsiflexion -0.281 0.183 0.215 0.408
Forefoot abduction -0.340 0.104 0.122 0.641
* p < 0.05.
** p < 0.01.
PFPS = patellofemoral pain syndrome.
Positive value = more pronated foot as measured by the FPI associated with
greater peak magnitude, delayed peak timing and greater range of motion.
Barton et al. Journal of Foot and Ankle Research 2011, 4:10
/>Page 5 of 7
pronated foot posture may not relate to PFPS pathology
through influences on peak rearfoot eversion. Interest-
ingly, in this study we found associations between the
FPI and earlier peak rearfoot eversion relative to the
laboratory, a kinematic feature we recently found t o be
associated with PFPS [18]. It is also possibl e that other
biomechanical variables during gait previously linked to
PFPS including knee [30] and PFJ [31,32] loading, and
lowe r limb neuromuscular control [33-35] may be asso-
ciated with foot posture. Investigating these possibilities
may improve foot orthoses design for individuals with
PFPS.
Contrary to findings in the current study, Chuter [12]
recently reported that a more pronated foot as measured
by the FPI was associated with greater peak rearfoot
eversion in a group of participants without defined
pathology. Although the effect of pathology on kine-
matics may explain equivocal findings between Chuter’s
[12] study and the PFPS group in the current study,
such an effect cannot explain equivocal findings with
the control group from the current study. However,
there are two possible explanations for this disparity.
Firstly, Chuter [12] evaluated a larger cohort (n = 40)
than the two cohorts evaluated in the current study
(PFPS = 26 and control = 20), which is likely to lead to
stronger statistical associations between two variables
[28]. Secondly, C huter [12] selectively recruited a range
of foot postures (i.e. 20 normal and 20 pronated foot
types as measured by the FPI), while the current study
recruited participants based on PFPS diagnosis and
matched these with participants of similar ages, heights
and body masses to form the control group. As a result,
the spread of FPI scores was lower in the current study’s
control group which can also result in weaker statistical
associations [28].
The results of this study need to be considered in the
context of several limitations. Firstly, we chose to evalu-
ate the FPI in this study based on the ease of clinical
application, wealth of information provided, previous
research establishing reliability [9] and strong face valid-
ity. However, other measures of foot posture such as
radiographical evaluation may provide greater insight
dynamic foot function in individuals with PFPS. Sec-
ondly, this study evaluated only rearfoot and forefoot
kinematics based on the OFM. The OFM assumes that
motion between these segments is transmitted through
the midfoot [36]. Future studies may find additional cor-
relations between static and dynamic foot function by
using kinematic models which directly evaluate midfoot
function. Thirdly, this study evaluated only one func-
tional task, walking. Considering that pain may not be
present during walking in all individuals with PFPS,
futur e research should consider evaluating more strenu-
ous tasks such as stair negotiation, squatting and
running. Finally, the results of this study are based on
retrospective case control evaluation. Therefore, whether
inconsistent relationships found between the two groups
are a cause or effect in relation to PFPS is unclear.
Future prospective research evaluating the presence of
any relationships between foot posture and function in
those who develop PFPS is required.
Conclusion
This is the first study to evaluate the relationship
between foot posture and three-dimensional kinematic s
in individuals with PFPS. A more pronated foot as mea-
sured by the FPI was moderately assoc iated with grea ter
peak forefoot abduction and fairly associated with earlier
peak rearfoot eversion relative to the labor atory in the
PFPS group, and greater rearfoot eversion range of
motion relative to the laboratory in the control group.
Inconsistent findings between the PFPS and control
groupsindicatethatpathologymayplayaroleinthe
relationship between static foot posture and dynamic
functio n. The association between pron ated foot posture
and earlier peak rearfoot eversion relative to the labora-
tory observed exclusively in those with PFPS is consistent
with the biomechanical model of PFPS development.
However, prospective studies are required to determine
whether this relationship is causal.
Acknowledgements
Prof Menz is currently a National Health and Medical Research Council of
Australia fellow (Clinical Career Development Award, ID: 433049).
Author details
1
School of Physiotherapy, Faculty of Health Sciences, La Trobe University,
Bundoora, Victoria, Australia.
2
Musculoskeletal Research Centre, Faculty of
Health Sciences, La Trobe University, Bundoora, Victoria, Australia.
3
Department of Mechanical Engineering, University of Melbourne, Victoria,
Australia.
4
School of Physiotherapy, University of Melbourne, Victoria,
Australia.
Authors’ contributions
CJB coordinated all data collection and analysis. All authors were involved in
the design of the study, interpretation of the results, helped draft the
manuscript, and read and approved the final manuscript.
Competing interests
HBM is Editor-in-Chief of the Journal of Foot and Ankle Research. It is journal
policy that editors are removed from the peer review and editorial decision
making processes for pape rs they have coauthored.
Received: 20 September 2010 Accepted: 14 March 2011
Published: 14 March 2011
References
1. Powers CM: The influence of altered lower-extremity kinematics on
patellofemoral joint dysfunction: a theoretical perspective. J Orthop
Sports Phys Ther 2003, 33:639-646.
2. Tiberio D: The effect of excessive subtalar joint pronation on
patellofemoral mechanics: a theoretical model. J Orthop Sports Phys Ther
1987, 9:160-165.
3. Powers CM, Ward SR, Fredericson M, Guillet M, Shellock FG: Patellofemoral
kinematics during weight-bearing and non-weight-bearing knee
Barton et al. Journal of Foot and Ankle Research 2011, 4:10
/>Page 6 of 7
extension in persons with lateral subluxation of the patella: a
preliminary study. J Orthop Sports Phys Ther 2003, 33:677-685.
4. Lee TQ, Morris G, Csintalan RP: The influence of tibial and femoral
rotation on patellofemoral contact area and pressure. J Orthop Sports
Phys Ther 2003, 33:686-693.
5. Boling MC, Padua DA, Marshall SW, Guskiewicz K, Pyne S, Beutler A: A
prospective investigation of biomechanical risk factors for
patellofemoral pain syndrome: the Joint Undertaking to Monitor and
Prevent ACL Injury (JUMP-ACL) cohort. Am J Sports Med 2009,
37:2108-2116.
6. Barton CJ, Munteanu SE, Menz HB, Crossley KM: The efficacy of foot
orthoses in the treatment of individuals with patellofemoral pain
syndrome: a systematic review. Sports Med 40:377-395.
7. Razeghi M, Batt ME: Foot type classification: a critical review of current
methods. Gait Posture 2002, 15:282-291.
8. Redmond AC, Crosbie J, Ouvrier RA: Development and validation of a
novel rating system for scoring standing foot posture: the Foot Posture
Index. Clin Biomech 2006, 21:89-98.
9. Barton CJ, Bonanno D, Levinger P, Menz HB: Foot and ankle characteristics
in patellofemoral pain syndrome: a case control and reliability study.
J Orthop Sports Phys Ther 2010, 40:286-296.
10. McPoil TG, Cornwall MW: Prediction of dynamic foot posture during
running using the longitudinal arch angle. J Am Podiatr Med Assoc 2007,
97:102-107.
11. McPoil TG, Cornwall MW: Use of the longitudinal arch angle to predict
dynamic foot posture in walking. J Am Podiatr Med Assoc 2005,
95:114-120.
12. Chuter VH: Relationships between foot type and dynamic rearfoot
frontal plane motion. J Foot Ankle Res 2010, 3:9.
13. Franettovich MM, McPoil TG, Russell T, Skardoon G, Vicenzino B: The ability
to predict dynamic foot posture from static measurements. J Am Podiatr
Med Assoc 2007, 97:115-120.
14. Levinger P, Gilleard W: Relationship between static posture and rearfoot
motion during walking in patellofemoral pain syndrome: effect of a
reference posture for gait analysis. J Am Podiatr Med Assoc 2006,
96:323-329.
15. Callaghan MJ, Baltzopoulos V: Gait analysis in patients with anterior knee
pain. Clin Biomech 1994, 9:79-84.
16. Duffey MJ, Martin DF, Cannon DW, Craven T, Messier SP: Etiologic factors
associated with anterior knee pain in distance runners. Med Sci Sports
Exerc 2000, 32:1825-1832.
17. Levinger P, Gilleard W:
Tibia and rearfoot motion and ground reaction
forces in subjects with patellofemoral pain syndrome during walking.
Gait Posture 2007, 25:2-8.
18. Barton CJ, Levinger P, Webster KE, Menz HB: Walking kinematics in
individuals with patellofemoral pain syndrome: a case control study. Gait
Posture 2011, 33:286-291.
19. Craig CL, Marshall AL, Sjostrom M, Bauman AE, Booth ML, Ainsworth BE,
Pratt M, Ekelund U, Yngve A, Sallis JF, Oja P: International physical activity
questionnaire: 12-country reliability and validity. Med Sci Sports Exerc
2003, 35:1381-1395.
20. Crossley K, Bennell K, Green S, Cowan S, McConnell J: Physical therapy for
patellofemoral pain: a randomized, double-blinded, placebo-controlled
trial. Am J Sports Med 2002, 30:857-865.
21. Collins N, Crossley K, Beller E, Darnell R, McPoil T, Vicenzino B: Foot
orthoses and physiotherapy in the treatment of patellofemoral pain
syndrome: randomised clinical trial. BMJ 2008, 337:a1735.
22. Stebbins J, Harrington M, Thompson N, Zavatsky A, Theologis T:
Repeatability of a model for measuring multi-segment foot kinematics
in children. Gait Posture 2006, 23:401-410.
23. Keenan AM, Redmond AC, Horton M, Conaghan PG, Tennant A: The Foot
Posture Index: Rasch analysis of a novel, foot-specific outcome measure.
Arch Phys Med Rehabil 2007, 88:88-93.
24. Barton CJ, Levinger P, Menz HB, Webster KE: Kinematic gait characteristics
associated with patellofemoral pain syndrome: a systematic review. Gait
Posture 2009, 30:405-416.
25. McCulloch MU, Brunt D, Vander Linden D: The effect of foot orthotics and
gait velocity on lower limb kinematics and temporal events of stance.
J Orthop Sports Phys Ther 1993, 17:2-10.
26. Chiu MC, Wang MJ: The effect of gait speed and gender on perceived
exertion, muscle activity, joint motion of lower extremity, ground
reaction force and heart rate during normal walking. Gait Posture 2007,
25:385-392.
27. Riley PO, DellaCroce U, Kerrigan DC: Effect of age on lower extremity joint
moment contributions to gait speed. Gait Posture 2001, 14:264-270.
28. Portney LG, Watkins MP: Foundations of clinical research - applications to
practice. 3 edition. Conneticut: Appleton and Lange; 2009.
29. Powers CM, Chen PY, Reischl SF, Perry J: Comparison of foot pronation
and lower extremity rotation in persons with and without
patellofemoral pain. Foot Ankle Int 2002, 23:634-640.
30. Myer GD, Ford KR, Foss KDB, Goodman A, Ceasar A, Rauth MJ, Divine JG,
Hewitt TE: The incidence and potential pathomechanics of
patellofemoral pain in female athletes. Clin Biomech 2010, 25:700-707.
31. Brechter HJ, Powers CM: Patellofemoral joint stress during walking in
persons with and without patellofemoral pain. Med Sci Sports Exerc
2002,
34:1582-1593.
32. Brechter HJ, Powers CM: Patellofemoral joint stress during stair ascent
and descent in persons with and without patellofemoral pain. Gait
Posture 2002, 16:115-123.
33. Cowan SM, Bennell KL, Crossley KM, Hodges PW, McConnell J: Physical
therapy alters recruitment of the vasti in patellofemoral pain syndrome.
Med Sci Sports Exerc 2002, 34:1879-1885.
34. Cowan SM, Bennell KL, Hodges PW, Crossley KM, McConnell J:
Simultaneous feedforward recruitment of the vasti in untrained postural
tasks can be restored by physical therapy. J Orthop Res 2003, 21:553-558.
35. Van Tiggelen D, Cowan S, Coorevits P, Duvigneaud N, Witvrouw E: Delayed
vastus medialis obliquus to vastus lateralis onset timing contributed to
the development of patellofemoral pain in previously healthy men. Am J
Sports Med 2009, 37:1099-1105.
36. Carson MC, Harrington ME, Thompson N, O’Connor JJ, Theologis TN:
Kinematic analysis of a multi-segment foot model for research and
clinical applications: a repeatability analysis. J Biomech 2001,
34:1299-1307.
doi:10.1186/1757-1146-4-10
Cite this article as: Barton et al.: Relationships between the Foot Posture
Index and foot kinematics during gait in individuals with and without
patellofemoral pain syndrome. Journal of Foot and Ankle Research 2011
4:10.
Submit your next manuscript to BioMed Central
and take full advantage of:
• Convenient online submission
• Thorough peer review
• No space constraints or color figure charges
• Immediate publication on acceptance
• Inclusion in PubMed, CAS, Scopus and Google Scholar
• Research which is freely available for redistribution
Submit your manuscript at
www.biomedcentral.com/submit
Barton et al. Journal of Foot and Ankle Research 2011, 4:10
/>Page 7 of 7