Báo cáo y học: "he paediatric flat foot and general anthropometry in 140 Australian school children aged 7 - 10 years" ppsx
Bạn đang xem bản rút gọn của tài liệu. Xem và tải ngay bản đầy đủ của tài liệu tại đây (2.24 MB, 8 trang )
JOURNAL OF FOOT
AND ANKLE RESEARCH
The paediatric flat foot and general
anthropometry in 140 Australian school children
aged 7 - 10 years
Evans
Evans Journal of Foot and Ankle Research 2011, 4:12
(22 April 2011)
RESEARCH Open Access
The paediatric flat foot and general
anthropometry in 140 Australian school children
aged 7 - 10 years
Angela M Evans
Abstract
Background: Many studies have found a positive relationship between increased body weight and flat foot
posture in children.
Methods: From a study population of 140 children aged seven to 10 years, a sample of 31 children with flat feet
was identified by screening with the FPI-6. Basic anthropometric measures were compared between subjects with
and without flat feet as designated.
Results: The results of this study, in contrast to many others, question the association of flat feet and heavy
children. A significant relationship between foot posture and weight (FPI (L) r = -0.186 (p < 0.05), FPI(R) r = -0.194
(p < 0.05), waist girth (FPI (L) r = -0.213 (p < 0.05), FPI(R) r = -0.228 (p < 0.01) and BMI (FPI (L) r = -0.243 (p < 0.01),
FPI(R) r = -0.263 (p < 0.01) was identified, but was both weak and inverse.
Conclusions: This study presents results which conflict with those of many previous investigations addressing the
relationship between children’s weight and foot posture. In contrast to previ ous studies, the implication of these
results is that heavy children have less flat feet. Further investigation is warranted using a standardized approach to
assessment and a larger sample of children to test this apparent contradiction.
Background
Over the last decade, the incidence of childhood obesity
has increased across the globe [1,2]. The significance of
overweight and obesity in children and relationship to foot
morphology, specifically that of “flat feet”, has been inves-
tigated by numerous authors [2-7]. Obesity is associated
with many orthopaedic problems, yet few studies have clo-
sely examined the specific influence of excess body mass
in children. Typical lower limb complications cited as pos-
sibly associated with obesity include: musculoskeletal pain,
fractures, increased tibial/genu varum (B lount’sdisease),
slipped capital femoral epiphysis, and a flat foot posture
[2]. The paediatric flat foot is a controversial topic within
the general community, medical and allied h ealth fields,
and has been debated and disputed for decades [8-19].
Despite this, there are huge gaps in our knowledge about
flatfoot, as identified by a review [20].
The definition of flat foot is not standardized, never-
theless, there is general consensus that the height of the
medial longitudinal arch is the principal parameter to be
observed and measured [2,21]. The presence of flat
footed posture has long been described as a foot
abnormality often associated with pain and poor f unc-
tion. For this reason, many parents are naturally anxious
to obtain prophylactic advice and treatment if they sus-
pect that their child may suffer from this condition.
Overweight and obesity are well recognized as health
problems and ha ve been internationally standardized for
children [ 1]. Previous investigation has found that both
overweight and obesity were associated with flat foot
posture in 835 children aged three to six years with flat
foot found in 51% overweight children, 62% of obese
children, and 42% of children of normal weight [22]. A
German study used a scanner to investigate the influ-
ence of body mass on the development of a child’sfoot
in 1450 boys and 1437 girl s aged 2-14 years. This study
identified five types of feet: flat, robust, slender, short
and long. Flat and robust feet were m ore common in
Correspondence:
School of Health Science, Division of Health Science, University of South
Australia, City East Campus, North Terrace, Adelaide 5000, South Australia
Evans Journal of Foot and Ankle Research 2011, 4:12
/>JOURNAL OF FOOT
AND ANKLE RESEARCH
© 2011 Evans ; licensee BioMed Central Ltd. This is an Open Access article distributed under the terms of the Creative Commons
Attribution License ( which permits unrestricted use, dis tribution, and reproduction in
any medium, provided the original work is properly cited.
overweight children, whereas underweight children
showed more slender and long feet [23]. Similarly in a
study of 1024 Taiwanese children aged five t o 13 years,
there was significant difference in the prevalence of flat-
foot between normal-weight (27%), overweight (31%),
and obe se (56%) children [24]. Another Taiwanese study
sampled 2,083 children, between 7 and 12 years of age,
determining the presence of flatfoot from footprints.
Using this method, 59% of children were documented
with flatfoot. The incidences of flatfoot were: 67% of
males, 49% of females, and 75%, 65%, 57%, and 48% of
obese, overweight, normal weight, and underweight chil-
dren, respectively. A preponderance of flatfoot was
observed among eight year olds, with males twice as
likely to have flatfoot as females. Children who were
obese or overweight were found to be 2.66 and 1.39
timesmorelikelytohaveflatfoot than t hose of average
weight [25]. Similar findings have been found in pre-
vious s tudies conducted o n overweight and obese Aus-
tralian children [3,5].
Clinicians often disagree about the manageme nt of
flatfeet [26,27], partly because there is no standard
approach to assessment or classification. This study
investigated the r elationship between fla t foot posture,
as rated by the FPI-6 method, and body w eight and
related anthropometric measurements, in a sample of
Australian school children aged seven to ten years.
Methods
Ethical approval was obtained from the Human
Research and Ethics committee at the University of
South Australia. Two primary schools in Port Pirie were
approached and consented to being involved in the
study. Consent forms were returned from the parents of
140 children, aged between seven and 10 years. Gender
distribution for the study population consisted of 68
males and 72 females. Demographic d ata was collect ed
from the returned consent forms as was inclusion ( age)/
exclusion (no history of foot surgery or congenital disor-
ders) criteria.
The 140 children were assessed by one examiner using
the Foot Pos ture Index (FPI-6) to establish basic s tatic
foot posture [28,29]. The FPI-6 is a scaled instrument
widely used to classify foot posture along a 12 point
continuum from pronated-normal-supinated. Scores
which are positive are pronated, diverging from zero in
the direction of a flat foot, where as negative scores
indicate a supinated foot posture. Normative data sets
show that FPI-6 scores of six and above are indicative of
foot types more pronated beyond the mean value/age
than the normal range for childhood [30]. The reliability
of this examiner’ s use of the foot posture index has
been previously established [31]. Thirty-one children
were found to have a FPI-6 raw score of ≥ 6 for both
feet [32] and were deemed to have flat feet [30].
The following general body anthropometric measure-
ments for each child were made and recorded by an
additional research assist ant: height, weight and waist
girth. Height was measured using a calibrated height
gauge, weight using digital read-out scales and waist
girth was measured using a standard tape measure [1].
All measures were recorded against each child’s allo-
cated identity (ID) code. All measures were performed
with children dressed, but with shoes and socks
removed.
Data analysis
The recorded assessments yielded both categorical and
continuous data. Descriptive statistics (mean, standard
deviation, mi nimum, maximum, frequencies) were used
to examine the basic anthropometrical characteristics of
the study population. Parametric statistical correlations
(Pearson’s r) were applied to continuous data, and scat-
ter plots were used to explore and illustrate relation-
ships between parameters. An independent samples t-
test was used compare group means for BMI, with
Levene’s test for equality of variance.
Data were entered and all analyses were performed
using constructed data sets in SPSS version 1 5 (SPSS
Science, Chicago, Illinois) and Microsoft Excel 2000
(Microsoft Inc, Redmond, Washington) software
packages.
Results
Anthropometric data for the whole sample population
(N = 140), the non-flat foot group (n = 109) and for the
flat foot group (n = 31) are shown in Table 1. From
this, it can be seen that the average basic measures of
anthropometry were largely independent of foot posture
across the three groups as defined, where the anthropo-
metric means did not differ greatly. An independent
samples t-test found significant difference between the
flat foot group (mean 17.28, SD 2.59) and the non-flat
foot group (mean 18.74, SD 3.63) BMI’s. Levene’stest
for equality of variances was not significant (F = 2.07,
Sig = 0.15), hence assuming equal variances, two-tailed
significance p = 0.017 (95% CI -2.653 to -0.268).
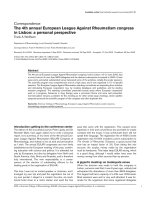
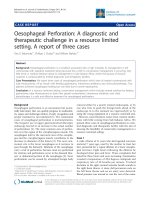
During data collection and subsequent analys is, it was
obvious to the examiner and assistant that one subject’s
anthropometry was clearly greater than all others. The
scatter plot in Figure 1 reveals this relative outlier in
terms of weight (this was also evident for height, waist
and BMI). In order to assess the effect of this atypical
subject, comparative descriptive statistics were examined
for all subjects (N = 140) versus all subjects less the out-
lier (N = 139) (Table 2). The descriptive statistics mean
Evans Journal of Foot and Ankle Research 2011, 4:12
/>Page 2 of 7
values for height, weight, BMI and waist were very simi-
lar with (N = 140) and w ithout (N = 139) the outlying
subject, whilst as expected, standard deviations were
greater with the outlier included.
The World Health Organisation reference charts for
children’s BMI across age groups indic ate that n ormal
BMI for children aged seven to 10 years are 15.5 - 16.5
kg/m
2
in boys and 15.5 - 17.0 kg/m
2
in girls. The mean
BMI for the 140 children in this study was 18.3 ± 3.4
kg/m
2
, with a wide range of BMI results: 13.7 - 37.9 kg/
m
2
. The BMI cut-off points of the International Obesity
Task Force (IOTF) were used to delineate overweight
children per year of age [33]. As depicted in Table 3,
55/140 children were classified as overweight using the
IOTF criteria. Flat feet were found in 31/140 children.
Only 5 children with flatfeet were also overweight.
(Given the primary purpose of exploring the relationship
between foot posture and BMI, distinction was not
made between overweight and obesity).
As shown in Table 4, there was significant and strong
correlation between waist girth and weight (r = 0.938; p <
0.01), height (r = 0.664; p < 0.01) and BMI (r = 0.912; p <
0.01). Correlations between waist girth and foot posture
(FPI (L) r = -0.213 (p < 0.05), FPI(R) r = -0.228 (p < 0.01),
Table 1 Anthropometric descriptive statistics for the population sample (N = 140), the flatfoot group (n = 31) and the
non-flatfoot group (n = 109).
Age
(years)
Height
(cm)
Weight
(kg)
BMI
(kg/m
2
)
Waist
(cm)
FPI-6 total Left FPI-6 total Right
Mean
All 8.71 132.85 32.77 18.30 67.36 4.12 3.74
Flat feet 8.58 133.48 30.87 17.26 64.87 6.61 6.68
Non- flat feet 8.75 132.48 33.05 18.49 67.67 3.58 3.15
Std. deviation
All 0.91 8.85 9.93 3.39 9.95 2.23 2.34
Flat feet 0.92 7.10 5.89 2.55 7.26 0.80 0.70
Non- flat feet 0.91 9.33 10.53 3.49 10.41 1.98 2.03
Range
All 3.00 55.00 85.50 24.16 69.00 11.00 11.00
Flat feet 3.00 29.00 20.70 9.67 27.00 3.00 2.00
Non- flat feet 3.00 55.00 85.50 24.16 69.00 8.00 9.00
Minimum
All 7.00 110.00 17.80 13.78 53.00 -2.00 -3.00
Flat feet 7.00 116.00 21.70 14.16 55.00 6.00 8.00
Non- flat feet 7.00 110.00 17.80 13.78 53.00 -2.00 -3.00
Maximum
All 10.00 165.00 103.30 37.94 122.00 9.00 8.00
Flat feet 10.00 145.00 42.40 23.83 82.00 9.00 8.00
Non- flat feet 10.00 165.00 103.30 37.94 122.00 8.00 9.00
)3,WRWDOVFRUH
wei
g
ht
(
k
g)
FPILTS
FPIRTS
Figure 1 This scatter plot of subjects’ foot posture and weight
revealed the obvious outlying position of one subject. (FPILTS:
FPI-6 left foot total score; FPIRTS: FPI-6 right foot total score).
Table 2 The effect of the outlier (depicted in Figure 1)
was investigated for potential to skew the data.
Height (cm) Weight (kg) BMI (kg/m
2
) Waist (cm)
N = 140 132.85 (8.85) 32.77 (9.93) 18.30 (3.39) 67.36 (9.95)
range 110 - 165 17 - 103 13 - 37 53 - 122
N = 139 132.62 (8.45) 32.26 (7.93) 18.13 (2.95) 66.96 (8.82)
110 - 155 17 - 63 13 - 26 53 - 96
Evans Journal of Foot and Ankle Research 2011, 4:12
/>Page 3 of 7
BMI and foot posture (FPI (L) r = -0.243 (p < 0.01), FPI(R)
r = -0.263 (p < 0.01), weight and foot posture (FPI (L) r =
-0.186 (p < 0.05), FPI(R) r = - 0.194 (p < 0.05) were also
significant, but weaker and inverse. Correlation between
foot posture and height was not significant (p < 0.05).
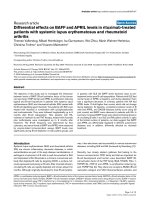
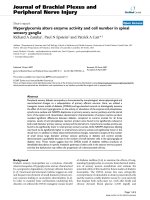
The f oot posture histograms for the st udy population
(N = 140) (Figure 2) showed normal curve distribution
for both left and right FPI -6 total scores. The FPI-6 left
foot total score averaged 4.12 (± 2.2) and the FPI-6 right
foot total score averaged 3.74 (± 2.3).
Discussion
The a nthro pometry results in this study are notable for
three main findings. Firstly, there was an overall lack of
significant difference in basic anthropometrical attri-
butes found between the flat foot versus the non-flat
foot groups. Despite the significant difference in BMI
between the flat foot and non-flat foot groups, the dis-
parity in group sizes and the relatively small sample size
of this study must b e appreciated. However this study
did not find the previously pos tulated/found result,
whereby heavier children (i.e. increased body weight)
had flatter feet [5,6,22-25].
Secondly, t he measure of waist girth, commonly used
to assess body visceral fat and predictive of secondary
increased health risks (e.g. blood pressure, blood lipids,
metabolic syndrome) [34] correlated well with both
weight and height (and therefore BMI), which is
Table 3 Children, according to age groups, foot posture and BMI cut-off points.
Age
(years)
No. children
(-/140 total
(%))
No. children
with flat
feet
No. children
without flat
feet
BMI - cut off points/age
[International Obesity
Task Force]
No. of overweight children vs
foot posture (-/mean
FPI-6 L: R)
No. of overweight
children with flat
feet
7 11 (7.4) 3 8 18 3/6.3: 5.0 1
8 50 (33.8) 13 37 18.5 10/4.4: 3.7 1
9 47 (31.8) 9 38 19 21/3.1: 2.6 3
10 32 (21.6) 6 26 20 11/2.6: 2.2 0
Total
no.
children
140 31 109 - 55 5
Using the international cut-off points for overweight (BMI 25 kg/m
2
) 55/140 children were found to be overweight. Only five of the overweight children also had
flat feet (FPI-6 greater or equal to 6 points on both left and right feet).
Table 4 Waist girth correlated significantly with weight (r = 0.938; p < 0.01) and also height (r = 0.664; p < 0.01).
Waist girth and foot posture correlations were weak and inverse viz. FPI (L) r = -0.213 (p < 0.05), FPI(R) r = -0.228
(p < 0.01).
FPILTS Height Weight BMI Waist FPIRT
FPILTS Pearson Correlation 1 037 186(*) 243(**) 213(*) .759(**
Sig. (2-tailed) .665 .028 .004 .011 .000
Height Pearson Correlation 037 1 .759(**) .458(**) .664(**) 017
Sig. (2-tailed) .665 .000 .000 .000 .844
Weight Pearson Correlation 186(*) .759(**) 1 .909(**) .938(**) 194(*)
Sig. (2-tailed) .028 .000 .000 .000 .021
BMI Pearson Correlation 243(**) .458(**) .909(**) 1 .912(**) 263(**)
Sig. (2-tailed) .004 .000 .000 .000 .002
Waist Pearson Correlation 213(*) .664(**) .938(**) .912(**) 1 228(**)
Sig. (2-tailed) .011 .000 .000 .000 .007
FPIRTS Pearson Correlation .759(**) 017 194(*) 263(**) 228(**) 1
Sig. (2-tailed) .000 .844 .021 .002 .007
* Correlation is significant at the 0.05 level (2-tailed).
** Correlation is significant at the 0.0 1 level (2-tailed).
(FPILTS: FPI-6 left foot total score; FPIRTS: FPI-6 right foot total score)
Evans Journal of Foot and Ankle Research 2011, 4:12
/>Page 4 of 7
unsurprising in that taller, heavier children are seen to
have greater waist circumference. In comparison to the
cut-off values in waist circumference for 90
th
percentile
for children in the US [35], where the average waist cir-
cum ference across genders in children aged seven to 10
years was 7 4.4 cm (range 68.4 - 80.8 cm), the average
waist circumference in our study population was 67.4
cm (range 53 - 12 2 cm); approximately ten percent less.
Of greater interest perhaps, w as the finding that the
measure of waist girth was correlated (if weakly) with
foot posture, yet inversely, whereby ‘fatter’ waists were
related to less flat feet. This contrasts to the work o f
many previous authors including Pfeiffer who, in a lar-
ger study than this, found correlation between flat feet
and w eight/obesity in younger children [22]. This find-
ing is however, supported by previously reported find-
ings in younger children with leg pain (defined as
‘ growing pains’ ), which found that children who had
growing pains were on average 5% heavier, but had less
flat feet [36].
Thirdly, the FPI-6 scores indicate that a bro ad range
of foot types i.e. supinated to pronated, were encoun-
tered within this study group, which is important for
the external validity of these findings. The mean FPI-6
scores for the non-flat foot group of the study (n = 109)
indicat e that the average foot posture is mildly pronated
in children aged seven to ten years, which supports t he
rec ently compiled normative values for the foot postur e
index [30].
This study examined 140 children aged seven to ten
years, hence derives results from considerably fewer sub-
jects than other investigations which have ranged from
study populations of 835 t o 2887 subjects [22-25]. The
narrower age range of four years, delineates it from the
larger studies and compares it with another similar
study of 200 children, aged nine to 12 years [6]. Similar
to the results of all other studies, this latter study a lso
found positive relationship between a flatter foot posture
and increased body weight. The results presented here
are clearly dissonant to all previously published research.
It is pertinent to remember that the largest studies have
been performed in Taiwanese and German children,
hence a different ethnicity profile. Studies whic h have
investigated the relationship between body mass and
foot posture are shown in Table 5.
The methods of identifying and classifying foot pos-
ture vary greatly between the studies examining this
area. Many studies have used foot print measures
[2,3,5,25], where in essence, greater surface area is
related to lower medial longitudinal arch height. The
validity of this widely used assumption remains
unfounded h owever; it is possible that the greater sur-
face area of the foot print is just soft tissue expansion
and spread, rather than overt lowering of the medial
osseous foot arch per se [7]. Other studies have looked
at foot length, width and navicular height [6] or foot x-
rays [2,21] to assess foot posture. This study employed
the FPI-6 to rate subject’s foot posture, an observ ational
scale, for which normative values e xist [30]. The data
set of 1648 individual observations of foot posture
(whi ch was used to develop the FPI-6 normative values)
in children, adults and older people, found no relation-
ship between foot posture and BMI [30]. It is possible
that the use of different foot posture measures may
account for some of the discord between the present
study’s findings and those of other investigators.
Conclusion
The findings of this study are at odds with many other
similar investigations, in that not only did it did not find
a positive relationship between increased body weight
Figure 2 The FPI-6 total scores for both left and right feet of
the study population (N = 140), children aged seven to 10
years.
Evans Journal of Foot and Ankle Research 2011, 4:12
/>Page 5 of 7
and flatter foot posture, it found the inverse. The sample
size, subject ethnicity and assessment method of foot
posture may be relevant contributors to this clear dis-
parity, but this war rants further inquiry. Othe r unidenti-
fied variables may also be proponents of altered foot
posture in children. A standardized and ideally a vali-
dated approach to the assessment of children’s foot pos-
ture and its relationship t o fundamental anthropometry
is required to clarify whether any concern about (in par-
ticular) children’ s w eight and foot posture is duly
warranted.
Acknowledgements
The author wishes to thank and acknowledge Hollie Nicholson and Noami
Zakaris for assistance with the initial data collection, and Stuart Wood for
collegial support.
Authors’ information
Angela M Evans is a Senior Research Fellow (adjunct) at the School of
Health Science, Division of Health Science, University of South Australia.
Competing interests
The authors declare that they have no competing interests.
Received: 21 May 2010 Accepted: 22 April 2011 Published: 22 April 2011
References
1. Cole TJ, Bellizzi MC, Flegal KM, Dietz WH: Establishing a standard
definition for child overweight and obesity worldwide: international
survey. BMJ 2000, 320:1-6.
2. Villarroya MA, Esquivel JM, Tomás C, Moreno LA, Buenafé A, Bueno G:
Assessment of the medial longitudinal arch in children and adolescents
with obesity: footprints and radiographic study. Eur J Pediatr 2009,
168:559-567.
3. Dowling AM, Steele JR, Baur LA: Does obesity influence foot structure and
plantar pressure patterns in prepubescent children? Int J Obes 2001,
25:845-852.
4. El O, Akcali O, Kosay C, Kaner B, Arslan Y, Sagol E, et al: Flexible flatfoot
and related factors in primary school children: a report of a screening
study. Rheumatol Int 2006, 26:1050-1053.
5. Mickle KJ, Steele JR, Munro BJ: The feet of overweight and obese young
children: are they flat or fat? Obesity 2006, 14:1949-1953.
6. Morrison SC, Durward BR, Watt GF, Donaldosn MDC: Anthropometric
Foot Structure of Peripubescent Children with Excessive versusNormal
Body Mass. A Cross-sectional Study. J Am Podiatr Med Assoc 2007,
97:366-370.
7. Onodera AN, Saccoa ICN, Morioka EH, Souza PS, deSa MR, madio AC: What
is the best method for child longitudinal plantar arch assessment and
when does arch maturation occur? Foot 2008, 18:142-149.
8. Alakija W: Prevalence of flat foot in school children in Benin City, Nigeria.
Trop Doct 1979, 9:192-194.
9. Bordelon RL: Hypermobile flatfoot in children. Comprehension,
evaluation, and treatment. Clin Orthop Relat Res 1983, Dec:7-14.
10. D’Amico JC: Developmental flatfoot. Clin Podiatry 1984, 1:535-546.
11. Ferciot CF: The etiology of developmental flatfoot. Clin Orthop Relat Res
1972, 85:7-10.
12. Gervis WH: Flat foot. BMJ 1970, 1:479-481.
13. McCarthy DJ: The developmental anatomy of pes valgo planus. Clin
Podiatr Med Surg 1989, 6:491-509.
14. Miller GR: The operative treatment of hypermobile flatfeet in the young
child. Clin Orthop Relat Res 1977, Jan-Feb:95-101.
15. Staheli LT: Planovalgus foot deformity. Current status. J Am Podiatr Med
Assoc 1999, 89:94-99.
16.
Sullivan
JA: Pediatric flatfoot: evaluation and management. J Am Acad
Orthop Surg 1999, 7:44-53.
17. Suzuki N: An electromyographic study of the role of muscles in arch
support of the normal and flat foot. Nagoya Med J 1972, 17:57-79.
18. Tareco JM, Miller NH, MacWilliams BA, Michelson JD: Defining flatfoot. Foot
Ankle Int 1999, 20:456-460.
19. Tax HR: Flexible flatfoot in children. J Am Podiatr Med Assoc 1977,
67:616-619.
20. Harris EJ: The natural history and pathophysiology of flexible flatfoot. Clin
Podiatr Med Surg 2010, 27:1-23.
21. Kanatli U, Yetkin H, Cila E: Footprint and Radiogeaphic Analysis of the
feet. J Pediatr Orthop 2001, 21:225-228.
22. Pfeiffer M, Kotz R, Ledl T, Hauser G, Sluga M: Prevalence of flat foot in
preschool-aged children. Pediatrics 2006, 118:634-639.
23. Mauch M, Grau S, Krauss I, Maiwald C, Horstmann T: Foot morphology of
normal, underweight and overweight children. Int J Obes (Lond) 2008,
32:1068-1075.
24. Chen JP, Chung MJ, Wang MJ: Flatfoot prevalence and foot dimensions
of 5- to 13-year-old children in taiwan. Foot Ankle Int 2009, 30:326-332.
25. Chang JH, Wang SH, Kuo CL, Shen HC, Hong YW, Lin LC: Prevalence of
flexible flatfoot in Taiwanese school-aged children in relation to obesity,
gender, and age. Eur J Pediatr 2010, 169:447-452.
26. Bresnahan P: The Flat-Footed Child - To Treat or Not to Treat. What is
the Clinician to Do? J Am Podiatr Med Assoc 2009, 99:178.
27. Evans AM: The Flat-Footed Child - To Treat or Not to Treat. What is the
Clinician to Do? J Am Podiatr Med Assoc 2009, 99:179.
28. Keenan AM, Redmond AC, Horton M, Conaghan PG, Tennant A: The Foot
Posture Index: Rasch analysis of a novel, foot specific outcome measure.
Rheumatology 2006, 45:i128.
29. Redmond AC, Crosbie J, Ouvrier R: Development and validation of a
novel rating system for scoring foot posture: the Foot Posture Index.
Clin Biomech 2006, 21:89-98.
30. Redmond AC, Crane YZ, Menz HB:
Normative values for the Foot Posture
Index. J
Foot
Ankle Res 2008, 1.
Table 5 Study parameters of the investigations into paediatric foot posture and body mass, show that footprint
measures have dominated foot posture assessment.
Year of
publication
First author,
country
Age of children
(years)
Sample size
(n)
Method of foot posture
assessment
Flat feet related to increased
body mass
2001 Dowling,
Australia
8 - 9 26 Footprints, pressure mat Yes
2006 Pfeiffer, Austria 3 - 6 835 Scanner, rearfoot angle Yes
2006 Mickle, Australia 4 - 5 38 Footprints, ultrasound measure of
heel fat pad
Yes
2007 Morrison, UK 9 - 12 200 Foot length/width, Navicular height Yes
2008 Mauch, Germany 2 - 14 2887 Scanner Yes
2009 Chen, Taiwan 5 - 13 1024 Footprints, 3D scan Yes
2010 Chang, Taiwan 7 - 12 2083 Footprints Yes
2011 Evans, Australia 7 - 10 140 FPI-6 No
Evans Journal of Foot and Ankle Research 2011, 4:12
/>Page 6 of 7
31. Evans AM, Copper AW, Scharfbillig RW, Scutter SD, Williams MT: Reliability
of the Foot Posture Index and Traditional Measures of Foot Position. J
Am Podiatr Med Assoc 2003, 93:203.
32. Evans AM, Scutter S, Lang LMG, Dansie BR: ’Growing pains’ in young
children: A study of the profile, experiences and quality of life issues of
four to six year old children with recurrent leg pain. The Foot 2006,
16:120-124.
33. Lobstein T, Baur L, Uauy R: Obesity in children and young people: a crisis
in public health. Obes Rev 2004, 5:4-85.
34. Lee S, Bacha F, Arslanian SA: Waist circumference, blood pressure, and
lipid components of the metabolic syndrome. J Pediatr 2006, 149:809-816.
35. Li C, Ford ES, Mokdad AH, Cook S: Recent Trends in Waist Circumference
and Waist-Height Ratio Among US Children and Adolescents. Pediatrics
2006, 118:1390-1398.
36. Evans AM, Scutter S: Are Foot Posture and Functional Health different in
Children with Growing Pains? Pediatr Int 2007, 49:991-996.
doi:10.1186/1757-1146-4-12
Cite this article as: Evans: The paediatric flat foot and general
anthropometry in 140 Australian school children aged 7 - 10 years.
Journal of Foot and Ankle Research 2011 4:12.
Submit your next manuscript to BioMed Central
and take full advantage of:
• Convenient online submission
• Thorough peer review
• No space constraints or color figure charges
• Immediate publication on acceptance
• Inclusion in PubMed, CAS, Scopus and Google Scholar
• Research which is freely available for redistribution
Submit your manuscript at
www.biomedcentral.com/submit
Evans Journal of Foot and Ankle Research 2011, 4:12
/>Page 7 of 7