báo cáo khoa học: "Rapid self-assembly of DNA on a microfluidic chip" docx
Bạn đang xem bản rút gọn của tài liệu. Xem và tải ngay bản đầy đủ của tài liệu tại đây (390.08 KB, 10 trang )
BioMed Central
Page 1 of 10
(page number not for citation purposes)
Journal of Nanobiotechnology
Open Access
Research
Rapid self-assembly of DNA on a microfluidic chip
Yao Zheng
1
, Tim Footz
2
, Dammika P Manage
1
and
Christopher James Backhouse*
1
Address:
1
Department of Electrical and Computer Engineering, 2nd Floor, ECERF Building (9107 – 116St.) University of Alberta, Edmonton,
Alberta, T6G 2V4 Canada and
2
Department of Medical Genetics, University of Alberta, Edmonton, Alberta, Canada
Email: Yao Zheng - ; Tim Footz - ; Dammika P Manage - ;
Christopher James Backhouse* -
* Corresponding author
Abstract
Background: DNA self-assembly methods have played a major role in enabling methods for
acquiring genetic information without having to resort to sequencing, a relatively slow and costly
procedure. However, even self-assembly processes tend to be very slow when they rely upon
diffusion on a large scale. Miniaturisation and integration therefore hold the promise of greatly
increasing this speed of operation.
Results: We have developed a rapid method for implementing the self-assembly of DNA within a
microfluidic system by electrically extracting the DNA from an environment containing an
uncharged denaturant. By controlling the parameters of the electrophoretic extraction and
subsequent analysis of the DNA we are able to control when the hybridisation occurs as well as
the degree of hybridisation. By avoiding off-chip processing or long thermal treatments we are able
to perform this hybridisation rapidly and can perform hybridisation, sizing, heteroduplex analysis
and single-stranded conformation analysis within a matter of minutes. The rapidity of this analysis
allows the sampling of transient effects that may improve the sensitivity of mutation detection.
Conclusions: We believe that this method will aid the integration of self-assembly methods upon
microfluidic chips. The speed of this analysis also appears to provide information upon the dynamics
of the self-assembly process.
Background
There has been a rapid growth in the number of applica-
tions that are based upon DNA self-assembly, ranging
from DNA microarrays (e.g. Affymetrix [1]) in the life sci-
ences, through conformation-based mutation detection
methods [2,3], to the ongoing development of DNA scaf-
folding methods of nanoassembly [4]. The control of the
degree of DNA hybridisation requires elaborate and time
consuming sample preparation (eg [5]) with methods
that may require hours to achieve hybridisation [6], and
on the order of an hour even within miniaturised systems
[1,7]. However, a rapid method of controlling denatura-
tion and renaturation within a microfluidic device would
enable an inexpensive mutation detection method that
could be performed within minutes.
Microfluidic devices or 'microchips' are photolithograph-
ically-defined networks of microchannels in glass where
the microchannels are similar in size to conventional cap-
illaries. These microchips provide compelling advantages
Published: 18 February 2005
Journal of Nanobiotechnology 2005, 3:2 doi:10.1186/1477-3155-3-2
Received: 21 July 2004
Accepted: 18 February 2005
This article is available from: />© 2005 Zheng et al; licensee BioMed Central Ltd.
This is an Open Access article distributed under the terms of the Creative Commons Attribution License ( />),
which permits unrestricted use, distribution, and reproduction in any medium, provided the original work is properly cited.
Journal of Nanobiotechnology 2005, 3:2 />Page 2 of 10
(page number not for citation purposes)
in terms of speed, reagent usage and integration over con-
ventional capillary or gel-based methods. The potential of
the microfluidic chip has led to the use of terms such as
"micro-total analysis systems" and "lab-on-a-chip". These
microchips have been demonstrated in conjunction with
a range of applications that integrate the polymerase
chain reaction (PCR) and capillary electrophoresis (CE)
methods with some reaching nanolitre or smaller scale
volumes. A powerful advantage of the microchip
approach is that it can implement much the same molec-
ular biology protocols and reagents as used with conven-
tional equipment, thereby allowing a wealth of
established expertise to be transferred to the microscale.
Although the most effective method of mutation detec-
tion is sequencing, it is also by far the most expensive [8].
The microarray [8] technique, although powerful, is still
handicapped by significant false positive rates and high
cost [9]. Alternative methods based on DNA self-assembly
are much faster than sequencing and these include single-
strand conformation polymorphism (SSCP), denaturing
high performance liquid chromatography (DHPLC) and
heteroduplex analysis (HA). Although their cost has been
shown to be far lower than sequencing, the achievable
sensitivities (the percentage of mutations that are success-
fully detected) are only about 90 % [10,9].
Microfluidic chips may enable extremely high through-
puts and high levels of integration. The achievement of
this goal has been hindered by the lack of successful inte-
grations of methods of mutation analysis based on single-
stranded DNA (ssDNA) and double-stranded DNA
(dsDNA) – likely due to the difficulties in controlling the
degree of hybridisation on chip without time consuming
thermal processing. A great advantage would be provided
by a method of enabling microchip-based control of a
rapid DNA self-assembly process.
The term wildtype is used to describe any given genetic
sequence that does not contain mutations. Since individ-
uals usually carry two copies of each gene, the genetic
sequence of the two copies may be identical
(homozygous) or may differ (heterozygous). DNA is nor-
mally double stranded, but under some conditions (e.g.
high temperature), melts into single strands. Under other
conditions, such as a lower temperature, these single
strands will self-assemble into the double-stranded form
again. The resulting double-stranded DNA is referred to as
a homoduplex if the sequences are perfectly complemen-
tary, or a heteroduplex if the sequences are nearly comple-
mentary (i.e. a mutant sequence paired with a wildtype
sequence). The misfit in a heteroduplex creates a "bulge"
or "bubble" where the bases do not match and this affects
the shape of the assembled molecule, typically lowering
its velocity during electrophoretic movement, i.e. the het-
eroduplexes typically migrate more slowly than the
homoduplexes. Any heterozygous sample will generate
four different duplexes, two homoduplexes and two het-
eroduplexes, although the molecules often co-migrate so
that fewer than 4 separate electropherogram peaks are
resolved.
In the HA method, electrophoretic conditions are chosen
in order to enhance the velocity differences between the
duplexes so that the process of duplex self-assembly can
be used to determine the presence of a heterozygous state
(hence indicating the presence of a mutation). In SSCP,
isolated strands of ssDNA find near-complementary
sequences on the same strand, with the result that the
strand folds upon itself in a sequence dependent manner
forming new conformations. This is a simplistic descrip-
tion since ssDNA without self-similar sequences, and
homoduplex dsDNA, may also take complex forms. Tech-
niques such as HA that aim to separate homoduplex frag-
ments from heteroduplex fragments often use some
combination of thermally and chemically denaturing
conditions to cause the partial melting of the duplex,
resulting in a shift in mobility or chromatography column
retention time that increases with the degree of mismatch.
Many medical diagnostics could be implemented on
microchips if an effective implementation of a highly sen-
sitive mutation analysis method could be integrated with
PCR/CE. Considerable work has been done in developing
SSCP [11] and HA [2,3,12]. An excellent review of such
methods has been produced by Jin et al. [13]. The main
drawback is the lower sensitivity of these methods. In
macroscopic work Kozlowski and Krzyzosiak [5] and
Kourkine et al. [14] greatly improved their sensitivities by
combining SSCP and HA methods to develop capillary-
based electrophoretic techniques with sensitivities of 90–
94 % for SSCP and 75–81 % for HA. In a landmark anal-
ysis, Kourkine et al. achieved 100 % sensitivity by analys-
ing denatured and non-denatured fragments in tandem.
Despite being highly effective, the additional sample
preparation required by these methods (i.e. separately
preparing both single and double stranded DNA and
maintaining this strandedness) complicates their imple-
mentation on microchips.
In this work, we present an electrophoretic method in
which DNA is denatured in a microchip (with forma-
mide) and, depending upon the sequence of applied volt-
ages, can be prepared with a widely varying degree of
hybridisation (i.e. from almost entirely ssDNA to almost
entirely dsDNA). Given the small volumes involved
within the microchip, diffusion time plays a small role
and the reassembly process can be fast, with dsDNA
obtained within minutes. The rapidity of the manipula-
tion possible on this system allows some investigation of
Journal of Nanobiotechnology 2005, 3:2 />Page 3 of 10
(page number not for citation purposes)
the dynamics of the reassembly, indicating that there are
well-defined intermediate states where both ssDNA and
dsDNA exist in the reassembly process.
We have applied our methods to the H63D and S65C
mutations from the HFE gene associated with hereditary
hemochromatosis (HH). The denaturation technique
used enables a combined microchip-based method of HA
and SSCP analysis.
Results
Heteroduplex Analysis
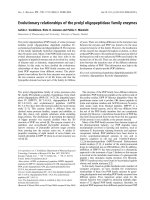
In our electrophoretic analyses with a double-T chip
(described below), the dsDNA arrives at the detection
point before the ssDNA (after about 105 s of separation,
versus 190 s of separation for the ssDNA). As shown in
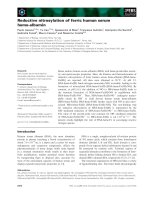
Fig. 1, to demonstrate that our analysis conditions allow
for the detection of mutations by means of HA, we ana-
lysed (undenatured) PCR products of a homozygous
wildtype, a heterozygous and a homozygous H63D
mutant. We found, as expected, that the heterozygous
sample had two distinct peaks due to the transport of het-
eroduplexes as well as homoduplexes. However, the
wildtype and homozygous mutant samples looked very
similar, with the exception of a small peak following the
main peak of the mutant sample. This small peak was
only apparent with this sample and seems to indicate a
PCR artefact. The size and shape of the bump remained
consistent throughout the experiments and did not affect
the peak intensities of either dsDNA or ssDNA. The bump
is too small to add ambiguity when resolving the H63D
mutation by HA and it should be noted that the emphasis
of this work is on inducing the formation of dsDNA and
ssDNA on-chip rather than upon improving mutation
detection.
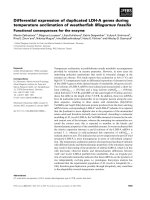
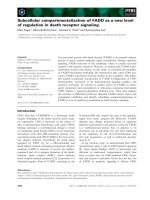
Simultaneous Analysis of ssDNA and dsDNA
As expected, after the addition of formamide the electro-
pherograms showed the presence of ssDNA peaks in addi-
tion to the dsDNA peaks (Fig. 2). The dsDNA profiles seen
here are identical to those seen prior to the addition of for-
mamide (Fig 1). The ssDNA peaks show differences in rel-
ative peak heights and in peak profile – and most notably
the heterozygous sample shows a clefted peak. A compar-
ison of the ssDNA profiles for the wildtype, homozygous
mutant and heterozygous mutant would constitute a
demonstration of SSCP analysis. Although the relative
spacing of the ssDNA peaks differs between the wildtype
and homozygous mutant, the most obvious difference is
the clefted peak seen in the electropherogram of the het-
erozygous sample. This clefted peak was not present in the
corresponding profiles of the homozygous samples (nei-
ther wildtype nor mutant). Under these conditions of
electrophoresis, the mutational status of H63D is readily
apparent. We have developed a combined HA and SSCP
method and will report on it elsewhere (that report
includes the detection of the common C282Y mutation).
To our knowledge this is the first report of a method for
performing combined on-chip HA and SSCP. Our empha-
sis here is on the ability to achieve rapid denaturation and
renaturation processes on-chip.
Reassembly of dsDNA
In order to confirm that we are reassembling DNA on chip
rather than denaturing to varying degrees we investigated
Double-stranded DNA peak profiles prior to the addition of formamide (fluorescence in relative fluorescence units (RFU) vs. time)Figure 1
Double-stranded DNA peak profiles prior to the
addition of formamide (fluorescence in relative fluo-
rescence units (RFU) vs. time). a) wildtype, b)
homozygous H63D mutant, c) heterozygous H63D mutant.
RFU
a)
Wildtype
RFU
a)
b)
Wildtype
Homozygous
H63D
179 184 189
RFU
Seconds
a)
b)
c)
Wildtype
Homozygous
H63D
Heterozygous
H63D
Journal of Nanobiotechnology 2005, 3:2 />Page 4 of 10
(page number not for citation purposes)
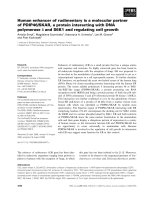
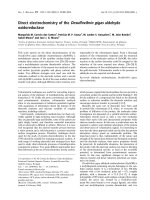
the on-chip production of heteroduplexes from two sam-
ples of homoduplexes (i.e. homozygous) samples. Fig.
3a) shows the results of the analysis of a mix of the dsDNA
from a homozygous H63D and its corresponding
wildtype. This first analysis (done without the addition of
formamide) showed a peak profile similar to that seen for
the pure wildtype or homozygous mutant in Fig. 1 – i.e.
no heteroduplexes are evident. We then added formamide
to form a mixture in the sample well of homozygous
mutant ssDNA with wildtype ssDNA. Once electrophoret-
ically extracted from the sample well, the ssDNA rean-
neals to form heteroduplex mutants for analysis. As
expected, the dsDNA profile of Fig. 3b) is that of the het-
eroduplex profile seen in Fig. 1 (the signal to noise ratio
of this electropherogram is low because the sample is still
primarily ssDNA). This indicates that the DNA is extracted
from the formamide-rich sample well as ssDNA and reas-
sembles to dsDNA in the microchip channels.
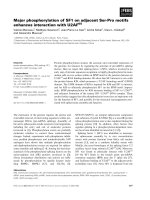
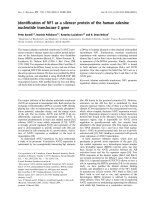
The reassembly of ssDNA can also be shown by denatur-
ating the wildtype and homozygous mutant in separate
wells. The two denatured samples were injected simulta-
neously and their ssDNA mixed in the injection channel
of a Y-chip (described below). Subsequent separation and
detection showed peak profiles (Fig. 4) similar to those
obtained with the heterozygous mutant for both HA and
SSCP. This suggests that the method of denaturation used
here is a powerful tool for comparing test samples, either
in the same or in separate sample wells. The testing of the
Electropherograms of H63D (ss and ds DNA) following addi-tion of formamide (fluorescence in relative fluorescence units (RFU) vs. time)Figure 2
Electropherograms of H63D (ss and ds DNA) follow-
ing addition of formamide (fluorescence in relative
fluorescence units (RFU) vs. time). a) wildtype, b)
homozygous H63D mutant, and c) heterozygous H63D
mutant.
RFU
a)
dsDNA ssDNA
Wildtype
RFU
a)
b)
dsDNA ssDNA
Wildtype
Homozygous
H63D
184 199 214
RFU
Seconds
a)
b)
c)
dsDNA ssDNA
Wildtype
Homozygous
H63D
Heterozygous
H63D
Double-stranded DNA peak profile of the mixture of H63D homozygous mutant with wildtype prior to and after the addition of formamide (fluorescence in relative fluorescence units (RFU) vs. time)Figure 3
Double-stranded DNA peak profile of the mixture of
H63D homozygous mutant with wildtype prior to
and after the addition of formamide (fluorescence in
relative fluorescence units (RFU) vs. time). a) prior to
and b) after
RFU
a)
177 182 18
7
RFU
Seconds
a)
b)
Journal of Nanobiotechnology 2005, 3:2 />Page 5 of 10
(page number not for citation purposes)
wildtype, homozgyous and heterozygous mutants could
be conducted by injecting samples from the desired wells
without reloading the chip. This would greatly improve
throughput.
As will be described in the following section, by varying
the electrophoretic parameters we can control the relative
amount of dsDNA formed – a significantly larger amount
could be obtained.
Dynamics of DNA Reassembly
After demonstrating that reassembly occurred within the
microchannels after extraction from the formamide-rich
sample well, it was of interest to investigate how the
sequence and timing of the sample extraction and analysis
might affect the degree of rehybridisation. In the work
presented thus far we used a 60 s injection (although 20 s
would probably have sufficed) as a means of drawing
sample directly from the sample well to the intersection,
from whence it could be analysed.
After the addition of formamide and an analysis of the
resulting sample (60 s injection and 180 s separation), a
series of analyses were performed wherein each short
injection (10 s) with a lower electric field was followed by
a 180 s separation. These short injections sampled DNA
that had remained in the microchannel since its extraction
during the 60 s injection from the first analysis. The time
required for the DNA to travel from the sample well to the
intersection with the applied electric field during the 10 s
short injections was calculated to be approximately 53 s.
(The short injections are carried out at a lower field than
the initial injection.) Thus, the two short injections of 10
s each were not enough to bring in fresh samples from the
sample well. Fig. 5 indicates that after the initial 60 s injec-
tion the dsDNA concentration steadily increases as rehy-
bridization occurs in the microchannel. Depending on
extraction timing (e.g. short injections vs. longer), the rel-
ative intensities of the ssDNA and the dsDNA can be var-
ied by a factor of approximately 10, ranging from
primarily ssDNA to primarily dsDNA. Further optimisa-
tion is possible with changes in microchip geometry.
(Shorter injection channels would allow for more ssDNA
to be introduced).
Another interesting feature of Fig. 5 is that following the
addition of formamide, the first peak of the ssDNA
(marked *) seen in the first analysis after a 60 s (Fig. 5a)
injection is never present after a subsequent 10 s injection
(Fig. 5b) although it can be recovered by another 60 s
injection (not shown). The strength of this peak is
strongly dependent upon the sample tested (as discussed
below). This interesting phenomenon was observed with
wildtype, homozygous and heteroduplex samples
corresponding to H63D and S65C (data not shown) and
the transient peak was clefted for heterozygous S65C (Fig.
6) and not clefted for H63D (Fig. 5a). It appears that this
intermediate state may be used to investigate the dynam-
ics of reassembly by a rapid microchip-based method.
Discussion
The integration onto a microchip of an effective means of
mutation detection is perhaps one of the most important
technological barriers to the implementation of micro-
chip-based medical diagnostics. The best means of attain-
ing sufficiently high sensitivity is by integrating several
existing methods of microchip-based mutation detection.
The capillary-based analysis procedure developed by
Kourkine et al. [14] is likely to be highly effective in con-
junction with the microchip analysis of prepared samples,
but since the procedure is based upon the thermal
processing (95°C and snap cooling) of diluted PCR prod-
ucts, the integration of this processing onto the microchip
may be problematic. The present method allows for such
integrations, thereby enabling the mutation analysis
throughputs predicted by Medintz et al. [15] – through-
puts as much as 100 times higher that those presently
attainable. Another issue is that of signal to noise ratios –
rather than dilute our sample (possibly weakening its sig-
nal strength) we can analyse the sample essentially undi-
luted. Moreover, we can enhance the signal strength, as we
choose, for either the ssDNA or the dsDNA.
As demonstrated here, this method also allows on-chip
comparisons of one type of DNA with another. A com-
mon problem encountered with HA methods is that they
Separate injections of wildtype and homozygous H63D sam-ples recombining on-chip (fluorescence in relative fluores-cence units (RFU) vs. time)Figure 4
Separate injections of wildtype and homozygous H63D sam-
ples recombining on-chip (fluorescence in relative fluores-
cence units (RFU) vs. time)
125 140 155
RFU
dsDNA ssDNA
Journal of Nanobiotechnology 2005, 3:2 />Page 6 of 10
(page number not for citation purposes)
cannot distinguish homozygous mutant from
homozygous wildtype – the present technique would
allow an on-chip comparison of these samples to produce
heteroduplexes that will then indicate the mutational
status.
The on chip denaturation is produced through the addi-
tion of formamide. The melting temperature for this
sequence of DNA following the addition of formamide
was found to be approximately room temperature, as
determined by
T
m
= 81.5 + 16.6(log M) + 0.41 (% G + C) - 0.72 (% for-
mamide) (1)
where T
m
is the melting temperature in degrees Celsius, M
is the monovalent salt molarity, (% G + C) is the percent
of the guanine and cytosine in the DNA strand of interest,
and (% formamide) is the percentage of formamide
added [16]. The melting of DNA was confirmed by form-
ing heteroduplexes on-chip.
The ability to quickly re-hybridise on chip allows for rapid
investigation of self-assembly mechanisms. In addition,
this re-hybridisation enables the formation of duplexes
made from a sample and a set of DNA references – i.e.
DNA self-assembly within a microchip could be used to
form duplexes that, under electrophoretic analysis, would
show the results of comparing the sample DNA with each
type of DNA in the reference set. This could avoid the need
for DNA sequencing.
The rapidity of our method appears to provide additional
information upon short-lived conformations. Although
we have added a thermal re-annealing step as part of our
PCR protocol, that step does not affect the results of anal-
ysis after adding formamide – i.e. by re-annealing on-chip
the thermal reannealing is not needed. The thermal re-
annealing stage was added to allow the direct comparison
Electropherograms after successive short injections of H63D heterozygous mutant DNA that show the change of ssDNA to dsDNA in the channels after leaving the formamide-rich environment of the sample wellFigure 5
Electropherograms after successive short injections
of H63D heterozygous mutant DNA that show the
change of ssDNA to dsDNA in the channels after
leaving the formamide-rich environment of the sam-
ple well. (fluorescence in relative fluorescence units
(RFU) vs. time). a) H63D immediately after a 60 s injec-
tion. b) H63D after a subsequent 10 s injection c) H63D after
a second subsequent 10 s injection
185 200 21
5
RFU
a)
dsDNA ssDNA
*
133 148 16
3
RFU
a)
b)
dsDNA ssDNA
*
133 148 16
3
RFU
Seconds
a)
b)
c)
dsDNA ssDNA
*
Electropherogram (ss and ds DNA) after initial 60 s injection of S65C heterozygous mutant DNA (fluorescence in relative fluorescence units (RFU) vs. time)Figure 6
Electropherogram (ss and ds DNA) after initial 60 s injection
of S65C heterozygous mutant DNA (fluorescence in relative
fluorescence units (RFU) vs. time).
183 198 213
RFU
dsDNA ssDNA
*
Journal of Nanobiotechnology 2005, 3:2 />Page 7 of 10
(page number not for citation purposes)
of heterozygous samples from the PCR with heterozygous
samples after on-chip reassembly. After adding forma-
mide, the electropherogram of the first separation analysis
following any long injection shows a clearly defined tran-
sient peak. For H63D samples the transient peak is a sin-
gle peak, whereas for S65C the transient peak is clefted.
We have found that the transient peaks vary in size signif-
icantly depending upon the electrophoretic and PCR pro-
tocols used. Initially we had assumed that this transient
peak indicated that the reassembly of the DNA was not
'random' but instead hybridised first in a high-melting
point region, and only slowly thereafter. In this model,
the presence of the split-peak would provide information
upon the location of the mutation. This suggests that
mutation S65C is within the higher melting point
domain, while the H63D is not. However, as determined
by the Meltmap program (generously provided by L. Ler-
man (MIT)), neither the H63D nor S65C mutations were
within the high melting point region of the exon (data not
shown).
Several research groups have reported artefacts that arise
from ssDNA-primer interactions [14,17-19]. Kourkine et
al. [14,18] reported that primer-ssDNA complexes can
give rise to extra peaks during SSCP. They performed tests
with samples of PCR-amplified DNA with and without
the removal of the PCR-primers after the amplification
step and found that the presence of primers led to the
appearance of extra peaks [18]. A reduction in primer con-
centration during PCR also proved to be effective in min-
imizing the appearance of these peaks. Kozlowski and
Krzyzosiak [19] have reported similar effects and sug-
gested that the primer-ssDNA complex may have a differ-
ent mobility simply because of its changed mass, or
perhaps due to a change in conformation induced by the
binding. In the context of SSCP, they discussed two
approaches for dealing with this effect 1) remove it
through purification so as to obtain simpler profiles or 2)
use the effect to advantage by achieving higher sensitivity
in the detection of mutations. Hennessy et al. [17]
performed similar tests and reported that variations in
primer concentration are the likely source of irreproduci-
ble SSCP profiles. They too suggested that this effect could
be used to increase the sensitivity of SSCP.
We therefore suggest that the transient peak is due to the
pairing of one product strand with one primer as a result
of the renaturation process. The primer-ssDNA complex is
primarily ssDNA with a small region of dsDNA at the
end(s) of the strand. It is therefore expected to migrate
with similar mobility as the ssDNA peaks. The disappear-
ance of the transient peaks with the subsequent short
injections may be a result of the complementary single
strand binding and displacing the primer. However, the
presence of the transient peaks may still provide useful
information. The differences in the transient peaks (cleft
versus no cleft) between S65C and H63D suggest that
their shape may be dependent on the position of the
mutation and that the position greatly affects the
transport of the transient form of DNA. Thus, the
phenomenon of the transient may be a general behaviour
that could provide additional mutational information. In
corroboration of past work by others [17,19], it therefore
appears that the primer effects do provide mutational
information. Moreover, this effect can be produced or
avoided depending on whether the desire is to avoid the
more complex profiles or to use them to achieve higher
sensitivity.
Conclusion
We have developed a method of rapidly disassembling
and re-assembling DNA within a microfluidic chip, allow-
ing us control over the relative amount of ss and dsDNA
and enabling the performance of rapid hybridisations
under electrophoretic control. It has been reported that,
when combined, HA and SSCP can provide sensitivities of
100% (e.g. [14]). In our work to date we have tested a
large number of samples, predominantly of HFE, BRCA1
and BRCA2 sequences, and representing approximately
several dozen different sequences. All samples containing
a mutation have had their mutational status detected by at
least one method. We expect then that the sensitivity of
the combined methods will be close to 100%. We are now
applying this method as part of a study of the application
of DNA self-assembly based mutation detection methods
(HA and SSCP) to the implementation of highly inte-
grated microchips for performing medical diagnostics.
The present work is also an early step towards directing
and studying DNA self-assembly within microfluidic sys-
tems. The method applied here could be improved signif-
icantly by shortening the injection and separation
channels and ultimately may even assist in providing the
control needed to direct the assembly of DNA-based
nanosystems within microfluidic channels.
Methods
Samples
Volunteers who had given informed consent donated
lymphocytes from which DNA was extracted and purified
by using phenol-chloroform-isoamyl alcohol extractions
[20] or the QIAmp DNA Blood kit (QIAGEN, Mississauga,
ON). The purified DNA was solubilized in a Tris-EDTA
buffer (TE, pH 8.0) and stored at 4°C. All genotypes were
confirmed on an ABI Prism 377 Slab Gel Sequencer
(Applied Biosystems, Streetsville, ON), using an ABI
Prism BigDye Terminator v3.0 Ready Reaction Cycle
Sequencing Kit with AmpliTaq DNA Polymerase (Applied
Biosystems).
Journal of Nanobiotechnology 2005, 3:2 />Page 8 of 10
(page number not for citation purposes)
The two mutations tested were H63D and S65C, from
HFE Exon 2. PCR was performed on 25 µL reactions of
both mutations. Thermal cycling was performed on all the
samples as follows: 94 C for 2 min, 35 cycles of (94°C for
30 s, 55°C for 30 s, 72°C for 30 s), and finally 72°C for
10 min, 4°C thereafter. For H63D and S65C, the PCRs are
performed with 5 µL of 30 ng/µL of genomic template
DNA, 2 µL of 5 µmol/L each of HEX-HFE-2F primer and
H63DR primer (Table 1), 2 µL each of 10 mmol/L dNTPs,
0.75 µL of 50 mmol/L of MgCl
2
, 2.5 µL of 10× PCR reac-
tion buffer and 0.5 µL of Platinum Taq DNA Polymerase.
All samples were re-annealed following PCR by first heat-
ing at 95°C for 3 min, followed by a subsequent ramping
down of temperature by 1°C per minute until 65°C. The
samples were then stored at -20°C.
Reagents
PCR reagents (polymerases, buffers and primers) were
obtained from Invitrogen (Burlington, ON). GeneScan™
polymer was used for microchip electrophoresis and
obtained from PE Applied Biosystems (Foster City, CA). A
polymer consisting of 5% GeneScan polymer and 10%
glycerol (5GS10G), commonly used for SSCP, was made.
Tris borate (Fisher Scientific, Fairland, NJ) with EDTA
(Merck KGaA, Darmstadt, Germany) was used as the run-
ning buffer in concentrations of 1× and 0.1×. Glycerol
(Sigma, Saint Louis, MO) is also added to each in 10%
and 1% concentrations respectively (1 × TBE10G and 0.1
× TBE1G). De-ionised formamide (minimum 99.5%) was
obtained from Sigma (F9037, Saint Louis, MO). The for-
mamide was aliquotted and kept frozen until required.
Microchip Electrophoresis
The microchips were purchased from Micralyne (Edmon-
ton, AB) and unless otherwise mentioned were a 4 port
double T design (Fig. 7) consisting of 4 reservoirs (or
wells) linked by two microchannels. One microchannel
served as a separation channel approximately 80 mm in
length and was nominally 50 µm wide and 20 µm deep.
In order to demonstrate control of on-chip mixing we also
used an 8-port Y-chip with 8 reservoirs, 2 of which are not
connected by any channel and with a third reservoir
connected by a 58 mm channel that was unused in this
work (Fig. 8). Electrophoresis upon microchips was
performed using the Microfluidic Tool Kit (µTK, Micra-
lyne) as described previously [2], with a laser induced flu-
orescence (LIF) system that provides excitation at a
wavelength of 532 nm and detection at 578 nm. The LIF
signal was recorded by the µTK with sampling at 200 Hz
and these data were recorded to a PC running a compiled
LabVIEW interface (supplied by Micralyne).
Table 1: Primers Used for PCR
Amplicon – Primer Sequence 5' Label Final Concentration
HFE Exon 2 – forward 5'-TCA GAG CAG GAC CTT GGT CTT TCC-3' HEX 0.4 µM
HFE Exon 2 – reverse 5'-CAT ACC CTT GCT GTG GTT GTG ATT-3' N/a 0.4 µM
Glass microchip (Micralyne Inc.) with double-T intersectionFigure 7
Glass microchip (Micralyne Inc.) with double-T intersection.
Sample Well
4m
m
4mm
Buffer
Well
Sample Waste
Well
Separation Channel
80
mm
Buffer Waste
Well
Detection
Point
Journal of Nanobiotechnology 2005, 3:2 />Page 9 of 10
(page number not for citation purposes)
Microchip Loading and Electrophoresis
The microchip was loaded with 5GS10G polymer without
any pre-treatment. The sample well was loaded with 2.6
µL of 0.1 × TBE1G followed by 0.4 µL of DNA sample and
mixed. The remaining wells were loaded with 3 µL of 1 ×
TBE10G. In the case of the Y-chip, 0.4 µL of wildtype DNA
was added to 2.6 µL of 0.1 × TBE1G in the first sample
well and mixed. The second sample well was filled with
2.6 µL of 0.1 × TBE1G and 0.4 µL of homozygous mutant.
The operation of the µTK (injection and separation) was
automated through the use of the LabVIEW interface. LIF
detection took place 76 mm downstream from the inter-
section. We have found that the reproducibility of the
peak arrival times is within 2 per cent from one run to the
next. As such we have not needed to introduce size
standards.
Injection
The sample DNA was brought from the sample well to the
intersection and onto the sample waste well by applying
500 V/cm for 60 s. No initial injection was done with the
Y-chip prior to denaturation. During this process the
buffer and buffer waste well are left electrically discon-
nected. In doing so the intersection of the two (three)
channels is filled with the sample DNA. This stage is
referred to as an injection due to the injection of DNA into
the separation channel in the sharply defined volume of
the intersection of the channels.
Separation
Immediately following injection, the DNA caught within
the intersection is separated by applying 714 V/cm for 180
s between the buffer and buffer waste wells. During this
step, the sample and sample waste wells are left electri-
cally disconnected. The effective separation distance was
76 mm from the intersection.
Denaturation
After the initial run on the 4-port chip, 1.5 µL of the sam-
ple mixture was removed and 1.5 µL of formamide was
added and mixed. Following Howley et al. [16], this is suf-
ficient to denature the DNA with a melting temperature of
approximately 25.7°C. Since Fig. 4 clearly shows forma-
tion of heteroduplexes, we take this to indicate that the
temperature was high enough to allow strands to
interchange. Another run was then done with the same
parameters as above. In the case of the Y-chip, denatura-
tion of each sample was done immediately following the
addition of the samples to the wells. A voltage of 400 V
was applied between the sample and sample waste wells
during a 60 s injection followed by a separation of 180 s.
Subsequent electrophoretic runs followed with 10 s injec-
tions at 125 V/cm and 180 s of separation at 714 V/cm for
both the 4-port and Y-chip. No additional mixing of the
two samples for the Y-chip were required
Authors' Contributions
YZ performed the experimental work with some assist-
ance from TF. DM performed additional protocol devel-
opment. CB provided overall direction. All authors
contributed to the writing of the manuscript and all made
substantial contributions to the work.
Acknowledgements
We gratefully acknowledge the support of the Natural Sciences and Engi-
neering Research Council of Canada.
Glass microchip (Micralyne Inc.) with Y-shaped intersecting channelsFigure 8
Glass microchip (Micralyne Inc.) with Y-shaped intersecting channels.
Sample Waste
Well
Sample Wells
80
mm
Detection
Point
Buffer Waste
Well
Buffer
Well
5m
m
5m
m
58
mm
2.5mm
1mm
Publish with BioMed Central and every
scientist can read your work free of charge
"BioMed Central will be the most significant development for
disseminating the results of biomedical research in our lifetime."
Sir Paul Nurse, Cancer Research UK
Your research papers will be:
available free of charge to the entire biomedical community
peer reviewed and published immediately upon acceptance
cited in PubMed and archived on PubMed Central
yours — you keep the copyright
Submit your manuscript here:
/>BioMedcentral
Journal of Nanobiotechnology 2005, 3:2 />Page 10 of 10
(page number not for citation purposes)
References
1. Anderson RC, Su X, Bogdan GJ, Fenton J: A miniature integrated
device for automated multistep genetic assays. Nucleic Acids
Res 2000, 28:E60.
2. Footz T, Somerville MJ, Tomaszewski R, Elyas B, Backhouse CJ: Inte-
gration of Combined Heteroduplex/Restriction Fragment
Length Polymorphism Analysis on an Electrophoresis Micro-
chip for the Detection of Hereditary Haemochromatosis.
Analyst 2004, 129:25-31.
3. Footz T, Somerville MJ, Tomaszewski R, Sprysak KA, Backhouse CJ:
Heteroduplex-based genotyping with microchip electro-
phoresis and dHPLC. Genet Test 2003, 7:283-293.
4. Keren K, Berman RS, Buchstab E, Sivan U, Braun E: DNA-tem-
plated carbon nanotube field-effect transistor. Science 2003,
302:1380-1382.
5. Kozlowski P, Krzyzosiak WJ: Combined SSCP/duplex analysis by
capillary electrophoresis for more efficient mutation
detection. Nucleic Acids Res 2001, 29: p. Art. No. e71
6. Pappaert K, Vanderhoeven J, Van Hummelen P, Dutta B, Clicq D,
Baron GV, Desmet G: Enhancement of DNA micro-array anal-
ysis using a shear-driven micro-channel flow system. Journal of
Chromatography A 2003, 1014:1-9.
7. Ali MF, Kirby R, Goodey AP, Rodriguez MD, Ellington AD, Neikirk
DP, McDevitt JT: DNA hybridization and discrimination of sin-
gle-nucleotide mismatches using chip-based microbead
arrays. Analytical Chemistry 2003, 75:4732-4739.
8. Gross E, Arnold N, Goette J, Schwarz-Boeger U, Kiechle M: A com-
parison of BRCA1 mutation analysis by direct sequencing,
SSCP and DHPLC. Hum Genet 1999, 105:72-78.
9. Xiao W, Oefner PJ: Denaturing high-performance liquid chro-
matography: A review. Hum Mutat 2001, 17:439-474.
10. Arnold N, Gross E, Schwarz-Boeger U, Pfisterer J, Jonat W, Kiechle
M: A highly sensitive, fast, and economical technique for
mutation analysis in hereditary breast and ovarian cancers.
Hum Mutat 1999, 14:333-339.
11. Tian HJ, Jaquins-Gerstl A, Munro N, Trucco M, Brody LC, Landers JP:
Single-strand conformation polymorphism analysis by capil-
lary and microchip electrophoresis: A fast, simple method
for detection of common mutations in BRCA1 and BRCA2.
Genomics 2000, 63:25-34.
12. Tian HJ, Brody LC, Landers JP: Rapid detection of deletion, inser-
tion, and substitution mutations via heteroduplex analysis
using capillary- and microchip-based electrophoresis. Genome
Res 2000, 10:1403-1413.
13. Jin LJ, Ferrance J, Landers JP: Miniaturized electrophoresis: An
evolving role in laboratory medicine. Biotechniques 2001,
31:1332-1342.
14. Kourkine IV, Hestekin CN, Buchholz BA, Barron AE: High-through-
put, high-sensitivity genetic mutation detection by tandem
single-strand conformation polymorphism/heteroduplex
analysis capillary array electrophoresis. Anal Chem 2002,
74:2565-2572.
15. Medintz IL, Paegel BM, Blazej RG, Emrich CA, Berti L, Scherer JR,
Mathies RA: High-performance genetic analysis using micro-
fabricated capillary array electrophoresis microplates. Elec-
trophoresis 2001, 22:3845-3856.
16. Howley PM, Israel MA, Law MF, Martin MA: Rapid Method for
Detecting and Mapping Homology between Heterologous
Dnas - Evaluation of Polyomavirus Genomes. J of Biological
Chem 1979, 254:4876-4883.
17. Hennessy LK, Teare J, Ko C: PCR conditions and DNA denatu-
rants affect reproducibility of single-strand conformation
polymorphism patterns for BRCA1 mutations. Clinical
Chemistry 1998, 44:879-882.
18. Kourkine IV, Hestekin CN, Magnusdottir SO, Barron AE: Opti-
mized sample preparation for tandem capillary electro-
phoresis single-stranded conformational polymorphism/
heteroduplex analysis. Biotechniques 2002, 33:318-325.
19. Kozlowski P, Krzyzosiak WJ: Optimum sample medium for sin-
gle-nucleotide polymorphism and mutation detection by
capillary electrophoresis. Electrophoresis 2004, 25:990-998.
20. Sambrook J, Russell DW: Molecular cloning : a laboratory man-
ual. 3rd edition. Cold Spring Harbor, N.Y., Cold Spring Harbor Lab-
oratory Press; 2001.