báo cáo khoa học: " Inorganic phosphate nanorods are a novel fluorescent label in cell biology" pdf
Bạn đang xem bản rút gọn của tài liệu. Xem và tải ngay bản đầy đủ của tài liệu tại đây (1.16 MB, 15 trang )
BioMed Central
Page 1 of 15
(page number not for citation purposes)
Journal of Nanobiotechnology
Open Access
Research
Inorganic phosphate nanorods are a novel fluorescent label in cell
biology
Chitta Ranjan Patra, Resham Bhattacharya, Sujata Patra, Sujit Basu,
Priyabrata Mukherjee and Debabrata Mukhopadhyay*
Address: Department of Biochemistry and Molecular Biology, Mayo Clinic Cancer Center, Mayo Clinic, Rochester, Minnesota, USA
Email: Chitta Ranjan Patra - ; Resham Bhattacharya - ;
Sujata Patra - ; Sujit Basu - ; Priyabrata Mukherjee - ;
Debabrata Mukhopadhyay* -
* Corresponding author
Abstract
We report the first use of inorganic fluorescent lanthanide (europium and terbium) ortho
phosphate [LnPO
4
·H
2
O, Ln = Eu and Tb] nanorods as a novel fluorescent label in cell biology.
These nanorods, synthesized by the microwave technique, retain their fluorescent properties after
internalization into human umbilical vein endothelial cells (HUVEC), 786-O cells, or renal
carcinoma cells (RCC). The cellular internalization of these nanorods and their fluorescence
properties were characterized by fluorescence spectroscopy (FS), differential interference contrast
(DIC) microscopy, confocal microscopy, and transmission electron microscopy (TEM). At
concentrations up to 50 µg/ml, the use of [
3
H]-thymidine incorporation assays, apoptosis assays
(TUNEL), and trypan blue exclusion illustrated the non-toxic nature of these nanorods, a major
advantage over traditional organic dyes
Background
Nanotechnology, the creation of new objects in nanoscale
dimensions, is a cutting edge technology having impor-
tant applications in modern biomedical research [1-7].
Because the dimension of nanoscale devices is similar to
cellular components such as DNA and proteins [8,9],
tools developed through nanotechnology may be utilized
to detect or monitor several diseases at the molecular level
[3,10,11]. Bio-imaging with inorganic fluorescent nano-
rods probes have recently attracted widespread interest in
biology and medicine [1-4,12-14] compared to nano-
spheres. According to the reported literature [15], there is
a drastic reduction of the plasmon dephasing rate in
nanorods compared to small nanospheres due to a sup-
pression of interband damping [15]. These rods show very
little radiation damping due to their small volumes. These
findings imply large local-field enhancement factors and
relatively high light-scattering efficiencies, making metal
nanorods extremely interesting for optical applications.
Therefore, we are highly interested to examine the possi-
bility of using inorganic fluorescent nanorods, especially
lanthanide ortho phosphate LnPO
4
·H
2
O [Ln = Eu or Tb],
as fluorescent labels in cell biology. On the otherhand, in
comparison to organic dyes (including Fluorescein, Texas
Red™, Lissamine Rhodamine B, and Tetramethylrhodam-
ine) and fluorescent proteins (Green fluorescent protein,
GFP), inorganic fluorescent nanoparticles have several
unique optical and electronic properties including size-
and composition-tunable emission from visible to infra-
red wavelengths, a large stokes shift, symmetric emission
Published: 30 October 2006
Journal of Nanobiotechnology 2006, 4:11 doi:10.1186/1477-3155-4-11
Received: 28 July 2006
Accepted: 30 October 2006
This article is available from: />© 2006 Patra et al; licensee BioMed Central Ltd.
This is an Open Access article distributed under the terms of the Creative Commons Attribution License ( />),
which permits unrestricted use, distribution, and reproduction in any medium, provided the original work is properly cited.
Journal of Nanobiotechnology 2006, 4:11 />Page 2 of 15
(page number not for citation purposes)
spectrum, large absorption coefficients across a wide spec-
tral range, simultaneous excitation of multiple fluorescent
colors, very high levels of brightness, [4,13], high resist-
ance to photobleaching, and an exceptional resistance to
photo- and chemical degradation [2-5,13,16,17] ].
Bio-conjugated inorganic nanoparticles have raised new
possibilities for the ultrasensitive and multiplexed imag-
ing of molecular targets in living cells, animal models, and
possibly in human subjects. In this context, lanthanide-
based inorganic fluorescents, especially Eu- and Tb-phos-
phate nanoparticles, have attracted a great deal of atten-
tion in cell biology. Optical properties of europium (Eu)
and terbium (Tb) salts and their chelates have been used
in diverse biomedical applications, namely time-resolved
fluorometric assays and immunoassays [18-26]. Further-
more, there are some previous reports regarding the intro-
duction of inorganic luminescent nanospheres such as
CdSe, ZnS, PbSe, ZnSe, and ZnS into cells [4,27,28]; how-
ever, these compounds are toxic to the cells. As the poten-
tial toxic effects of nanomaterials (nanospheres or
nanorods) is a topic of considerable importance, the in
vivo toxicity of Eu and Tb salts will be a key factor in deter-
mining whether the fluorescent imaging lanthanide
probes could be used in vivo. In our study, lanthanide
phosphate [LnPO
4
·H
2
O, where Ln = Eu and Tb] nano-
rods were found to be non-toxic to endothelial cells as
analyzed by cell proliferation assays [29] and the TUNEL
assay. Moreover, to the best of our knowledge, there is no
known report internalization of naked (nanorods without
surface modifications of peptides, organic molecules, or
polymers) fluorescent nanorods (EuPO
4
·H
2
O and
TbPO
4
·H
2
O) into cells. In order to functionalize the sur-
face of nanorods, we used aminopropyl trimethoxy silane
(APTMS) or mercapto-propyl trimethoxy silane (MPTMS)
as reported in the literature [30]. The functionalization of
these nanorods using the microwave technique [30] is
currently ongoing in our laboratory.
To the best of our knowledge, this is the first report of
inorganic lanthanide phosphate fluorescent nanorods as
fluorescent labels in cell biology. In the present study,
EuPO
4
·H
2
O and TbPO
4
·H
2
O nanorods have been pre-
pared by microwave heating and characterized as
described previously [31]. The microwave technique is
simple, fast, clean, efficient, economical, non-toxic, and
eco-friendly [31]. The aim of our study was to investigate
whether these inorganic fluorescent nanorods were capa-
ble of entering the cells and retaining their fluorescent
properties for detection post-internalization. If so, drugs
or biomolecules attached to these nanorods can then be
detected after internalization and benefit future imaging,
therapeutics, and diagnostic purposes. The aim of this
paper is not to compare the toxicity of inorganic fluores-
cent nanorods with other inorganic fluorescent nanopar-
ticles such as CdSe or CdTe but to explore and find new
inorganic fluorescent materials that can be used as fluo-
rescent labels in cell biology.
Results and discussion
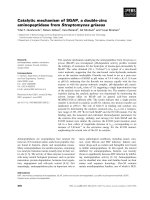
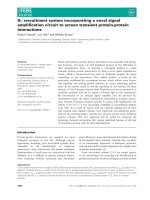
The morphologies of LnPO
4
·H
2
O [Ln = Eu and Tb] nano-
materials were further characterized by transmission elec-
tron microscopy (TEM) at different magnifications
(Figure 1A–D). The TEM images of as-synthesized prod-
ucts clearly showed that EuPO
4
·H
2
O material (Figure 1A–
B) entirely consists of nanorods [6 to 8 nm in diameter
and 100 to 300 nm in length] and TbPO
4
·H
2
O products
(Figure 1C–D) were a mixture of two rod types in microm-
eter size (small rods at 0.5 to 1.5 µm in length and 6 to 8
nm in width and bigger rods at 1.1 to 2.2 µm in length
and 80 to 130 nm in width).
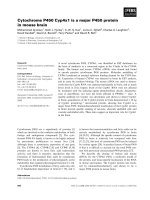
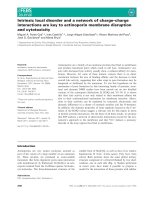
The excitation and emission spectra of LnPO
4
·H
2
O are
shown in Fig. 2A–D. The main emission peaks (Fig. 2B)
for EuPO
4
·H
2
O were observed at 588 nm, 615 nm, and
695 nm after excitation at 393 nm (Fig. 2A). Similarly, the
main emission peaks (Fig. 2D) for TbPO
4
·H
2
O were
observed at 490 nm, 543 nm (major), and 588 nm after
excitation at 378 nm (Fig. 2C). The other excitation wave-
lengths for EuPO
4
·H
2
O were 415 nm, 444 nm, 464 nm,
488 nm (week), 525 nm, 535 nm etc (data not shown).
Excitation wavelengths for TbPO
4
·H
2
O were 283 nm,
302 nm, 317 nm, 340 nm, 350 nm, 367 nm, 460 nm, 488
nm etc (all are not shown here). Excitation at any of these
wavelengths resulted in similar emission spectra (data not
shown) for EuPO
4
·H
2
O and TbPO
4
·H
2
O. The excitation
spectrum of Eu
3+
(Fig. 2A) and Tb
3+
(Fig. 2C) revealed an
intense band at 393 nm and at 283 nm (due to the f-f tran-
sitions), respectively. The emission spectrum (Fig. 2B) was
composed of a
5
D
0
-
7
F
J
(J = 1, 2, 3, 4) manifold of emission
lines of Eu
3+
with the magnetic-dipole allowed
5
D
0
-
7
F
1
transition (588 nm) being the most prominent emission
lines. TbPO
4
·H
2
O yielded the characteristic blue
5
D
4
-
7
F
J'
(J' = 4,5) emission and the green
5
D
3
-
7
F
J
(J = 3, 4,5,6)
emission of Tb
3+
though the
5
D
4
-
7
F
5
(543 nm) green emis-
sion was the most prominent band (Fig. 2D). Such fluo-
rescence properties of inorganic nanorods (LnPO
4
·H
2
O)
have attracted a great deal of attention in biology because
they have a strong optical emission that exhibits a sharper
spectral peak than typical organic dyes, have a large Stokes
shift, and are minimally influenced by other chemicals.
The emission spectrum has the following salient charac-
teristics: (i) large Stokes shift (615-393 = 222 or 543-283
= 260 dependent upon the emission wavelength of euro-
pium excitation at 393 nm or terbium excitation at 283
nm), (ii) a narrow and symmetric emission at 615 nm for
europium and 543 nm for terbium, and (iii) a long-lasting
existence. Therefore, our nanorods, despite its slightly
larger size, satisfy all the criteria of inorganic fluorescent
nanoparticles.
Journal of Nanobiotechnology 2006, 4:11 />Page 3 of 15
(page number not for citation purposes)
TEM images of as-synthesized (A-B) EuPO
4
·H
2
O nanorods and (C-D) TbPO
4
·H
2
O nanorods with different magnifications, respectivelyFigure 1
TEM images of as-synthesized (A-B) EuPO
4
·H
2
O nanorods and (C-D) TbPO
4
·H
2
O nanorods with different magnifications,
respectively.
Journal of Nanobiotechnology 2006, 4:11 />Page 4 of 15
(page number not for citation purposes)
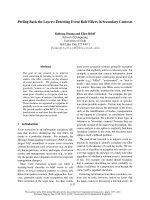
In order to determine if the fluorescence activity of these
LnPO
4
·H
2
O nanorods remain unchanged inside the cell,
786-O cells and HUVEC are incubated for 24 hours with
these nanorods at various concentrations and the emis-
sion (fluorescence) spectra were recorded on a Fluorolog-
3 Spectrofluorometer after extensive washing with PBS
(phosphate buffer saline) and shown in Figure 3A–B. Fig-
ure 3A shows the emission spectra of 786-O cells loaded
with EuPO
4
·H
2
O nanorods at different concentrations: 0
µg/ml (curve-a), 50 µg/ml (curve-b), and 100 µg/ml
(curve-c), respectively. Similarly, Figure 3B shows the
emission spectra of HUVEC cells loaded with
TbPO
4
·H
2
O nanorods at different concentrations: 0 µg/
ml (curve-a), 20 µg/ml (curve-b), 50 µg/ml (curve-c), and
100 µg/ml (curve-d), respectively. Similar results were
obtained when 786-O cells were treated with TbPO
4
·H
2
O
and HUVEC cells were treated with EuPO
4
·H
2
O nano-
rods (data not shown). It was observed that with increas-
ing concentrations of LnPO
4
·H
2
O nanorods (0 to 100 µg/
ml), the rate of nanorod accumulation inside the 786-O
and HUVEC cells increased as the fluorescence intensity
from curve -a to curve -c/d increased (Figure 3A–B). As
these nanorods show their distinct fluorescence properties
inside the HUVEC and 786-O cells, it indirectly proves
that these nanorods are internalized (which is confirmed
by TEM, as discussed later).
Excitation (A,C) and emission spectra (B,D) of as-synthesized EuPO
4
·H
2
O, TbPO
4
·H
2
O nanorodsFigure 2
Excitation (A,C) and emission spectra (B,D) of as-synthesized EuPO
4
·H
2
O, TbPO
4
·H
2
O nanorods.
Journal of Nanobiotechnology 2006, 4:11 />Page 5 of 15
(page number not for citation purposes)
Emission spectra of (A) EuPO
4
·H
2
O nanorods loaded inside 786-O cells treated at various concentrations (a = 0 µg/ml, b = 50 µg/ml, c = 100 µg/ml), (B) TbPO
4
·H
2
O nanorods loaded inside HUVEC cells treated at various concentrations (a = 0 µg/ml, b = 20 µg/ml, c = 50 µg/ml, d = 100 µg/ml)Figure 3
Emission spectra of (A) EuPO
4
·H
2
O nanorods loaded inside 786-O cells treated at various concentrations (a = 0 µg/ml, b = 50
µg/ml, c = 100 µg/ml), (B) TbPO
4
·H
2
O nanorods loaded inside HUVEC cells treated at various concentrations (a = 0 µg/ml, b
= 20 µg/ml, c = 50 µg/ml, d = 100 µg/ml).
Journal of Nanobiotechnology 2006, 4:11 />Page 6 of 15
(page number not for citation purposes)
A number of methods such as differential interference
contrast (DIC) microscopy, confocal microscopy and
transmission electron microscopy (TEM) has been used to
determine cellular trajectories of nanorods and are
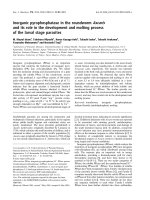
described below. Differential interference contrast (DIC)
microscopy pictures of HUVEC (Fig. 4A–F) clearly show a
significant difference in contrast between the untreated
control cells (Fig. 4A), the cells treated with EuPO
4
·H
2
O
(Fig. 4B–D), and the cells treated with TbPO
4
·H
2
O nano-
rods (Fig. 4E–F) at various concentrations. Similar results
were obtained when 7886-O cells were treated with
LnPO
4
·H
2
O nanorods (data not shown). These results
again indirectly prove that these LnPO
4
·H
2
O nanorods
are internalized.
Inorganic fluorescent EuPO
4
·H
2
O and TbPO
4
·H
2
O
nanorods inside the 786-O cells (Fig. 5) and HUVEC (data
not shown here) were detected by confocal microscopy.
The fluorescence (left column) and their corresponding
phase images of untreated control cells (Fig. 5A), cells
treated with EuPO
4
·H
2
O nanorods (Fig. 5B), and cells
treated with TbPO
4
·H
2
O nanorods (Fig. 5C) were shown.
The EuPO
4
·H
2
O nanorods have a useful excitation region
from 250 to 535 nm with a maximum at 393 nm [26]. In
this study, confocal fluorescence microscopy images and
phase images of cells were collected through the use of a
Zeiss LSM 510 confocal laser scan microscope with a C-
Apochromat 63 X/NA 1.2 water-immersion lens in con-
junction with an Argon ion laser (488 nm excitation). The
fluorescence emission was collected with a 100X micro-
scope objective then spectrally filtered using a 515 nm
long pass filter. Analysis by confocal laser scanning micro-
scopy (excitation at λ = 488 nm) shows the presence of
green fluorescent structures scattered in the cytoplasmic
compartments of cells treated with nanorods (Fig. 5B–C).
It was also observed that there were very few green fluoro-
phores (Fig. 5A) inside the cells due to auto-fluorescence
whereas in Fig. 5(B–C), fluorophores were clearly
observed due to the presence of Eu
3+
and Tb
3+
ions in crys-
tallized LnPO
4
·H
2
O nanorods. Overall, there is a signifi-
cant difference in fluorescence between untreated control
cells (Fig. 5A) and nanorods treated cells (Fig. 5B–C).
These results prove the internalization of LnPO
4
·H
2
O
nanorods inside 786-O cells. Similar results were
obtained when HUVEC were treated with LnPO
4
·H
2
O
nanorods (data not shown). On the otherhand, a red
emission was expected from cells treated with
EuPO
4
·H
2
O nanorods. Unfortunately, we could not dis-
tinguish the huge fluorescence intensity between
untreated control cells and nanorod-treated cells when we
collected the emission spectra in red region. Therefore, we
have collected the emission spectra for EuPO
4
·H
2
O-
loaded cells in the green emission region (515 nm long
pass filter). However, the confocal experiments for best
fluorescence images are currently under detailed investi-
gations in our laboratory.
Excitation and emission spectra of EuPO
4
·H
2
O and
TbPO
4
·H
2
O nanorods were detected at the recom-
mended wavelength by a spectrofluorometer, indicating
that properties of the nanorods remained unchanged
upon internalization into cells (Fig. 3A–B). However, for
confocal microscopy, the same recommended excitation
wavelengths were not available on the instrument. Thus,
we took confocal images after excitation at 488 nm and
collected emission with a 515 nm long pass filter. We
found that after excitation at 488 nm and collected the
emission spectrum with a 515 nm long pass filter, there
was a significant and clear distinction between the fluores-
cence intensity of untreated cells (Fig. 5A) and nanorod-
treated cells (Fig. 5-C). However, after scanning through a
number of different excitation wavelengths as reported in
the literature [26], we could not clearly distinguish
between the fluorescence intensity of untreated cells and
DIC microscopy pictures of HUVEC with nanorods and without nanorodsFigure 4
DIC microscopy pictures of HUVEC with nanorods and
without nanorods. A: control HUVEC with no treatment, no
nanorods were observed, (B-D): HUVEC treated with
EuPO
4
·H
2
O at different concentrations (B: 20 µg/ml, C: 50
µg/ml and D: 100 µg/ml), and (E-F): HUVEC treated with
TbPO
4
·H
2
O nanorods at different concentrations (E: 50 µg/
ml and F: 100 µg/ml). In few places, nanorods, inside the cells,
were marked by white arrow sign (B-D).
Journal of Nanobiotechnology 2006, 4:11 />Page 7 of 15
(page number not for citation purposes)
Fluoresence (First column) and their corresponding phase images (Second column) of 786-O cells treated with LnPO
4
·H
2
O nanorodsFigure 5
Fluoresence (First column) and their corresponding phase images (Second column) of 786-O cells treated with LnPO
4
·H
2
O
nanorods. (A): Control 786-O cells with no treatment, slight green color due to auto fluorescence in (A), (B): 786-O cells
treated with EuPO
4
·H
2
O nanorods, and (C): 786-O cells treated with TbPO
4
·H
2
O nanorods, taken by confocal microscope. In
few places green fluorescence color of nanorods inside the cells, were marked by white arrow sign.
Journal of Nanobiotechnology 2006, 4:11 />Page 8 of 15
(page number not for citation purposes)
nanorod-treated cells. Because this is our first report using
inorganic lanthanide phosphates (EuPO
4
·H
2
O and
TbPO
4
·H
2
O) as a fluorescent biological label, there is no
evidence to show that an emission is detectable with a 515
nm long pass filter. However, it was reported in the litera-
ture that a 488 nm excitation wavelength [26] was used in
confocal microscopy to detect luminescent properties of
europium (III) nanoparticles.
The TEM image of 786-O cells treated with EuPO
4
·H
2
O
nanorods was shown in Fig. 6. This figure clearly indicated
that in most of the cells, uptake of these nanorods
occurred. Fig. 7A–C and Fig. 7D–F represent the TEM
images of HUVEC cells treated with EuPO
4
·H
2
O nano-
rods and with TbPO
4
·H
2
O nanorods, respectively, illus-
trating that both nanorods could enter the cytoplasmic
compartments. The morphology of these cells also clearly
demonstrated that they were healthy after internalizing
these materials (Fig. 6 and Fig. 7) though their spherical
shape was due to trypsinization, neutralization with TNS,
and fixation in Trumps solution for TEM. Similarly, the
morphology of the fluorescent nanorods remained
unchanged after internalization. Similar results were
obtained when the 786-O cells were treated with
LnPO
4
·H
2
O nanorods (data not shown). From the com-
bination of Fig. 1D and Fig. 7F, it appears that the small
rods seen in Figure 1D were not internalized by the
endothelial cells as illustrated with TEM (Fig. 7F). How-
ever, other than the larger TbPO
4
·H
2
O nanorods, some
aggregated rods were visible in the cytoplasm. It is possi-
ble that these smaller rods aggregate similar to cadmium-
based salts [32] but are notably less toxic when taken up
by endothelial cells.
Considering our results from fluorescence spectroscopy,
DIC, confocal, and TEM, we've shown that these fluores-
cent nanorods can be internalized in a cellular system and
are readily visualized by microscopy. These nanorods then
offer a useful alternative as fluorescent probes for target-
ing various molecules to specific cells. The exact mecha-
nism for internalization of these nanorods still remains
unclear but is under investigation in our laboratory.
Since these inorganic nanorods show distinct fluorescence
activity upon cellular internalization, we have decided to
use these materials as a fluorescent label for HUVEC and
786-O cells. We examined their in vitro toxicity with [
3
H]-
thymidine incorporation assays [29] on normal endothe-
lial cells (HUVEC) and found them to be non-toxic (Fig.
8A–B). Although there were indications that exposure to
certain nanomaterials might lead to adverse biological
effects, this appears to dependent upon the chemical and
physical properties of the material [4,27,28]. The poten-
tial toxicity of inorganic fluorescent nanoparticles has
recently become a topic of considerable importance and
discussion, especially since in vivo toxicity is likely to be a
key factor in determining whether fluorescent probes will
be approved by regulatory agencies for human clinical
use. HUVEC proliferation [29] was clearly not affected
from internalization of materials up to 50 mg/ml com-
pared to control samples (Fig. 8A–B); however, at concen-
trations greater than 50 mg/ml, nanorods were detected to
be toxic. Experiments were repeated in triplicate and
results were reproducible.
To observe viability, HUVEC were treated with 50 µg/ml
of europium and terbium phosphate nanorods for 24–48
hours. There was no difference in cell death between
untreated control cells (no treatment) and nanorod-
treated cells as assessed by trypan blue (data not shown).
These results illustrate a biocompatibility between the
nanorods and the cells.
To investigate whether uptake of these nanorods induce
apoptosis, we assayed endothelial cells treated with
LnPO4.H2O nanorods using two apoptotic methods: (i)
fluorescence microscopy using the In Situ Cell Death
Detection Kit, TMR red (Roche, Cat. No.#12 156 792 910)
and (ii) flow cytometry using Annexin V-FITC Apoptosis
Detection Kit (Biovision, Cat. No. K101-100). The TUNEL
assay detects apoptosis-induced DNA fragmentation
through a quantitative fluorescence assay and was per-
formed according to the manufacturer's instructions. In
tunnel assay, the positive control apoptosis has been
induced in cells using camptothecin (~2.5 mM) for 4 h of
incubation (Fig. 9(A-A2)). The red-colored (TMR red-
stained nuclei) apoptotic cells (Fig. 9A) were visualized
under a microscope, counted (6 fields per sample), and
photographed using a digital fluorescence camera. The
DAPI-stained nuclei appeared blue in Fig. 9.A1 and Fig.
9.A2 shows the merged images of TMR- and DAPI-stained
cells. The results of the TUNEL assay for the untreated con-
trol HUVEC and HUVEC cells treated with LnPO
4
·H
2
O
nanorods are shown in Fig. 9B–D. In the first column (B-
D) of Figure 9, no nuclei of TMR red-stained HUVEC cells
were detected due to the absence of apoptotic cells. Blue
DAPI-stained nuclei are in the second column (B1-D1)
and the third column (B2-D2) shows the merged images.
There was no difference in the number of apoptotic cells
(~0%) detected in the untreated control experiment (First
row: B, B1 and B2) nor cells treated with EuPO
4
·H
2
O
nanorods (second row: C, C1 and C2) and TbPO
4
·H
2
O
nanorods (third row: D, D1 and D2). The results of Fig. 6
and Fig. 9 clearly indicate that these nanorods were not
toxic to endothelial cells. Similarly, flow cytometry analy-
sis yielded no difference in the number of apoptotic cells
bewteen untreated controls and nanoparticle-treated
(data not shown).
Journal of Nanobiotechnology 2006, 4:11 />Page 9 of 15
(page number not for citation purposes)
EuPO
4
·H
2
O fluorescent nanorods, were visualized by TEM inside the cytopplasmic compartments of 786-O cells. In few places, EuPO
4
·H
2
O nanorods, inside the cells, are marked by white arrow signsFigure 6
EuPO
4
·H
2
O fluorescent nanorods, were visualized by TEM inside the cytopplasmic compartments of 786-O cells. In few places,
EuPO
4
·H
2
O nanorods, inside the cells, are marked by white arrow signs.
Journal of Nanobiotechnology 2006, 4:11 />Page 10 of 15
(page number not for citation purposes)
Fluorescent LnPO
4
·H
2
O nanorods were visualized by TEM inside the cytoplasmic compartments of HUVECFigure 7
Fluorescent LnPO
4
·H
2
O nanorods were visualized by TEM inside the cytoplasmic compartments of HUVEC. (A-C)
EuPO
4
·H
2
O nanorods and (D-F) TbPO
4
·H
2
O nanorodsare observed inside the HUVEC with increasing magnifications. B was
the enlarge picture of white block in A, C was the enlarge picture of white block in B. Similarly, E was the enlarge picture of
white block in D and F was the enlarge picture of white block in E.
Journal of Nanobiotechnology 2006, 4:11 />Page 11 of 15
(page number not for citation purposes)
Effect of fluorescent nanorods (EuPO
4
and TbPO
4
) with different concentrations to normal HUVEC was observed by [
3
H]thy-midine incorporation asssayFigure 8
Effect of fluorescent nanorods (EuPO
4
and TbPO
4
) with different concentrations to normal HUVEC was observed by [
3
H]thy-
midine incorporation asssay. A serum-starved HUVEC was treated with (A) EuPO
4
·H
2
O nanorods and (B) TbPO
4
·H
2
O nano-
rods at the concentration range of 1–100 µg/mL [Eu1 = 1 µg/ml, Eu50 = 50 µg/ml, Eu100 = 100 µg/ml. Similarly, Tb1 = 1 µg/ml,
Tb50 = 50 µg/ml, Tb100 = 100 µg/ml]. Average of three independent experiments, each was done in triplicate.
Journal of Nanobiotechnology 2006, 4:11 />Page 12 of 15
(page number not for citation purposes)
TUNEL assay apoptosis of HUVECFigure 9
TUNEL assay apoptosis of HUVEC. First row: positive control experiment, second row: untreated control experiment, third
row: HUVEC treated with EuPO
4
·H
2
O at 50 µg/ml for 20 h of incubation at 37°C and fourth row: HUVEC treated with
TbPO
4
·H
2
O at 50 µg/ml for 24 h of incubation at 37°C. TUNEL assay apoptosis of HUVEC using camptothecin (4 h incubation
at 37°C) as positive inducer (First row). A: TMR red -stained nuclei of HUVEc appear in red color due to presence of apop-
totic cells, A1: The DAPI-stained nuclei appear in blue and A2: merged picture of A and A1. First Column: The nuclei of
HUVEC were stained with TMR red (B-D), red staining was not observed due to absence of no apoptotic cells. Second col-
umn: The DAPI-stained nuclei appear in blue (B1-D1), and Third column: merged picture of first and second column (B2-D2).
Journal of Nanobiotechnology 2006, 4:11 />Page 13 of 15
(page number not for citation purposes)
Parak et al. [32] has indicated that the cellular toxicity of
stable nanomaterials is primarily due to aggregation
rather than the release of Cd elements. However, in our
case, since these nanorods are based on an entirely differ-
ent material than cadmium, their mechanism is likely to
be different than Cd-based materials. Therefore, if the tox-
icity of Cd-based materials is due to an aggregation of ion,
that may not be the case for nanorods as supported by our
data.
While there is no direct evidence for the effect of nanopar-
ticle size on internalization and toxicity, some reports
indicate that nanoparticle size is involved [28,32,33]. In
our case, we are currently studying in detail the cytotoxic-
ity and mechanism for the cellular internalization of these
nanorods. Finally, we should mention in our experi-
ments, the correct control would be a non-fluorescent lan-
thanide phosphate compound instead of untreated cells.
We are currently working on the synthesis of such a rea-
gent. Along with this work, we are also determining: (a)
the mechanism of internalization; (b) the cytotoxicity of
these materials; (c) the photostability and quantum effi-
ciency of these materials; (d) the surface functionalization
of these materials; (e) drug delivery using these nanorods
after surface modifications; and (f) the comparison
between the fluorescent and non-fluorescent lanthanide
phosphate compounds in all experiments.
Nanorods are stable at room temperature indefinitely. We
have performed chemical characterizations (XRD, TGA,
DSC, TEM, fluorescence properties) on samples that are
4–5 months old and have detected no difference between
freshly prepared nanorods and older samples including
the absence of any agglomeration.
Conclusion
A novel alternative to conventional organic dyes, we have
reported the use of inorganic fluorescent EuPO
4
·H
2
O and
TbPO
4
·H
2
O as a fluorescent label in biomedical research.
We have shown internalization of EuPO
4
·H
2
O and
EuPO
4
·H
2
O nanorods by both 786-O cells and HUVEC
using fluorescence spectroscopy (FS), DIC, confocal
microscopy, and TEM. The nanorods were observed to
localize mainly in the cytoplasmic compartments of cells
and did not appear to detrimentally affect cell viability
nor induce any toxicity after internalization. These unique
fluorescent nanorods offer new advancements in the
detection and diagnosis for cancer therapy at an early
stage and we are currently working on functionalizing
these nanorods as well as utilizing them as specific vehi-
cles for drug delivery.
Experimental procedures
Materials
Europium (III) nitrate hydrate [Eu(NO
3
)
3
·xH
2
O,
99.99%], terbium (III) nitrate hexahydrate
[Tb(NO
3
)
3
·6H
2
O, 99.999%], ammonium dihydrogen-
phosphate, [NH
4
H
2
PO
4
99.999%], were purchased from
Aldrich, USA. [
3
H]-Thymidine was purchased from Amer-
sham Biosciences, Piscataway, NJ. 786-O cells were pur-
chased from American Type Culture Collection (ATCC,
TIB-186, Rockville, MD). Dulbeco's Modification of
Eagle's Medium (DMEM, 1X) was purchased from Cell-
gro, Mediatech, Inc, Herndon, VA, USA. Endothelial Cell
Basal Medium (EBM), human umbilical vein endothelial
cells (HUVEC) were obtained from Cambrex Bio Science
alkersvile, Inc, MD, USA.
Microwave-assisted synthesis of lanthanide ortho
phosphate hydrates (LnPO
4
·H
2
O)
The inorganic fluorescent nanoparticles (LnPO
4
·H
2
O)
were synthesized using microwave techniques as reported
in the literature [31]. In a typical synthesis, 20 ml 0.05(M)
of aqueous NH
4
H
2
PO
4
were added to 20 ml 0.05 (M) of
an aqueous solution of Ln(NO
3
)
3
(Ln = Eu and Tb) in a
100 ml round-bottomed flask. The pH of the solution
before and after the reaction was in the range of 1.8 – 2.2.
The sample was irradiated for 20 min with 50% of the
instrument's power. The microwave refluxing apparatus
was a modified domestic microwave oven (GOLD STARR
1000W with a 2.45 GHz), described previously [34]. In
the post-reaction treatment, the resulting products were
collected, centrifuged at 36303 g (20,000 rpm with r
av
=
8.125 cm), washed several times using ethanol and dis-
tilled water, and then dried overnight under vacuum at
room temperature. The yield of the as-prepared products
is more than 95%.
Cell culture experiments
HUVEC and 786-O cells were cultured at 10
5
cells/2 ml in
six well plates for ~24 h at 37°C and 5% CO
2
in EBM and
DMEM complete media. For investigating the cellular
localization (using confocal microscope), cells were
plated on glass cover slips and grown to 90% confluence,
and then incubated with LnPO
4
·H
2
O nanorods at a con-
centration of 50–100 µg/ml. After 20 h of incubation, the
cover slips were rinsed extensively with phosphate buff-
ered saline (PBS) and cells were fixed with freshly pre-
pared 4% paraformaldehyde in PBS for 15 min at room
temperature and then re-hydrated with PBS. Once all the
cells were fixed, the cover slips were mounted onto glass
slides with Fluor Save mounting media and examined
with DIC and confocal microscopy. For detection of apop-
tosis using the TUNEL assay (Roche, USA, Cat. No. # 12
156 792 910), cells were mounted onto glass slides with
mounting media containing DAPI (4'-6-Diamidino-2-
phenylindole).
Journal of Nanobiotechnology 2006, 4:11 />Page 14 of 15
(page number not for citation purposes)
In another set of experiments, 786-O and HUVEC cells
(10
5
cells/2 ml) were cultured in six well plates and treated
with LnPO
4
·H
2
O nanorods in corresponding DMEM and
EBM complete media without cover slips. After 20 h of
incubation with the nanorods, the cells were washed with
PBS, trypsinized, and neutralized. The cells were washed
by centrifugation and re-suspended in PBS and analyzed
with fluorescence spectroscopy, TEM, and flow cytometry
(for detection of apoptosis of cells using annexin-FTIC-PI,
Bio Vision, USA, catalog # K101-100). Cell viability for
another set of cells was determined through staining with
trypan blue and cells were counted using a hemocytome-
ter.
Cell proliferation assay
Cell proliferation to measure in vitro toxicity was per-
formed with the [
3
H]-thymidine incorporation assay
according to the reported literature [29]. Briefly, endothe-
lial cells (HUVEC; 2 × 10
4
) were seeded in 24-well plates,
cultured for 2 days in EBM, serum-starved (0.1% serum)
for 24 hours, and then treated with different concentra-
tions (1–100 µg/mL) of LnPO
4
·H
2
O (Ln = Eu, Tb). After
20 hours, 1 µCi [
3
H] thymidine was added to each well.
Four hours later, cells were washed with cold PBS, fixed
with 100% cold methanol, and collected for the measure-
ment of trichloroacetic acid-precipitable radioactivity
[29]. Experiments were repeated in triplicate and all
results were reproducible.
Apoptosis assay
Cells were seeded into 6-well plates at a density of 2 × 10
5
/2 ml of medium per well and grown overnight. After
appropriate treatment with these nanorods (50 µg/mL),
cells were extensively washed with PBS and tested with the
Annexin V-FITC Apoptosis Detection Kit (Biovision, Cat.
No. #K101-100) per the manufacturer's instructions. In
addition, apoptosis was also determined by the TUNEL
assay using the In Situ Cell Death Detection Kit, TMR red
(Roche, Cat. No. #12 156 792 910). The red apoptotic
cells were visualized on a microscope, counted (6 fields
per sample), and photographed using a digital fluores-
ence camera.
Characterization techniques
Transmission electron microscopy study
Particle morphology (microstructures of the samples) was
studied with TEM on a FEI Technai 12 operating at 80 KV.
To visualize the internalization of particles inside the
cells, we have folllowed the published literature proce-
dures [35,36].
Fluorescence microscopy
The excitation and emission (fluorescence) spectra were
recorded on a Fluorolog-3 Spectrofluorometer (HORIBA
JOBINYVON, Longjumeau, France) equipped with a
xenon lamp as the monochromator excitation source.
Differential interference contrast microscopy (DIC)
After fixation of cells on cover slips, the cells were
mounted onto glass slides with Fluor Save mounting
media and examined for DIC. Pictures were captured with
AXIOCAM high-resolution digital camera using an AXIO-
VERT 135 TV microscope (ZEISS, Germany).
Confocal fluorescence microscopy
Two dimensional confocal fluorescence microscopy
images were collected through use of LSM 510 confocal
laser scan microscope (Carl Zeiss, Inc., Oberkochcn, Ger-
many) with C-Apochromat 63 X/NA 1.2 water-immersion
lense, in conjunction with an Argon ion laser (488 nm
excitation). The fluorescence emissions were collected
through a 515 nm long pass filter.
After mounting the cells onto glass slides with DAPI,
images were collected through a LSM 510 confocal laser
scan microscope (Carl Zeiss, Inc., Oberkochcn, Germany)
with a C-Apochromat 63 X/1.2 na water-immersion lens.
The fluorescence emissions were collected through a 385–
470 nm band pass filter in conjunction with an argon ion
laser excitation of 364 nm for DAPI. The fluorescence
emissions were collected through a 560–615 nm band
pass filter in conjunction with a HeNe1 ion laser excita-
tion of 543 nm for TMR red.
Authors' contributions
CRP conceived the study and did the experiments and
data analysis. SP coordinated some cell culture experi-
ments. RB, SB, and PM also conceived the study and par-
ticipated in its design and coordination and helped to
draft the manuscript. DM provided guidance with the
experimental design and manuscript preparation. All
authors read and approved the final manuscript.
Acknowledgements
We are thankful to Drs. William Wessels, Franklyn Prendergast, Sutapa
Sinha, Kaustubh Datta, Michael Muders, and Enfeng Wang for their scientific
help and discussion. We are also thankful to J. Tarara and J. Charlesworth
for their help with the confocal and transmission electron microscopy,
respectively. This work was partly supported by NIH grants CA78383 and
HL70567 and also a grant from the American Cancer Society to D. Mukho-
padhyay.
References
1. Bruchez M, Moronne M, Gin P, Weiss S, Alivisatos PA: Semiconduc-
tor Nanocrystals as fluorescent biological labels. Science 1998,
281:2013-2016.
2. Alivisatos PA: The use of nanocrystals in biological detection.
Nature Biotechhnology. Nature Biotechnology 2004, 2:47-52.
3. Medintz IL, Uyeda HT, Goldman1 ER, Mattoussi H: Quantum dot
bioconjugates for imaging, labelling and sensing. Nat Mat
2005, 4:435-446.
Publish with BioMed Central and every
scientist can read your work free of charge
"BioMed Central will be the most significant development for
disseminating the results of biomedical research in our lifetime."
Sir Paul Nurse, Cancer Research UK
Your research papers will be:
available free of charge to the entire biomedical community
peer reviewed and published immediately upon acceptance
cited in PubMed and archived on PubMed Central
yours — you keep the copyright
Submit your manuscript here:
/>BioMedcentral
Journal of Nanobiotechnology 2006, 4:11 />Page 15 of 15
(page number not for citation purposes)
4. Gao X, Yang L, Petros JA, Marshall FF, Simons JW, Nie S: In vivo
molecular and cellular imaging with quantum dots. Curr Opin
Biotechnol 2005, 16:63-72.
5. Parak WJ, Gerion D, Pellegrino T, Zanchet D, Micheel C, Williams
CS, Boudreau R, Le Gros MA, Larabell CA, Alivisatos PA: Biological
applications of colloidal nanocrystals. Nanotechnology 2003,
14:R15-R27.
6. Jain KK: Nanotechnology in clinical laboratory diagnostics. Cli-
nica Chimica Acta 2005, 358:37-54.
7. Salata OV: Applications of nanoparticles in biology and medi-
cine. J Nanobiotechnology 2004, 2:3. doi:10.1186/1477-3155-2-3
8. Thrall JH: Nanotechnology and Medicine. Radiology 2004,
230:315-318.
9. Prescher JA, Bertozzi CR: Chemistry in living systems. Nature
Chemical bilogy 2005, 1:13-21.
10. El-Sayed IH, Huang X, El-Sayed MA: Surface Plasmon Resonance
Scattering and Absorption of anti-EGFR Antibody Conju-
gated Gold Nanoparticles in Cancer Diagnostics: Applica-
tions in Oral Cancer. Nano Lett 2005, 5:829-834.
11. Dubertret B, Calame M, Libchaber A: Single-mismatch detection
using gold-quenched fluorescent oligonucleotides. Nature bio-
technology 2001, 19:365-370.
12. Voura EB, Jaiswal JK, Mattoussi H, Simon SM: Tracking metastatic
tumor cell extravasation with quantum dot nanocrystals and
fluorescence emission-scanning microscopy. Nat Med 2004,
10:993-998.
13. Gao X, Cui Y, Levenson RM, Chung LW, Nie S: In vivocancer tar-
geting and imaging with semiconductor quantum dots nol-
ogy. Nature Biotechnol 2004, 22:969-976.
14. Michalet X, Pinaud FF, Bentolila LA, Tsay JM, Doose S, Li SS, Sundare-
san G, Wu AM, Gambhir SS, Weiss S: Quantum Dots for Live
Cells, in Vivo Imaging, and Diagnostics. Science 2005,
307:538-544.
15. Sönnichsen C, Franzl T, Wilk T, Plessen VG, Feldmann J, Wilson O,
Mulvaney P: Drastic Reduction of Plasmon Damping in Gold-
Nanorods. Phys Rev Lett 2002, 88:077402. [4 pages]
16. Murphy CJ: Optical sensing with quantum dots. Anal Chem 2002,
74:520A-526A.
17. Niemeyer CM: Nanoparticles, proteins, and nucleic acids: bio-
technology meets materials science. Angew Chem Int Edn Eng
2001, 40:4128-4158.
18. Junhua Y, Parker D, Pal R, Poole RA, Cann MJ: A Europium Com-
plex that Selectively Stains Nucleoli of Cells. JACS 2006,
128:2294-2299.
19. Lim MJ, Patton WF, Lopez MF, Spofford KH, Shojaee N, Shepro D: A
luminescent europium complex for the sensitive detection
of proteins and nucleic acids immobilized on membrane sup-
ports. Anal Biochem 1997, 245:184-195.
20. Yuan JL, Wang G, Majima K, Matsumoto K: Synthesis of a Terbium
Fluorescent Chelate and Its Application to Time-Resolved
Fluoroimmunoassay. Anal Chem 2001, 73:1869-1876.
21. Scorilas A, Bjartell A, Lilja H, Moller C, Diamandis EP: Streptavidin-
Polyvinylamine Conjugates Labeled with a Europium
Chelate: Applications in Immunoassay, Immunohistochem-
istry, and Microarrays. Clinic Chem 2000, 46:1450-1455.
22. Qin QP, Lovgren T, Pettersson K: Development of Highly Fluo-
rescent Detection Reagents for the Construction of Ultra-
sensitive Immunoassays. Anal Chem 2001, 73:1521-1529.
23. Ye Z, Tan M, Wang G, Yuan J: Novel fluorescent europium
chelate-doped silica nanoparticles: preparation, characteri-
zation and time-resolved fluorometric application. J Mater
Chem 2004, 14:851-856.
24. Hai X, Tan M, Wang G, Ye Z, Yuan J, Matsumoto K: Preparation
and a Time-Resolved Fluoroimmunoassay Application of
New Europium Fluorescent Nanoparticles. Anal Sci 2004,
20:245.
25. Nichkova M, Dosev D, Gee SJ, Hammock BD, Kennedy IM: Microar-
ray Immunoassay for Phenoxybenzoic Acid Using Polymer
Encapsulated Eu:Gd2O3 Nanoparticles as Fluorescent
Labels. Anal Chem 2005, 77:6864-6873.
26. Nichkova M, Dosev D, Perron R, Gee SJ, Hammock BD, Kennedy IM:
Eu 3+-doped Gd 2O3 nanoparticles as reporters for optical
detection and visualization of antibodies patterned by
microcontact printing. Anal Bioanal Chem 2006, 384:631-637.
27. Jaiswal JK, Mattoussi H, Mauro JM, Simon SM: Long-term multiple
color imaging of live cells using quantum dot bioconjugates.
Nature Biotechnol 2002, 21:47-51.
28. Derfus AM, Chan WCW, Bhatia SN: Probing the Cytotoxicity of
Semiconductor Quantum Dots. Nano Lett 2004, 4:11-18.
29. Basu S, Nagy JA, Pal S, Vasile E, Eckelhoefer IA, Bliss VS, Manseau EJ,
Dasgupta PS, Dvorak HF, Mukhopadhyay D: The neurotransmit-
ter dopamine inhibits angiogenesis induced by vascular per-
meability factor/vascular endothelial growthfactor. Nat Med
2001, 7:569-574.
30. Feng J, Shan G, Maquieira A, Koivunen ME, Guo B, Hammock BD,
Kennedy IM: Functionalized europium oxide nanoparticles
used as a fluorescent label in an immunoassay for atrazine.
Anal Chem 2003, 75:5282-5286.
31. Patra CR, Alexandra G, Patra S, Jacob DS, Gedanken A, Landau A,
Gofer Y: Microwave approach for the synthesis of rhab-
dophane-type lanthanide orthophosphate (Ln = La, Ce, Nd,
Sm, Eu, Gd and Tb) nanorods under solvothermal condi-
tions. New J Chem 2005, 29:733-739.
32. Kirchner C, Liedl T, Kudera S, Pellegrino T, Javier AM, Gaub HE, Stol-
lzle S, Fertig N, Parak WJ: Cytotoxicity of Colloidal CdSe and
CdSe/ZnS Nanoparticles. Nano Lett 2005, 5:331-338.
33. Xu ZP, Zeng QH, Lu GQ, Yu AB: Inorganic nanoparticles as car-
riers for efficient cellular delivery. Chemical Engineering Science
2006, 61:1027-1040.
34. Matsumura Inoue T, Tanabe M, Minami T, Ohashi T: A remarkably
rapid synthesis of ruthenium(II) polypyridine complexes by
microwave irradiation. Chemistry Letters 1994, 23:2443.
35. McDowell EM, Trump BF: Histologic fixatives suitable for. diag-
nostic light and electron microscopy. Arch Path Lab Med 1976,
10:405-414.
36. Spurr AR: A low viscosity epoxy resin embedding medium for
electron microscopy. Journal of Ultrastructure Research 1969,
26:31-36.