báo cáo khoa học: "Single-walled carbon nanotube interactions with HeLa cells" doc
Bạn đang xem bản rút gọn của tài liệu. Xem và tải ngay bản đầy đủ của tài liệu tại đây (1.81 MB, 17 trang )
BioMed Central
Page 1 of 17
(page number not for citation purposes)
Journal of Nanobiotechnology
Open Access
Research
Single-walled carbon nanotube interactions with HeLa cells
Hadi N Yehia
1
, Rockford K Draper
1,2,3
, Carole Mikoryak
3
, Erin Kate Walker
1
,
Pooja Bajaj
1
, Inga H Musselman
1,2
, Meredith C Daigrepont
1
,
Gregg R Dieckmann
1,2
and Paul Pantano*
1,2
Address:
1
Department of Chemistry, The University of Texas at Dallas, Richardson, TX 75080, USA,
2
NanoTech Institute, The University of Texas
at Dallas, Richardson, TX 75080, USA and
3
Department of Molecular & Cell Biology, The University of Texas at Dallas, Richardson, TX 75080, USA
Email: Hadi N Yehia - ; Rockford K Draper - ; Carole Mikoryak - ;
Erin Kate Walker - ; Pooja Bajaj - ; Inga H Musselman - ;
Meredith C Daigrepont - ; Gregg R Dieckmann - ; Paul Pantano* -
* Corresponding author
Abstract
This work concerns exposing cultured human epithelial-like HeLa cells to single-walled carbon
nanotubes (SWNTs) dispersed in cell culture media supplemented with serum. First, the as-
received CoMoCAT SWNT-containing powder was characterized using scanning electron
microscopy and thermal gravimetric analyses. Characterizations of the purified dispersions, termed
DM-SWNTs, involved atomic force microscopy, inductively coupled plasma – mass spectrometry,
and absorption and Raman spectroscopies. Confocal microRaman spectroscopy was used to
demonstrate that DM-SWNTs were taken up by HeLa cells in a time- and temperature-dependent
fashion. Transmission electron microscopy revealed SWNT-like material in intracellular vacuoles.
The morphologies and growth rates of HeLa cells exposed to DM-SWNTs were statistically similar
to control cells over the course of 4 d. Finally, flow cytometry was used to show that the
fluorescence from MitoSOX™ Red, a selective indicator of superoxide in mitochondria, was
statistically similar in both control cells and cells incubated in DM-SWNTs. The combined results
indicate that under our sample preparation protocols and assay conditions, CoMoCAT DM-SWNT
dispersions are not inherently cytotoxic to HeLa cells. We conclude with recommendations for
improving the accuracy and comparability of carbon nanotube (CNT) cytotoxicity reports.
Background
The structural and electronic properties of SWNTs lend
themselves to a variety of biomedical applications involv-
ing the detection and treatment of diseases, most notably
cancer [1-6]. For example, the structural change in DNA
upon shifting from the B to Z conformation sufficiently
perturbs the electronic structure of SWNTs such that the
change can be detected optically from living cells that
have taken up DNA-SWNT complexes [7]. This and other
works demonstrate how CNTs can be used as sensors
within living cells [8,9]. In another example, exposing
cells containing SWNTs to near infrared radiation kills the
cells due to the efficient optical-to-thermal energy conver-
sion of SWNTs, demonstrating that they can potentially
be used in targeted cancer therapies to eliminate cancer
cells [10]. Finally, there are a number of reports that CNTs
facilitate the transport of bound oligonucleotides, pep-
tides, and proteins across the plasma membrane [1,11-
Published: 23 October 2007
Journal of Nanobiotechnology 2007, 5:8 doi:10.1186/1477-3155-5-8
Received: 10 August 2007
Accepted: 23 October 2007
This article is available from: />© 2007 Yehia et al; licensee BioMed Central Ltd.
This is an Open Access article distributed under the terms of the Creative Commons Attribution License ( />),
which permits unrestricted use, distribution, and reproduction in any medium, provided the original work is properly cited.
Journal of Nanobiotechnology 2007, 5:8 />Page 2 of 17
(page number not for citation purposes)
19]. However, despite these and other intracellular appli-
cations not listed here, there remain technical challenges
towards realizing the potential benefits of CNTs in bio-
medicine. Namely, CNTs are extremely hydrophobic,
bundle together, and are insoluble in water.
Two approaches have been used to modify the hydropho-
bic surface of CNTs to make them water soluble and bio-
compatible. The first has been to debundle and disperse
CNTs in aqueous solution by covalently attaching water
soluble substances to the CNT surface, and the second has
involved the noncovalent association of material to the
CNT surface [20-26]. In both approaches, a wide variety of
organic adducts and biological materials have been used
successfully including oligonucleotides [7,9,10,15,17,18,
27-40], peptides [14,19,41-52], proteins [8,11-13,16,53-
59] (most notably, bovine serum albumin (BSA) [60-
63]), an assortment of polymers [64], and various cell cul-
ture media formulations [19,43,65-72]. While covalently
attaching material to CNTs is advantageous for many
applications, one serious drawback is that the covalent
attachment introduces defects in the surface of the CNTs
that often interfere with the electronic and optical proper-
ties that make CNTs so useful.
Beyond CNT dispersal, another challenge in the field is
assessing whether CNTs are inherently cytotoxic [73-80].
At present, there are roughly as many publications report-
ing no apparent cytotoxicity [10,12-14,16-19,65-
67,71,81-87], as there are reporting varying degrees of sig-
nificant cytotoxicity [68-70,72,88-95]. Two major consid-
erations in this area are how the CNTs are presented to the
organism and the purity and concentration of the CNTs.
For example, pulmonary toxicity of SWNTs has been
established when large doses of dry, unpurified SWNTs
have been blown into the lungs of rats [89,90,96]. This
method of presentation is not relevant to the small meas-
ured doses of CNTs that would be used in chemotherapy
and drug delivery. In fact, the biodistribution of chemi-
cally modified SWNTs injected into mice or rabbits was
studied recently, and the CNTs were reported to be cleared
rapidly with no evidence of toxicity [85,97,98]. CNT
purity is also absolutely crucial. Many CNT syntheses use
metal catalysts that are known to be toxic. Such impuri-
ties, and other carbonaceous impurities, must be removed
from the samples in order to reach conclusions about
inherent CNT toxicity, and it is not always clear from the
published reports that they have been removed. Finally,
many accounts of CNT toxicity have used MTT (3-(4,5-
dimethyl-2-thiazolyl)-2,5-diphenyl-2H-tetrazolium bro-
mide) as a reporter of cell viability, and it was recently
shown by Worle-Knirsch et al. that MTT itself binds to
CNTs (quenching its fluorescence) and thereby introduc-
ing uncertainty in this assessment of toxicity [65]. In sum-
mary, while the question of whether CNTs have long-term
toxicity in biomedical applications requires further
research, early reports raising the alarm of toxicity in
model cell culture systems have not been adequately veri-
fied.
Recently, our group reported that HiPco SWNTs, dis-
persed in a peptide solution or in media supplemented
with serum, were taken up by HeLa cells in a time- and
temperature-dependent fashion and did not affect the
HeLa cell growth rate, evidence that the SWNTs inside
cells were not toxic under these conditions [19]. This work
also demonstrated that our dispersion preparation proto-
col (involving probe sonication and multiple centrifuga-
tions) was effective in removing metals from the raw, as-
received SWNT-containing powder. Herein, we present
the characterizations of an as-received CoMoCAT SWNT-
containing powder using thermal gravimetric analysis
(TGA) and scanning electron microscopy (SEM), and of
SWNTs dispersed in Dulbecco's modified Eagle medium
(DMEM) supplemented with fetal bovine serum (FBS)
using atomic force microscopy (AFM), inductively cou-
pled plasma – mass spectrometry (ICP-MS), and absorp-
tion and Raman spectroscopies. The resulting purified
dispersions, termed DM-SWNTs, are next shown to have
no effect upon the morphologies and growth rates of
HeLa cells – a thoroughly characterized human epithelial-
like cell line. Using confocal microRaman spectroscopy, it
is shown that DM-SWNTs were taken up by cells in a time-
and temperature-dependent fashion. Evaluation of the
distribution of intracellular DM-SWNTs was performed
using transmission electron microscopy (TEM) which
revealed SWNT-like material in vacuoles. Finally, intracel-
lular superoxide dynamics of cells exposed to DM-SWNTs
were evaluated using fluorescence-based flow cytometry
and MitoSOX™ Red – a selective indicator of superoxide in
mitochondria. The MitoSOX™ Red fluorescence detected
from control cells was statistically similar to that observed
for cells incubated in DM-SWNT dispersions. The com-
bined results indicate that under our sample preparation
protocols and assay conditions, CoMoCAT DM-SWNTs
are not inherently cytotoxic to HeLa cells.
Results and Discussion
Characterizations of the as-received SWNT-containing
powder
Microscopic analyses
The CoMoCAT method of SWNT synthesis involves a
bimetallic Co-Mo catalyst supported on a silicon dioxide
substrate [99-103]. The purification procedure includes
removal of amorphous carbon by low-temperature oxida-
tion, removal of the SiO
2
substrate with HF, and removal
of metals by HCl. The final product, a SWNT-containing
powder, is rinsed with deionized water until its pH is neu-
tral [104]. Visible microscopic examination of the lot used
in this work revealed that the fine, black, fluffy powder
Journal of Nanobiotechnology 2007, 5:8 />Page 3 of 17
(page number not for citation purposes)
comprised irregularly shaped particles with dimensions
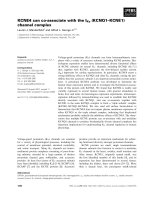
ranging from 5–50 µm. SEM revealed that the majority of
these particles comprised tightly entangled networks of
SWNTs, similar to those observed by Resasco and co-
workers [105], and that these networks comprised small
bundles of SWNTs with 5–20 nm diameters (Figure 1).
Thermal gravimetric analyses
TGA of the as-received SWNT-containing powder was per-
formed to assess the powder's composition with respect to
metals, SWNTs, and non-tubular carbon (NTC) species
such as amorphous carbons, fullerenes, carbides, graph-
itic nanoparticles, etc. TGA measurements of the SWNT-
containing powder were performed under the assumption
that upon heating to 1000°C in O
2
, all carbon and metals
were converted to their corresponding oxides, and that the
presence of other trace elements could introduce small
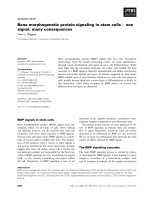
errors to calculated metal contents [106]. Figure 2 shows
the weight percent decrease as a function of temperature
(red trace) and the first derivative of the weight percent
curve (blue trace) for the as-received SWNT-containing
powder. The identities of the components corresponding
to the three main peaks observed in the derivative plot
were determined in experiments whereby the residues in
the TGA pan were recovered and analyzed by Raman spec-
troscopy and/or XPS before, during, and after peak onset.
In brief, peak 'a' at ~410°C was determined to comprise
SWNTs based on the appearance of a strong G-band – a
Raman resonance uniquely associated with SWNTs. The
oxidation temperature of the SWNTs ranged between
375–450°C and was consistent with the oxidation tem-
perature of CoMoCAT SWNTs observed by Resasco and
co-workers [105]. Peak 'b' at ~505°C was determined to
comprise NTCs based on the disappearance of the G-band
and an increase of the D-band – a Raman resonance
uniquely associated with miscellaneous forms of disor-
dered carbon. Peak 'c' at ~700°C, 9% weight loss, was
determined to comprise MoO
3
by XPS and was supported
by the ~700°C sublimation temperature of MoO
3
. XPS
experiments also ruled out the presence of residual SiO
2
in
the as-received SWNT-containing powder. The remaining
5% mass at 1000°C (Figure 2, red trace) was considered
to be oxidized metals of Co and Mo, most likely CoMoO
4
and MoO
2
. In summary, the oxidized SWNT-containing
powder was classified as comprising ~70% SWNTs, ~7%
NTC, and ~14% oxidized metals.
SEM image of the as-received CoMoCAT SWNT-containing powder on carbon black tape without a conductive coatingFigure 1
SEM image of the as-received CoMoCAT SWNT-containing powder on carbon black tape without a conductive coating.
Journal of Nanobiotechnology 2007, 5:8 />Page 4 of 17
(page number not for citation purposes)
Characterizations of SWNT dispersions
Absorption spectroscopy
SWNT dispersions were prepared using a sonication and
centrifugation protocol and DMEM supplemented with
5% FBS (DMEM/FBS). The resulting DM-SWNTs were
homogeneous in appearance and could be stored for 30 d
at 4°C before any SWNTs were observed to precipitate.
The final concentration of SWNTs in DMEM/FBS was esti-
mated to be ~50 µg/mL (Additional File 1) and SWNT
lengths were estimated to be 100–400 nm (Additional
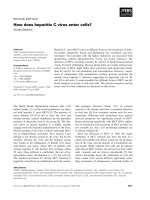
File 2). Figure 3 shows the absorption spectrum of a rep-
resentative DM-SWNT dispersion. The observed spectral
profiles of DM-SWNTs were similar to the spectra of
CoMoCAT SWNTs dispersed in sodium dodecyl sulfate
(SDS) as prepared by Resasco and co-workers [103] and
Stupp and co-workers [41], where the two predominant
semi-conducting SWNT types present were (6,5) and (7,5)
tubes with an average diameter of 0.8 nm. Specifically, the
DM-SWNT peak observed at ~569 nm corresponds to the
S
22
optical transition of (6,5) tubes, the shoulder observed
at ~587 nm corresponds to the S
22
optical transition of
(8,4) tubes, the peak observed at ~652 nm corresponds to
the S
22
optical transitions of (7,5) tubes at 644 nm and
(7,6) tubes at 647 nm, the broad peak at ~1011 nm corre-
sponds to S
11
optical transitions of (6,5) tubes at 975 nm
and (7,5) tubes at 1025, and the peak at ~1120 nm corre-
sponds to the S
11
optical transitions of (8,4) tubes at 1113
nm and (7,6) tubes at 1122 nm, which are all in accord-
ance with spectroscopic assignments by Bachilo et al.
[102]. In summary, the data indicate that CoMoCAT
SWNTs dispersed in media supplemented with serum
retain their optical transitions between van Hove singular-
ities in the electronic density of states.
Raman spectroscopy
Confocal microRaman spectrometer acquisition methods
and the interpretation of the Raman spectra of various
SWNT dispersions prepared using our sonication and cen-
trifugation protocol have been detailed previously
[19,45,47,49]. A representative Raman spectrum for a
DM-SWNT dispersion is shown in Figure 4 (blue spec-
trum; DMEM + 5% FBS). The spectrum clearly shows a
number of well characterized SWNT resonances
[100,107,108], in particular, two predominant radial
breathing modes at ~281 and ~301 cm
-1
, the D-band at
~1303 cm
-1
, and the G-band in the 1550–1610 cm
-1
region. Control spectra of DMEM/FBS without SWNTs did
not display detectable resonances under these operating
conditions (data not shown). Spectrometer stability was
assessed by monitoring the reproducibility of the G-band
peak intensity at ~1590 cm
-1
since it is the most promi-
nent Raman peak indicative of intrinsic SWNT features
[109]. In brief, the relative standard deviation (RSD) of G-
band peak intensities acquired from the same region of a
SWNT dispersion was <1%, the RSD of G-band peak
intensities acquired from four different regions of a SWNT
dispersion was <10%, and the correlation coefficient for
the linear relationship between the G-band peak intensity
and relative SWNT concentration was 0.982 (Figures S3-
S5 in Additional File 3). In summary, the data indicates
that the FBS components coating the SWNTs did not sig-
nificantly affect the G-band profile of SWNTs dispersed in
Background-corrected absorption spectrum of a CoMoCAT DM-SWNT dispersion prepared using a 10-min probe soni-cation and two 2-min centrifugationsFigure 3
Background-corrected absorption spectrum of a CoMoCAT
DM-SWNT dispersion prepared using a 10-min probe soni-
cation and two 2-min centrifugations. The two main semi-
conducting SWNT structures are denoted by their rollup
vector integers (n, m), and the two absorptions at ~460 and
~515 nm represent metallic (6, 6) and (7, 7) nanotubes,
respectively. The sharp feature at 861 nm is due to a grating
and detector change associated with the spectrometer.
0.15
0.20
0.25
0.30
0.35
0.40
0.45
425 525 625 725 825 925 1025 1125 1225 1325
Wavelength (nm)
Absorbance
(6,5)
(7,5)
(7,5)
(6,5)
Weight percent and derivative of weight percent curves for the thermal gravimetric analysis of the as-received CoMo-CAT SWNT-containing powder in oxygenFigure 2
Weight percent and derivative of weight percent curves for
the thermal gravimetric analysis of the as-received CoMo-
CAT SWNT-containing powder in oxygen.
a
bc
Journal of Nanobiotechnology 2007, 5:8 />Page 5 of 17
(page number not for citation purposes)
this fashion, which is in agreement with previous reports
using non-covalently modified SWNTs dispersed in aque-
ous solutions of peptides [19,41,45] and proteins [53,62].
While a variety of cell types have been cultured in pristine
or functionalized CNTs solubilized in various growth
media formulations [19,43,65-72], only a few of these
reports have emphasized the important role that the
added serum plays. The importance of FBS in dispersing
SWNTs is evident in the series of Raman spectra shown in
Figure 4. In brief, DMEM comprises inorganic salts, amino
acids, buffers, vitamins, and minerals with the three major
components being glucose (4500 mg/L), sodium bicarbo-
nate (3700 mg/L), and sodium chloride (6400 mg/L). FBS
is also a multi-component mixture comprising many low
and high molecular weight substances. The major dis-
solved substances are proteins, lipids, steroid hormones,
minerals, and metabolites. The most notable FBS compo-
nents known to solubilize CNTs are BSA and phospholip-
ids [10,53,58]. Using our sonication and centrifugation
procedure, DMEM without FBS did not support SWNT
dispersion as observed by the lack of detectable SWNT
Raman resonances (Figure 4; gold spectrum). Conversely,
aqueous 5% FBS solutions (without DMEM) were quite
effective in dispersing SWNTs (Figure 4; red spectrum).
ICP-MS analyses
Previous elemental analyses of peptide-coated SWNT dis-
persions prepared using our sonication and centrifugation
protocol revealed only trace amounts of metal catalysts
even though the as-received HiPco SWNT-containing
powder contained ~32% metals by weight [19]. Herein,
we further characterize this protocol's ability to effectively
remove toxic materials by analyzing CoMoCAT DM-
SWNT dispersions. CoMoCAT SWNTs are made from a
process that uses Co and Mo as catalysts rather than Fe,
and thus, exposing CoMoCAT SWNTs to cells avoids the
known cellular toxicity that Fe can impact to a CNT prep-
aration [66,70]. The ICP-MS analyses of DM-SWNT dis-
persions revealed 6.64 ppm Mo and 1.55 ppm Co, and
that the only Fe in our DM-SWNT dispersions was from
the 0.10 ppm ferric nitrate in DMEM. For comparative
purposes in the absence of EC50 values for dispersed
SWNTs, the metal levels observed in the DM-SWNT dis-
persions were well below the 90 ppm EC50 of mamma-
lian stem cells exposed to 30-nm MoO
3
particles (as
determined by MTS assays) [110], and the 19 ppm EC50
of murine fibroblasts exposed to Co (as determined by
MTT assays) [111]. Since >99% of the Mo and Co present
in the as-received SWNT-containing powder was not
detected in the DM-SWNT dispersions (relative to oxi-
dized metal levels from the TGA of the SWNT-containing
powder), these data again demonstrate that our sonica-
tion and centrifugation protocol is an effective method for
removing the heavier metal-containing SWNTs and bun-
dles. Such results are important to note since it has not
been made clear in all previous published reports of cells
being exposed to CNTs if such metal-removing measures
were implemented before the CNT cytotoxicity was
assessed.
DM-SWNTs were additionally analyzed for the presence
of Ti since it is possible that this metal could be intro-
duced through the use of Ti-coated probe sonicator tips.
ICP-MS analyses of DM-SWNT dispersions prepared using
a probe tip that had been used for >20 non-continuous
hours revealed 0.15 ppm Ti. For comparison, this level is
well below the 250 ppm EC50 of rat liver cells exposed to
40-nm TiO
2
particles (as determined by MTT assays)
[112]. To our knowledge, this is the first report of such an
analysis amongst the previous reports of cells exposed to
SWNT dispersions prepared using probe tip sonication.
The uptake of DM-SWNTs by living cells
The main analytical approaches for assessing the presence
of CNTs in cells and tissue have been optical
[1,14,65,67,72,83,88,90,93,113], electron
[11,15,17,37,68-70,89,114], and fluorescence [10,12-
14,16,18,43,64,82,84,86] microscopies. While optical
microscopy is ideally suited for live-cell analyses, this
label-free technique lacks the specificity to unambigu-
ously identify material observed in cells as CNTs. Electron
microscopy offers high spatial resolution imaging of
CNTs but is limited to slices of cells that have been fixed;
multi-walled CNTs can be unmistakably identified in cells
with this technique. In live-cell fluorescence microscopy,
the detection of CNTs is indirect (i.e., it is through the
detection of a visible fluorescent dye that is (non)cova-
lently attached to the CNT or to molecules coating the
CNT). Recently, direct and label-free mapping of CNTs
inside living cells has been demonstrated using the intrin-
Raman spectra acquired from CoMoCAT SWNT dispersions (10-min probe sonication and two 2-min centrifugations) prepared in various solutions (water or DMEM ± FBS); all spectra were normalized to the same intensity scaleFigure 4
Raman spectra acquired from CoMoCAT SWNT dispersions
(10-min probe sonication and two 2-min centrifugations)
prepared in various solutions (water or DMEM ± FBS); all
spectra were normalized to the same intensity scale.
2000
1000
0
250 300 350
1300 1400 1500 1600
Water (5% FBS)
DMEM (5% FBS)
Intensity (a.u.)
DMEM (0% FBS)
Wavenumber (cm-1)
Journal of Nanobiotechnology 2007, 5:8 />Page 6 of 17
(page number not for citation purposes)
sic near-infrared fluorescence [7,9,81] or Raman scatter-
ing [9] of CNTs themselves.
Confocal microRaman spectroscopy of HeLa cells
Herein, the presence of CoMoCAT G-band intensities
emanating from inside living cells incubated in DM-
SWNT dispersions was evaluated using confocal micro-
Raman spectroscopy. In the first series of experiments,
cells were incubated in DM-SWNT dispersions for 60 h at
37°C. A representative transmitted white-light image of a
single HeLa cell acquired through the Raman microscope
is shown in Figure 5. Typical HeLa cells were observed to
possess 10–30-µm widths and 40–70-µm lengths. The rel-
atively large dimensions of HeLa cells, coupled with the 4-
µm lateral resolution of the confocal microscope system,
permitted Raman spectra to be acquired from distinct cel-
lular regions [19]. For example, Figure 5 shows Raman
spectra acquired from a cell that was incubated in a DM-
SWNT dispersion. Intense G-band signals were observed
from both cytoplasmic (Figure 5A) and nuclear (Figure
5B) regions. In the latter case, it should not be implied
that SWNTs are in the nucleus because the detected G-
band resonances could emanate from SWNTs located in
the perinuclear region and/or in the cytoplasm immedi-
ately above or below the nucleus. Finally, control cells
incubated in DMEM/FBS (without DM-SWNTs) had no
detectable SWNT Raman signatures under these condi-
tions (data not shown), and no SWNT resonances were
detected from cell-free regions of the dish adjacent (≤5
µm) to cells (Figures 5A and 5B, dark blue spectra).
If the intense G-band signals emanated from DM-SWNTs
inside cells, most likely the result of an active uptake proc-
ess such as endocytosis, then the signals should be absent
in cells exposed to DM-SWNTs at 4°C where energy-
dependent uptake practically ceases. Figure 6 shows repre-
sentative Raman spectra acquired from HeLa cells incu-
bated in a DM-SWNT dispersion at 4°C. The peaks
detected at ~1608 and 1651 cm
-1
in the spectrum acquired
from the cytoplasm are presumed to emanate from pro-
teinaceous material, as denoted by the amide-I band at
1650–1659 cm
-1
[115-117]. More importantly, the G-
band intensities at ~1590 cm
-1
recorded from cytoplasmic
and nuclear regions were 99.9% less than those recorded
from cells incubated at 37°C (Figure 5). In summary, the
lack of detectable G-band signals from HeLa cells incu-
bated in DM-SWNT dispersion at 4°C indicates that HeLa
cells do not uptake detectable levels of DM-SWNTs when
their metabolic activity is low. In addition, the lack of G-
band signals from cells incubated at 4°C indicates that
there was negligible nonspecific adherence of SWNTs to
HeLa cells (i.e., the rinsing procedures were sufficient to
remove DM-SWNTs that were on the exterior surface of
the plasma membrane).
Temporal evaluation of DM-SWNT uptake by HeLa cells
In another series of experiments, the time-dependence of
DM-SWNT uptake was evaluated. First, the heterogeneous
distribution of DM-SWNTs was taken into consideration.
As shown in Figure 5, the G-band intensities detected
from the cytoplasm ranged from 20 to 500 a.u. and those
for the nuclear region ranged from 10 to 350 a.u. It was
therefore decided to perform all time-dependent studies
with the Raman laser focused on the center of a cell's
nuclear region. This selection was influenced by our pre-
vious observations of SWNT accumulation around the
nuclear region as revealed through confocal fluorescence
imaging of HeLa cells exposed to SWNTs dispersed with a
fluorescent-labeled peptide [118], and by Strano and co-
workers through Raman spectral mapping of 3T3 cells
exposed to SWNTs dispersed with DNA [9]. Figure 7
shows Raman spectra from HeLa cells that were incubated
Raman spectra acquired from cytoplasmic (A) and nuclear (B) regions of the same live HeLa cell that was incubated at 37°C for 60 h in a CoMoCAT DM-SWNT dispersionFigure 5
Raman spectra acquired from cytoplasmic (A) and nuclear
(B) regions of the same live HeLa cell that was incubated at
37°C for 60 h in a CoMoCAT DM-SWNT dispersion. The
colored arrows in the optical micrographs denote the spe-
cific regions of the HeLa cell where spectra were acquired;
spectra were also acquired from cell-free regions of the cul-
ture dish ~5 µm away from the nearest cell (dark-blue
arrows). All spectra were normalized to the same intensity
scale.
400
200
0
Intensity (a.u.)
1450 1500 1550 1600
Wavenumber (cm-1)
20
ȝ
m
B
400
200
0
Intensity (a.u.)
1450 1500 1550 1600
Wavenumber (cm-1)
20
ȝ
m
A
Journal of Nanobiotechnology 2007, 5:8 />Page 7 of 17
(page number not for citation purposes)
at 37°C in DM-SWNT dispersions for 12, 24, 36, 48, and
60 h. In all cases, the number of cells displaying detectable
G-band signals increased as the DM-SWNT incubation
time increased. Typically, the G-band intensities acquired
from HeLa cells incubated in DM-SWNTs for 60 h was
90% greater than those detected at 12 h. Specifically,
<10% of the cells analyzed after 12 h incubation displayed
detectable G-band signals, while >90% of cells analyzed
after 60 h displayed significant G-band signals (n = 40
cells analyzed). In summary, the combined Raman evi-
dence indicated that the observed G-band intensities ema-
nate from DM-SWNTs inside HeLa cells, and that the
uptake of DM-SWNTs by HeLa cells is a time- and temper-
ature-dependent process. While complete elucidation of
the mechanism(s) of SWNT uptake by cells still requires
further investigation, our results are consistent with the
work of Dai and co-workers [12] and Cherukuri et al. [81]
who have demonstrated that CNTs are transported inside
cells via a temperature-dependent mechanism, and con-
trast the work of Bianco and co-workers who provide evi-
dence that CNT uptake follows a temperature- and
endocytosis-independent mechanism [14,37,43].
The intracellular distribution of DM-SWNTs
TEM was used to examine the intracellular distribution of
DM-SWNTs. Figures 8 and 9 show electron micrographs
of HeLa cells incubated at 37°C for 60 h in DMEM/FBS
(no SWNTs) or DM-SWNT dispersions, respectively.
Colored arrows are used to denote the nucleolus and
nucleus, vacuoles/vesicles, Golgi bodies, and mitochon-
dria. In addition, it is important to note that all micro-
graphs shown in Figures 8 and 9 were acquired from cells
sliced in the plane of the nucleolus, as denoted by the low-
magnification micrograph shown in Figure 8A. The first
observation from the comparison of control and DM-
SWNT treated cells was the lack of any SWNT-like struc-
tures visible in or associated with Golgi bodies (compare
Figure 8C with 9E) and mitochondria (compare Figures
8D,E with 9B). The most striking observations between
control (n = 8) and DM-SWNT treated (n = 10) cells was
the appearance of dense black aggregated material in the
cytoplasmic vacuoles of the DM-SWNT treated cells (Fig-
ures 9A–D) that was not observed in control cell vacuoles
(Figures 8D–F). In the highest magnification view of these
material-filled vacuoles (Figure 9D), the observed mate-
rial displays black features with 5–20 nm diameters and
apparent lengths of 50–300 nm, which is similar to the
dimensions of CoMoCAT SWNTs in our dispersions. Such
observations are consistent with those of Dai and co-
workers who used confocal fluorescence microscopy to
image the co-localization of SWNTs coated with a dye
conjugate of avidin and the fluorescent endocytosis
marker FM 4–64 [12,13].
Conclusive evidence of SWNT-like structures in the
nucleus was not observed (compare Figures 8A–E to Fig-
ures 9A,B,C,F). This is important to note since there is
presently no consensus regarding the ability of SWNTs to
enter the cellular nucleus or the mechanism for their
entry. For example, data that SWNTs have crossed the
nuclear membrane has been presented by Bianco and co-
Representative Raman spectra acquired from five different live HeLa cells that were incubated at 37°C in CoMoCAT DM-SWNT dispersions for 12, 24, 36, 48, and 60 hFigure 7
Representative Raman spectra acquired from five different
live HeLa cells that were incubated at 37°C in CoMoCAT
DM-SWNT dispersions for 12, 24, 36, 48, and 60 h. All spec-
tra were normalized to the same intensity scale. The G-band
intensities increased in a linear fashion (R
2
= 0.932) over the
course of 12–60 h (n = 8 cells analyzed at each time point).
Intensity (a.u.)
-100
100
300
500
700
900
1100
1300
1500
1450 1500 1550 1600 1650
60 h
48 h
36 h
24 h
12 h
Wavenumber (cm-1)
Raman spectra acquired from live HeLa cells incubated at 4°C in a CoMoCAT DM-SWNT dispersion; both spectra were normalized to the same intensity scale as that in Figure 5Figure 6
Raman spectra acquired from live HeLa cells incubated at
4°C in a CoMoCAT DM-SWNT dispersion; both spectra
were normalized to the same intensity scale as that in Figure
5.
400
200
0
Intensity (a.u.)
1400 1500 1600
Wavenumber (cm-1)
Cytoplasm
Nuclear region
-1590
-1608
-1651
Journal of Nanobiotechnology 2007, 5:8 />Page 8 of 17
(page number not for citation purposes)
workers using TEM and 300–1000-nm long peptide func-
tionalized multi-walled CNTs [15], and Lu et al. using
radioactive labels and ~400-nm long RNA-modified
SWNTs [18]. In contrast, Strano and co-workers used con-
focal Raman imaging to observe DNA-coated SWNTs in
the perinuclear zone of 3T3 cells, but not in the nuclear
envelope [9]. In summary, amongst reports presenting
high-resolution TEM images of cultured cells and tissue
exposed to CNTs [11,15,17,37,68-70,89,114], it is appar-
ent that large multi-walled CNTs can be unmistakably
identified in cells by visual observation. The situation is
more difficult when cells have been exposed to SWNTs. In
most cases, the purported SWNT material appears as a sin-
gle, dense black mass of material and there are few struc-
tural features observable on-scale with the expected
diameters of individual/bundled SWNTs (± coatings). In
fact, when SWNTs have been observed to be densely inter-
nalized in cell vacuoles [69], there are no observable dif-
ferences between those TEM images and TEM images of
cells exposed to fullerenes, which also display vacuoles
densely filled with black material [119]. Clearly, the
development of complementary analyses capable of iden-
tifying SWNT and NTC species in such images is war-
ranted.
TEM micrographs of control HeLa cells that were incubated for 60 h at 37°C in DMEM/FBS (no DM-SWNTs)Figure 8
TEM micrographs of control HeLa cells that were incubated for 60 h at 37°C in DMEM/FBS (no DM-SWNTs). All slices were
treated with uranyl acetate to stain membranes and lead citrate to stain the nuclear body. Colored arrows represent selected
cell organelles: nuclei (red), mitochondria (green), Golgi bodies (yellow), vacuoles (blue), and the nucleolus (pink). Micrographs
were normalized to the same grayscale as those in Figure 9.
E
100 nm
F
100 nm
D
100 nm
A
1
ȝ
m
B
1
ȝ
m
C
200 nm
Journal of Nanobiotechnology 2007, 5:8 />Page 9 of 17
(page number not for citation purposes)
Cell growth studies
A crucial question amongst reports concerning the adher-
ence and/or uptake of CNTs by cultured cells [1,7,9-
18,37,43,65-73,75,77,78,81-84,86,88,91-94,113,114] is
whether CNTs are toxic. Previously, we observed that the
growth rates of HeLa cells incubated for 4 d in ~100 µg/
mL HiPco SWNTs dispersed in a peptide solution or in
media supplemented with serum were statistically similar
to controls [19]. The evaluation of CoMoCAT DM-SWNTs
also involved monitoring growth rates over the course of
4 d. First, there were no discernable differences in the
morphologies of HeLa cells incubated in DM-SWNTs for
60 h (Figures 5 and 10B) relative to controls (Figure 10A;
cells incubated in DMEM/FBS). Next, the growth rates of
HeLa cells continuously exposed to DM-SWNTs were
quantitated by calculating population double times
(PDTs). A PDT is a measure of cell numbers at the early
log growth phase and is used for comparisons of normal
cell growth. PDTs were obtained from the slopes of the
lines of a plot of the natural log of cell numbers versus
time [120]. Figure 11 shows such a plot over a time period
of 4 d for cells cultured in DM-SWNTs and control cells
(DMEM/FBS only). For both samples, the respective
number of HeLa cells counted on days 1, 2, 3, and 4 were
statistically similar at a 95% confidence level. The control
HeLa cell PDT was 27 h and was statistically similar to the
TEM micrographs of HeLa cells that were incubated for 60 h at 37°C in CoMoCAT DM-SWNTsFigure 9
TEM micrographs of HeLa cells that were incubated for 60 h at 37°C in CoMoCAT DM-SWNTs. All slices were treated with
uranyl acetate to stain membranes and lead citrate to stain the nuclear body. Colored arrows represent selected cell
organelles: nuclei (red), mitochondria (green), Golgi bodies (yellow), and vacuoles (blue). Micrographs were normalized to the
same grayscale as those in Figure 8.
A
1
ȝ
m
B
500 nm
C
300 nm
F
100 nm
E
200 nm
D
300 nm
Journal of Nanobiotechnology 2007, 5:8 />Page 10 of 17
(page number not for citation purposes)
PDT of 29 h observed with HeLa cells cultured in DM-
SWNTs. In summary, the data from this sensitive test
argue that our preparations and concentrations of purified
CoMoCAT DM-SWNT dispersions do not affect HeLa cell
growth rates.
Intracellular superoxide dynamics of HeLa cells incubated
in DM-SWNTs
As recommended by Worle-Knirsch et al., the presenta-
tion of CNT cytotoxicity results should include at least two
or more independent test systems [65]. Therefore, in con-
junction with morphology and growth rate studies, fluo-
rescence-based flow cytometry was utilized to investigate
whether the uptake of DM-SWNTs by HeLa cells increased
the production of reactive oxygen species (ROS). In these
series of experiments, HeLa cells were incubated in DM-
SWNT dispersions and incubated with MitoSOX™ Red – a
novel fluorescent indicator for the selective measurement
of superoxide (O
2
•-
) production in cells [121-123].
MitoSOX™ Red is a non-fluorescent, cell permeable dye
that forms a highly fluorescent product upon oxidation.
Owing to its lipophilic triphenyl phosphonium cation,
MitoSOX™ Red is selectively targeted to mitochondria –
the major source of ROS in cells – where it can be oxidized
by superoxide before exhibiting red fluorescence upon
binding to nucleic acids [123].
In each fluorescence-based flow cytometry experiment, six
different cell samples/controls were prepared and ana-
lyzed in triplicate with each individual trial representing
the analysis of thousands of cells. Fluorescence micros-
copy was also used to validate that MitoSOX™ Red was
distributed throughout the cytoplasms of cells, and that
negligible dye leaked from the cells (data not shown). The
first two flow cytometry control experiments involved
measuring responses of cells incubated in DMEM/FBS
without MitoSOX™ Red (± DM-SWNTs). These dye-free
controls were prepared to establish background fluores-
cence levels of unstained HeLa cells (± DM-SWNTs) and
are represented in the plot of events vs. MitoSOX™ Red flu-
orescence intensities as shown in Figures 12A &12B (and
Figures S6A&B in Additional File 4). The means and
standard deviations of fluorescence intensities from these
two control experiments without MitoSOX™ Red were
3.07 ± 0.15 and 2.40 ± 0.44 a.u. for DMEM/FBS and DM-
Growth curves for living HeLa cells incubated at 37°C for 4 d in DMEM/FBS or DM-SWNTsFigure 11
Growth curves for living HeLa cells incubated at 37°C for 4 d
in DMEM/FBS or DM-SWNTs. The final concentration of
SWNTs in DMEM/FBS was estimated to be ~50 µg/mL
(Additional File 1) and SWNT lengths were estimated to be
100–400 nm (Additional File 2).
9.6
10.0
10.4
10.8
11.2
11.6
01234
Time (days)
Ln (cell numbers)
DMEM / FBS
DM-SWNTs
Representative differential image contrast (DIC) images of live HeLa cells incubated for 60 h at 37°C in DMEM/FBS (A) or CoMoCAT DM-SWNTs (B)Figure 10
Representative differential image contrast (DIC) images of
live HeLa cells incubated for 60 h at 37°C in DMEM/FBS (A)
or CoMoCAT DM-SWNTs (B).
B
A
30 ȝm
30 ȝm
Journal of Nanobiotechnology 2007, 5:8 />Page 11 of 17
(page number not for citation purposes)
SWNT treated cells, respectively. Next, since it has recently
been reported that binding of fluorescent viability dyes to
CNTs can add uncertainty to cytotoxicity assessments
[65], our series of experiments also included a compari-
son of responses from positive controls ± DM-SWNTs.
Specifically, the responses of cells loaded with MitoSOX™
Red and exposed to 5 µmoles hydrogen peroxide were
analyzed in the presence and absence of DM-SWNTs
(Additional File 4; Figures S7A and S7B respectively). Both
samples possessed statistically-similar fluorescence inten-
sities indicating that SWNT quenching of the MitoSOX™
Red fluorescence was minimal.
Figures 12C &12D (and Figures S6C&D in Additional File
4) show representative responses of cells loaded with
MitoSOX™ Red and incubated either in a DMEM/FBS con-
trol (no SWNTs) or in a DM-SWNT dispersion. The means
and standard deviations of fluorescence intensities from
these two experiments (51.0 ± 24.2 and 47.3 ± 22.1 a.u.
for DMEM/FBS controls and DM-SWNT treated cells,
respectively) were statistically similar. For comparison,
the mean fluorescence intensities from the positive con-
trol shown in Figure 12E (and Figure S6E in Additional
File 4) was ~7-fold greater (343 ± 101 a.u.). These results
are akin to the results of Shvedova and co-workers who
observed interesting relationships between the metal con-
tent of SWNTs and the iron-induced intracellular produc-
tion of ROS. In brief, SWNTs containing 26.0 wt% Fe
stimulated significant production of hydroxyl radicals by
RAW 264.7 macrophages (vs. purified SWNTs containing
0.23 wt % Fe as detected by electron paramagnetic reso-
nance spin-trapping assays), while fluorescence analyses
with dihydroethidium incubated macrophages revealed
similar superoxide and nitric oxides levels for both cells
exposed to the Fe-containing SWNTs or purified SWNTs
[66]. Nonetheless, while superoxide is just one of many
potential reactive oxygen and nitrogen species, and while
Co, Mo, Ti, and Fe are just four types of potential metal
impurities, these data suggest that our preparations and
concentrations of purified DM-SWNTs do not increase the
concentrations of mitochondrial superoxide in HeLa cells
under these culture conditions.
Conclusion
Herein, CoMoCAT SWNT-containing powders and DM-
SWNT dispersions were characterized using AFM, ICP-MS,
SEM, TGA, and absorption and Raman spectroscopies.
Confocal micoRaman spectroscopy was utilized to deter-
mine that DM-SWNTs entered HeLa cells in a time- and
temperature-dependent fashion. TEM revealed SWNT-like
material in intracellular vacuoles. Flow cytometry showed
that the fluorescence from MitoSOX™ Red, a selective
indicator of superoxide in mitochondria, in control cells
was statistically similar to that observed for cells incu-
bated in DM-SWNTs. The morphologies and growth rates
of HeLa cells exposed to DM-SWNTs were statistically
similar to control cells over the course of 4 d. The com-
bined results indicate that, using our sample preparation
protocols (i.e., probe tip sonication followed by two cen-
trifugations), and under our assay conditions (i.e., SWNT
types, coatings, dimensions, concentrations, impurity
types and amounts, and cellular exposure times), CoMo-
CAT DM-SWNT dispersions are not inherently cytotoxic
to HeLa cells. Finally, the importance of thoroughly char-
acterizing CNT materials before offering a CNT cytotoxic-
ity assessment can not be over emphasized. We support
the development of (i) standardized CNT sample prepara-
tion protocols, reference materials, and characterization
methodologies, (ii) standardized methods for assessing
whether CNTs are taken up by and/or adsorbed to cells,
and (iii) a series of proven cell vitality assay conditions.
Such measures are imperative to improve the accuracy and
comparability of CNT cytotoxicity reports.
Methods
Media and solutions
Dulbecco's modified Eagle medium (DMEM) was pur-
chased from Irvine Scientific and was supplemented with
3700 mg/L sodium bicarbonate, 1% (v/v) penicillin,
streptomycin, and amphotericin B (Sigma-Aldrich). Fetal
bovine serum (FBS) was obtained from HyClone. Phos-
phate buffered saline (PBS; 8 mM phosphate, 150 mM
NaCl, pH = 7.4) was sterilized by autoclaving at 120°C for
0.5 h. Deionized water (18.3 MΩ-cm) was obtained using
Flow cytometry analysis of intracellular MitoSOX™ Red flu-orescence from live HeLa cells incubated at 37°C for 60 h in: (A) DMEM/FBS, (B) CoMoCAT DM-SWNTs, (C) DMEM/FBS + MitoSOX™ Red, (D) DM-SWNTs + MitoSOX™ Red, and (E) DMEM/FBS + MitoSOX™ Red + H
2
O
2
Figure 12
Flow cytometry analysis of intracellular MitoSOX™ Red flu-
orescence from live HeLa cells incubated at 37°C for 60 h in:
(A) DMEM/FBS, (B) CoMoCAT DM-SWNTs, (C) DMEM/
FBS + MitoSOX™ Red, (D) DM-SWNTs + MitoSOX™ Red,
and (E) DMEM/FBS + MitoSOX™ Red + H
2
O
2
. The x-axis
denotes the MitoSOX™ Red fluorescence detected in the
564–606 nm spectral region and the y-axis denotes the
number of events recorded for each analysis.
A
B
C
D
E
MitoSOX™ Red Fluorescence Intensity
Events
Journal of Nanobiotechnology 2007, 5:8 />Page 12 of 17
(page number not for citation purposes)
a Nanopure Infinity water purification system (Barn-
stead). All other chemicals were of the highest quality
available and were used as received.
SWNT dispersions
All dispersions were prepared with CoMoCAT SWNTs
(Product No. SP95-02-dry, Lot No. UT3-A001; SouthWest
NanoTechnologies Inc.). The preparation of DM-SWNTs
(i.e., SWNTs dispersed in DMEM supplemented with 5%
(v/v) FBS (i.e., DMEM/FBS)) used a sonication/centrifuga-
tion protocol identical to that previously described by
Chin et al. except that the centrifugation times were
reduced [19]. Specifically, 1.0 mg of the as-received
SWNT-containing powder was dispensed into an Eppen-
dorf tube containing 1.0 mL of DMEM/FBS, vortexed for
~1 min, and probe sonicated for 10 min at 0°C. Probe-
sonication was performed using a Branson 250 Sonifier,
and the 2 mm diameter probe tip was placed one-third of
the distance below the surface of the 1 mL suspension.
The resulting black suspension was centrifuged in an
Eppendorf 5417C centrifuge for 2 min at 16,000 g
(14,000 RPM). The upper 75% of the supernatant was
recovered without disturbing the sediment and placed in
a clean tube before a second 2 min centrifugation at
16,000 g was performed. The upper 75% of the second
supernatant was carefully recovered to afford a DM-SWNT
dispersion. The preparation of aqueous dispersions in
0.15% (v/v) sodium dodecyl sulfate (SDS-SWNTs), 0.1%
(v/v) TritonX-100 (TrX-SWNTs), or 5% (v/v) FBS (FBS-
SWNTs) was identical to that described above except that
DMEM/FBS was replaced by the corresponding surfactant
or serum.
Scanning electron microscopy
SEM was performed at 10 kV with a Zeiss-LEO Model
1530 variable pressure field effect scanning electron
microscope. Samples of the as-received SWNT-containing
powder were placed on a SEM mount with carbon black
tape and analyzed without a conductive coating.
Thermal gravimetric analysis
TGA was performed with a Perkin Elmer Pyris-1 thermal
gravimetric analyzer equipped with a high temperature
furnace and sample thermocouple. Samples (n = 3) of the
as-received SWNT-containing powder were dried in air for
6 h at 100°C before being transferred into the platinum
pan of the analyzer. The samples were heated from room
temperature to 1000°C at 5°C/min in >99.9% O
2
using a
flow rate of 20 mL/min. A baseline was generated for each
scan and baseline-subtracted thermograms were con-
verted to weight percents. Thermal oxidation tempera-
tures were identified by the peaks from the derivative of
weight percent curve. Triplicate analyses yielded oxidation
temperatures with a reproducibility of ± 2°C. The deter-
mination of a component's mass was performed by sub-
tracting the weight percent lost between peak onset and
end. In the case where two peaks overlapped (Figure 2,
peaks 'a' and 'b'), the weight percent lost for the non-over-
lapping half of each peak was calculated and doubled.
Validation of this approach was performed through a
Gaussian peak fitting routine to determine the weight per-
cent loss (i.e., the peak area) of each component; the
reported masses from the two methods matched within ±
1%. The total mass of oxidized metal was reported as the
sum of the mass from MoO
3
(peak 'c') and the mass
remaining at 1000°C. Triplicate analyses demonstrated
mass accuracies of ± 0.2%. The initial weight loss ≤300°C
was ~5%. While additional error could be attributed to
weight gain by the oxidation of metals, the major source
of error in reported weight percentages emanated from the
fitting of peaks with components displaying overlapping
oxidation temperatures.
Absorption spectroscopy
The absorption spectra of DM-SWNTs were acquired
using a dual-beam Perkin Elmer Lambda 900 UV-VIS-NIR
spectrophotometer and were background-corrected using
DMEM/FBS. Scans were performed from 400–861 nm
with a scan speed of 125.00 nm/min and a 0.44-s integra-
tion time and from 861–1350 nm with a scan speed of
125.00 nm/min and a 0.48-s integration time. The instru-
ment was wavelength calibrated on a quarterly basis using
Holmium standards.
Elemental analysis
Elemental analysis was performed using a ThermoElec-
tron X-Series inductively coupled plasma mass spectrom-
eter. Samples (100 µL of DMEM/FBS or DM-SWNTs) were
acid digested using a protocol developed in association
with PreciLab Inc. (Addison, TX). In brief, a solution of 25
µL of 37% HCl and 25 µL of 69% HNO
3
was added to
samples which were bath ultrasonicated for 20 min. Next,
the samples were diluted with a 2% HNO
3
blank to a total
volume of 10 mL. All samples and standard solutions
were sprayed into flowing argon and passed into the torch
which was inductively heated to ~10,000°C. Ti and Co
were calibrated using blank, 50-, 100-, and 250-ppt stand-
ard solutions, Mo was calibrated using blank, 250-, 1000-
, and 5000-ppt standard solutions, and Fe was calibrated
using blank, 0.25-, 1.0- and 5.0-ppb standard solutions.
Primary cell culture
Human epithelial-like HeLa cells were obtained from the
American Type Culture Collection and were cultured in
100 mm diameter polystyrene tissue culture dishes
(Sarstedt) in DMEM/FBS containing 15 mg/L phenol red
in an incubator at 37°C with 90% air and 10% CO
2
. Asep-
tic conditions were maintained at all times and media was
changed every 2 d. Cells were passaged 1:10 every 4 d
upon achieving ~80% confluence.
Journal of Nanobiotechnology 2007, 5:8 />Page 13 of 17
(page number not for citation purposes)
Population doubling time assays
HeLa cells were plated into standard 24-well plates (~1 ×
10
4
cells/well; ~20% coverage) in DMEM/FBS (buffered
with 10 mM HEPES; no bicarbonate) and incubated in air
at 37°C. After 24 h, the media was removed and replaced
by a 400-µL aliquot of freshly prepared DM-SWNTs or
fresh media (control). Each group of cells was incubated
further in air at 37°C for 1–4 d. On each day, some HeLa
cells were washed twice with 400 µL of sterile PBS and har-
vested with 100 µL of trypsin-EDTA solution (Irvine Sci-
entific) for Coulter cell counting. Population doubling
times (PDTs) were determined using the equation PDT =
ln (N/N
o
)/t, where N
o
represents the initial cell number, N
represents the final cell number, and t represents the time
interval between N
o
and N [120]. Each group of cells was
analyzed in triplicate; one-way ANOVA statistical analyses
were performed at the 95% confidence level, where p <
0.05 was considered significant. Differential image con-
trast (DIC) images were acquired using a Nikon TE 2000-
U inverted microscope and a 60×/1.4 NA APO-Plan oil-
immersion objective.
Confocal microRaman spectroscopy
All Raman spectra acquisition and sample preparation
methods were similar to those described previously by
Chin et al. [19]. Spectra were acquired utilizing a Horiba
Jobin Yvon high-resolution LabRam Raman microscope
system equipped with a 250-µm entrance slit and a 400-
µm pinhole. The 633-nm laser excitation was provided by
a Spectra-Physics model 127 helium-neon laser operating
at 20 mW. The power density emanating from the 50×/0.5
NA LM-Plan objective was typically 3.4 mW as measured
using a Newport model-1815C power meter with an 818
UV series photodetector. Wavenumber calibration was
performed using the 520.5 cm
-1
line of a silicon wafer; the
spectral resolution was ~1 cm
-1
.
Raman spectra of SWNT dispersions were acquired by
placing them into 35 mm polylysine-coated glass bottom
"imaging" dishes (MatTek). The acquisition time for a
250-cm
-1
spectral region was 10 s with a scan speed of 0.04
cm
-1
/s; all spectra were plotted as the average of three
scans. For live-cell analyses, ~1 × 10
5
HeLa cells were
seeded in imaging dishes with DMEM/FBS and incubated
at 37°C in 90% air and 10% CO
2
. After 24 h, the media
was removed and the HeLa cells were rinsed three times
with sterile PBS. The cells were incubated further in air at
37°C (or 4°C) in 1 mL of either DMEM/FBS (control) or
a freshly prepared DM-SWNT dispersion. Following the
designated DM-SWNT incubation period (12–60 h), the
cells were copiously rinsed at least three times with sterile
PBS. After excess PBS was removed from the dish, 1 mL of
fresh media was added and the dish was placed on the
microscope stage for analysis at room temperature. Adher-
ent cells were brought into focus by viewing transmitted
white-light images obtained through a CCD video cam-
era. The Raman acquisition time for a 250 cm
-1
spectral
region was 45 s with a scan speed of 0.18 cm
-1
/s; all spec-
tra were plotted as the average of three scans.
Transmission electron microscopy
Live cells were incubated in a DM-SWNT dispersion (or a
DMEM/FBS control) for 60 h as described above. After the
final PBS rinsing, the cells were fixed using 2.5% glutaral-
dehyde in 0.1 M cacodylate buffer and embedded in aga-
rose. Cell pellets were cut into small pieces, post-fixed
with 1% osmium tetroxide, en-bloc stained with 1% ura-
nyl acetate, dehydrated in a graded ethanol series, and
embedded in EMbed-812 resin. Ultrathin (~100 nm) sec-
tions were cut on a LEICA EM UC6 ultramicrotome, post-
stained with uranyl acetate and lead citrate, and viewed
using the JEOL JEM-1200EX II electron microscope at the
Molecular and Cellular Imaging Facility at The University
of Texas Southwestern Medical Center.
Flow cytometry
In all flow cytometry experiments, ~1.0 × 10
6
HeLa cells
were seeded in imaging dishes with DMEM/FBS and incu-
bated at 37°C in 90% air and 10% CO
2
. After 24 h, the
media was removed, the cells were rinsed with sterile PBS,
and the cells were incubated in fresh DMEM/FBS (con-
trol) or a DM-SWNT dispersion in air at 37°C for 60 h. In
some cases, cells were rinsed at least three times with ster-
ile PBS and loaded with a solution of MitoSOX™ Red (Inv-
itrogen-Molecular Probes). Specifically, cells were
incubated for 60 min at 37°C in a 10 µM MitoSOX™ Red
solution prepared in 4:1 (v/v) DMEM/PBS. Next, cells
were rinsed three times with PBS, harvested with 500 µL
of trypsin-EDTA solution, centrifuged at 5000 RPM for 5
min, and resuspended in 3 mL of fresh 2% (v/v) FBS/PBS.
Finally, cell suspensions were filtered through a 30-µm
PreSeparation filter (Miltenyi Biotec). Fluorescence-based
flow cytometry was performed using a Becton Dickinson
FACSCalibur
®
flow cytometer equipped with a 488 nm
laser. MitoSOX™ Red fluorescence (λ
Max
= 590 nm) was
detected over the range of 564–606 nm and the back-
ground fluorescence was detected over the range of 515–
545 nm. All quantitations were performed using Cel-
lQuest 7.5.3 software; in each experiment, well over
10,000 cells were analyzed.
Competing interests
The author(s) declare that they have no competing inter-
ests.
Authors' contributions
HNY performed the majority of the experiments and
wrote the manuscript with PP. GRD, RKD, IHM, and PP
designed the overall project and aided with data interpre-
tations. CM ran the culturing facility and assisted with the
Journal of Nanobiotechnology 2007, 5:8 />Page 14 of 17
(page number not for citation purposes)
interpretation of live cell data. EKW performed and inter-
preted the thermal gravimetric analyses. PB performed
and interpreted the scanning probe analyses. MCD per-
formed and interpreted the elemental analyses.
Additional material
Acknowledgements
This work was supported by grants from the Robert A. Welch Foundation
(PP; grant AT-1364 and IHM; grant AT-1326) and the Human Frontier Sci-
ence Program (GRD; grant RGY0070/2005-C), by the gift of equipment
from the von Ehr Foundation, and by funds from the State of Texas (RKD).
We are grateful for assistance to this work by Chris Gilpin, Karis Hughes,
Laurie Mueller, and Vicky Poenitzsch, and for insightful discussions with Ray
Baughman, Alan Dalton, Radu Marches, and Ru-Hung Wang.
References
1. Klumpp C, Kostarelos K, Prato M, Bianco A: Functionalized car-
bon nanotubes as emerging nanovectors for the delivery of
therapeutics. Biochimica et Biophysica Acta, Biomembranes 2006,
1758:404-412.
2. Ferrari M: Nanovector therapeutics. Current Opinion in Chemical
Biology 2005, 9:343-346.
3. Ferrari M: Cancer nanotechnology: opportunities and chal-
lenges. Nature Reviews Cancer 2005, 5:161-171.
4. Penn SG, He L, Natan MJ: Nanoparticles for bioanalysis. Current
Opinion in Chemical Biology 2003, 7:609-615.
5. Portney NG, Ozkan M: Nano-oncology: drug delivery, imaging,
and sensing. Analytical and Bioanalytical Chemistry 2006,
384:620-630.
6. Martin CR, Kohli P: The emerging field of nanotube biotechnol-
ogy. Nature Reviews Drug Discovery 2003, 2:29-37.
7. Heller DA, Jeng ES, Yeung TK, Martinez BM, Moll AE, Gastala JB,
Strano MS: Optical Detection of DNA Conformational Poly-
morphism on Single-Walled Carbon Nanotubes. Science
(Washington, DC, United States) 2006, 311:508-511.
8. Barone PW, Baik S, Heller DA, Strano MS: Near-infrared optical
sensors based on single-walled carbon nanotubes. Nature
Materials 2005, 4:86-92.
9. Heller DA, Baik S, Eurell TE, Strano MS: Single-walled carbon nan-
otube spectroscopy in live cells: Towards long-term labels
and optical sensors. Advanced Materials (Weinheim, Germany) 2005,
17:2793-2799.
10. Kam NWS, O'Connell M, Wisdom JA, Dai H: Carbon Nanotubes
as multifunctional biological transporters and near-infrared
agents for selective cancer cell destruction. Proceedings of the
National Academies of Science 2005, 102:11600-11605.
11. Lin Y, Zhou B, Martin RB, Henbest KB, Harruff BA, Riggs JE, Guo ZX,
Allard LF, Sun YP: Visible Luminescence of Carbon Nanotubes
and Dependence on Functionalization. Journal of Physical Chem-
istry B 2005, 109:14779-14782.
12. Kam NWS, Dai H: Carbon Nanotubes as Intracellular Protein
Transporters: Generality and Biological Functionality. Journal
of the American Chemical Society 2005, 127:6021-6026.
13. Kam NWS, Jessop TC, Wender PA, Dai H: Nanotube molecular
transporters: internalization of carbon nanotube-protein
conjugates into mammalian cells. Journal of the American Chemi-
cal Society 2004, 126:6850-6851.
14. Pantarotto D, Briand JP, Prato M, Bianco A: Translocation of bio-
active peptides across cell membranes by carbon nanotubes.
Chemical Communications (Cambridge, United Kingdom) 2004:16-17.
15. Pantarotto D, Singh R, McCarthy D, Erhardt M, Briand JP, Prato M,
Kostarelos K, Bianco A: Functionalized carbon nanotubes for
plasmid DNA gene delivery. Angewandte Chemie, International Edi-
tion 2004, 43:5242-5246.
16. Wu W, Wieckowski S, Pastorin G, Benincasa M, Klumpp C, Briand JP,
Gennaro R, Prato M, Bianco A: Targeted delivery of amphoter-
icin B to cells by using functionalized carbon nanotubes.
Angewandte Chemie, International Edition 2005, 44:6358-6362.
17. Cai D, Mataraza JM, Qin ZH, Huang Z, Huang J, Chiles TC, Carnahan
D, Kempa K, Ren Z: Highly efficient molecular delivery into
mammalian cells using carbon nanotube spearing. Nature
Methods 2005, 2:449-454.
18. Lu Q, Moore JM, Huang G, Mount AS, Rao AM, Larcom LL, Ke PC:
RNA polymer translocation with single-walled carbon nano-
tubes. Nano Letters 2004, 4:2473-2477.
19. Chin SF, Baughman Ray H, Dalton Alan B, Dieckmann Gregg R,
Draper Rockford K, Mikoryak C, Musselman Inga H, Poenitzsch VZ,
Xie H, Pantano P: Amphiphilic helical peptide enhances the
uptake of single-walled carbon nanotubes by living cells. Exp
Biol Med (Maywood) 2007, 232(9):1236-1244.
20. Tasis D, Tagmatarchis N, Bianco A, Prato M: Chemistry of carbon
nanotubes. Chemical Reviews 2006, 106:1105-1136.
21. Lin Y, Taylor S, Li H, Fernando KAS, Qu L, Wang W, Gu L, Zhou B,
Sun YP: Advances toward bioapplications of carbon nano-
tubes. Journal of Materials Chemistry 2004, 14:527-541.
22. Bahr JL, Tour JM: Covalent chemistry of single-wall carbon
nanotubes. Journal of Materials Chemistry 2002, 12:1952-1958.
23. Banerjee S, Hemraj-Benny T, Wong SS: Covalent surface chemis-
try of single-walled carbon nanotubes. Advanced Materials
(Weinheim, Germany) 2005, 17:17-29.
24. Tasis D, Tagmatarchis N, Georgakilas V, Prato M: Soluble carbon
nanotubes. Chem Eur J 2003, 9:4000-4008.
25. Sun YP, Fu K, Lin Y, Huang W: Functionalized carbon nanotubes:
properties and applications. Accounts of Chemical Research 2002,
35:1096-1104.
26. Niyogi S, Hamon MA, Hu H, Zhao B, Bhowmik P, Sen R, Itkis ME,
Haddon RC: Chemistry of Single-Walled Carbon Nanotubes.
Accounts of Chemical Research 2002, 35:1105-1113.
27. Chou SG, Plentz F, Jiang J, Saito R, Nezich D, Ribeiro HB, Jorio A,
Pimenta MA, Samsonidze GG, Santos AP, Zheng M, Onoa GB, Semke
ED, Dresselhaus G, Dresselhaus MS: Phonon-Assisted Excitonic
Recombination Channels Observed in DNA-Wrapped Car-
bon Nanotubes Using Photoluminescence Spectroscopy.
Physical Review Letters 2005, 94:127402/1-127402/4.
28. Singh R, Pantarotto D, McCarthy D, Chaloin O, Hoebeke J, Partidos
CD, Briand JP, Prato M, Bianco A, Kostarelos K: Binding and Con-
densation of Plasmid DNA onto Functionalized Carbon Nan-
otubes: Toward the Construction of Nanotube-Based Gene
Additional file 1
Supporting thermal gravimetric analysis data. Estimation of SWNT con-
centrations in DM-SWNT dispersions.
Click here for file
[ />3155-5-8-S1.doc]
Additional file 2
Supporting atomic force microscopy data. Atomic force microscopy of
SWNT dispersions.
Click here for file
[ />3155-5-8-S2.doc]
Additional file 3
Supporting Raman spectroscopy data. Raman spectrometer reproducibility
and calibration.
Click here for file
[ />3155-5-8-S3.doc]
Additional file 4
Supporting flow cytometry data. Event plots.
Click here for file
[ />3155-5-8-S4.doc]
Journal of Nanobiotechnology 2007, 5:8 />Page 15 of 17
(page number not for citation purposes)
Delivery Vectors. Journal of the American Chemical Society 2005,
127:4388-4396.
29. Badaire S, Zakri C, Maugey M, Derre A, Barisci JN, Wallace G, Poulin
P: Liquid crystals of DNA-stabilized carbon nanotubes.
Advanced Materials (Weinheim, Germany) 2005, 17:1673-1676.
30. Lustig SR, Jagota A, Khripin C, Zheng M: Theory of structure-
based carbon nanotube separations by ion-exchange chro-
matography of DNA/CNT hybrids. Journal of Physical Chemistry B
2005, 109:2559-2566.
31. Strano MS, Zheng M, Jagota A, Onoa GB, Heller DA, Barone PW,
Usrey ML: Understanding the nature of the DNA-assisted sep-
aration of single-walled carbon nanotubes using fluorescence
and Raman spectroscopy. Nano Letters 2004, 4:543-550.
32. Zheng M, Jagota A, Strano MS, Santos AP, Barone P, Chou SG, Diner
BA, Dresselhaus MS, McLean RS, Onoa GB, Samsonidze GG, Semke
ED, Usrey M, Walls DJ: Structure-Based Carbon Nanotube
Sorting by Sequence-Dependent DNA Assembly. Science
(Washington, DC, United States) 2003, 302:1545-1548.
33. Zheng M, Jagota A, Semke ED, Diner BA, McLean RS, Lustig SR, Rich-
ardson RE, Tassi NG: DNA-assisted dispersion and separation
of carbon nanotubes. Nature Materials 2003, 2:338-342.
34. He P, Bayachou M: Layer-by-Layer Fabrication and Character-
ization of DNA-Wrapped Single-Walled Carbon Nanotube
Particles. Langmuir 2005, 21:6086-6092.
35. Li S, He P, Dong J, Guo Z, Dai L: DNA-Directed Self-Assembling
of Carbon Nanotubes. Journal of the American Chemical Society
2005, 127:14-15.
36. Tan S, Lopez HA, Cai CW, Zhang Y: Optical Trapping of Single-
Walled Carbon Nanotubes. Nano Letters 2004, 4:1415-1419.
37. Bianco A, Kostarelos K, Prato M: Applications of carbon nano-
tubes in drug delivery. Current Opinion in Chemical Biology 2005,
9:674-679.
38. Kam NWS, Liu Z, Dai H: Functionalization of Carbon Nano-
tubes via Cleavable Disulfide Bonds for Efficient Intracellular
Delivery of siRNA and Potent Gene Silencing. Journal of the
American Chemical Society 2005, 127:12492-12493.
39. Rao R, Lee J, Lu Q, Keskar G, Freedman KO, Floyd WC, Rao AM, Ke
PC: Single-molecule fluorescence microscopy and Raman
spectroscopy studies of RNA bound carbon nanotubes.
Applied Physics Letters 2004, 85:4228-4230.
40. Arnold MS, Stupp SI, Hersam MC: Enrichment of single-walled
carbon nanotubes by diameter in density gradients. Nano Let-
ters 2005, 5:713-718.
41. Arnold MS, Guler MO, Hersam MC, Stupp SI: Encapsulation of
Carbon Nanotubes by Self-Assembling Peptide
Amphiphiles. Langmuir 2005, 21:4705-4709.
42. Pantarotto D, Partidos CD, Graff R, Hoebeke J, Briand JP, Prato M,
Bianco A: Synthesis, Structural Characterization, and Immu-
nological Properties of Carbon Nanotubes Functionalized
with Peptides. J Am Chem Soc 2003, 125:6160-6164.
43. Bianco A, Kostarelos K, Partidos CD, Prato M: Biomedical appli-
cations of functionalized carbon nanotubes. Chemical Commu-
nications (Cambridge, United Kingdom) 2005:571-577.
44. Wang S, Humphreys ES, Chung SY, Delduco DF, Lustig SR, Wang H,
Parker KN, Rizzo NW, Subramoney S, Chiang YM, Jagota A: Pep-
tides with selective affinity for carbon nanotubes. Nature
Materials 2003, 2:196-200.
45. Dieckmann GR, Dalton AB, Johnson PA, Razal J, Chen J, Giordano
GM, Munoz E, Musselman IH, Baughman RH, Draper RK: Control-
led Assembly of Carbon Nanotubes by Designed
Amphiphilic Peptide Helices. Journal of the American Chemical
Society 2003, 125:1770-1777.
46. Zorbas V, Ortiz-Acevedo A, Dalton AB, Yoshida MM, Dieckmann
GR, Draper RK, Baughman RH, Jose-Yacaman M, Musselman IH:
Preparation and Characterization of Individual Peptide-
Wrapped Single-Walled Carbon Nanotubes. Journal of the
American Chemical Society 2004, 126:7222-7227.
47. Dalton AB, Ortiz-Acevedo A, Zorbas V, Brunner E, Sampson WM,
Collins S, Razal JM, Yoshida MM, Baughman RH, Draper RK, Mussel-
man IH, Jose-Yacaman M, Dieckmann GR: Hierarchical self-
assembly of peptide-coated carbon nanotubes. Advanced Func-
tional Materials 2004, 14:1147-1151.
48. Ortiz-Acevedo A, Dieckmann GR: Synthesis of reversible cyclic
peptides. Tetrahedron Letters 2004, 45:6795-6798.
49. Xie H, Ortiz-Acevedo A, Zorbas V, Baughman RH, Draper RK, Mus-
selman IH, Dalton AB, Dieckmann GR: Peptide cross-linking mod-
ulated stability and assembly of peptide-wrapped single-
walled carbon nanotubes. Journal of Materials Chemistry 2005,
15:1734-1741.
50. Zorbas V, Smith AL, Xie H, Ortiz-Acevedo A, Dalton AB, Dieckmann
GR, Draper RK, Baughman RH, Musselman IH: Importance of aro-
matic content for peptide/single-walled carbon nanotube
interactions. J Am Chem Soc 2005, 127:12323-12328.
51. Ortiz-Acevedo A, Xie H, Zorbas V, Sampson WM, Dalton AB, Baugh-
man RH, Draper RK, Musselman IH, Dieckmann GR: Diameter-
Selective Solubilization of Single-Walled Carbon Nanotubes
by Reversible Cyclic Peptides. Journal of the American Chemical
Society 2005, 127:9512-9517.
52. In het Panhuis M, Gowrisanker S, Vanesko DJ, Mire CA, Jia H, Xie H,
Baughman RH, Musselman IH, Gnade BE, Dieckmann GR, Draper RK:
Nanotube network transistors from peptide-wrapped single-
walled carbon nanotubes. Small 2005, 1:820-823.
53. Karajanagi SS, Yang H, Asuri P, Sellitto E, Dordick JS, Kane RS: Pro-
tein-Assisted Solubilization of Single-Walled Carbon Nano-
tubes. Langmuir 2006, 22:1392-1395.
54. Chen RJ, Bangsaruntip S, Drouvalakis KA, Kam NWS, Shim M, Li Y,
Kim W, Utz PJ, Dai H: Noncovalent functionalization of carbon
nanotubes for highly specific electronic biosensors. Proceed-
ings of the National Academy of Sciences of the United States of America
2003, 100:4984-4989.
55. Balavoine F, Schultz P, Richard C, Mallouh V, Ebbesen TW,
Mioskowski C: Helical crystallization of proteins on carbon
nanotubes: a first step towards the development of new bio-
sensors. Angewandte Chemie, International Edition 1999,
38:1912-1915.
56. Chen RJ, Zhang Y, Wang D, Dai H: Noncovalent sidewall func-
tionalization of single-walled carbon nanotubes for protein
immobilization. Journal of the American Chemical Society 2001,
123:3838-3839.
57. Azamian Bobak R, Davis Jason J, Coleman Karl S, Bagshaw Claire B,
Green Malcolm LH: Bioelectrochemical single-walled carbon
nanotubes. Journal of the American Chemical Society 2002,
124:12664-12665.
58. Lin Y, Allard LF, Sun YP: Protein-Affinity of Single-Walled Car-
bon Nanotubes in Water. Journal of Physical Chemistry B 2004,
108:3760-3764.
59. Shim M, Kam NWS, Chen RJ, Li Y, Dai H: Functionalization of car-
bon nanotubes for biocompatibility and biomolecular recog-
nition. Nano Letters 2002, 2:285-288.
60. Elkin T, Jiang X, Taylor S, Lin Y, Gu L, Yang H, Brown J, Collins S, Sun
YP: Immuno-carbon nanotubes and recognition of patho-
gens. ChemBioChem 2005, 6:640-643.
61. Fu K, Huang W, Lin Y, Zhang D, Hanks TW, Rao AM, Sun YP: Func-
tionalization of carbon nanotubes with bovine serum albu-
min in homogeneous aqueous solution. Journal of Nanoscience
and Nanotechnology 2002, 2:457-461.
62. Huang W, Taylor S, Fu K, Lin Y, Zhang D, Hanks TW, Rao AM, Sun
YP: Attaching proteins to carbon nanotubes via diimide-acti-
vated amidation. Nano Letters 2002, 2:311-314.
63. Lu Q, Freedman KO, Rao R, Huang G, Lee J, Larcom LL, Rao AM, Ke
PC: Diffusion of carbon nanotubes with single-molecule fluo-
rescence microscopy. Journal of Applied Physics 2004,
96:6772-6775.
64. Jiang K, Schadler LS, Siegel RW, Zhang X, Zhang H, Terrones M: Pro-
tein immobilization on carbon nanotubes via a two-step
process of diimide-activated amidation. Journal of Materials
Chemistry 2004, 14:37-39.
65. Worle-Knirsch JM, Pulskamp K, Krug HF: Oops they did it again!
Carbon nanotubes hoax scientists in viability assays. Nano let-
ters 2006, 6:1261-1268.
66. Kagan VE, Tyurina YY, Tyurin VA, Konduru NV, Potapovich AI, Osi-
pov AN, Kisin ER, Schwegler-Berry D, Mercer R, Castranova V, Shve-
dova AA: Direct and indirect effects of single walled carbon
nanotubes on RAW 264.7 macrophages: Role of iron. Toxicol-
ogy Letters 2006, 165:88-100.
67. Garibaldi S, Brunelli C, Bavastrello V, Ghigliotto G, Nicolini C: Car-
bon nanotube biocompatibility with cardiac muscle cells.
Nanotechnology 2006, 17:391-397.
68. Monteiro-Riviere NA, Nemanich RJ, Inman AO, Wang YY, Riviere JE:
Multi-walled carbon nanotube interactions with human epi-
dermal keratinocytes. Toxicology Letters 2005, 155:377-384.
Journal of Nanobiotechnology 2007, 5:8 />Page 16 of 17
(page number not for citation purposes)
69. Jia G, Wang H, Yan L, Wang X, Pei R, Yan T, Zhao Y, Guo X: Cyto-
toxicity of Carbon Nanomaterials: Single-Wall Nanotube,
Multi-Wall Nanotube, and Fullerene. Environmental Science and
Technology 2005, 39:1378-1383.
70. Shvedova A, Castranova V, Kisin E, Schwegler-Berry D, Murray A,
Gandelsman V, Maynard A, Baron P: Exposure to Carbon Nano-
tube Material: Assessment of Nanotube Cytotoxicity using
Human Keratinocyte Cells. J Toxicology and Environmental Health,
Part A 2003, 66:1909-1926.
71. Flahaut E, Durrieu MC, Remy-Zolghadri M, Bareille R, Baquey C:
Investigation of the cytotoxicity of CCVD carbon nanotubes
towards human umbilical vein endothelial cells. Carbon 2006,
44:1093-1099.
72. Magrez A, Kasas S, Salicio V, Pasquier N, Seo JW, Celio M, Catsicas S,
Schwaller B, Forro L: Cellular Toxicity of Carbon-Based Nano-
materials. Nano Letters 2006, 6:1121-1125.
73. Oberdorster G, Maynard A, Donaldson K, Castranova V, Fitzpatrick
J, Ausman K, Carter J, Karn B, Kreyling W, Lai D, Olin S, Monteiro-
Riviere N, Warheit D, Yang H: Principles for characterizing the
potential human health effects from exposure to nanomate-
rials: Elements of a screening strategy. Particle and Fibre Toxicol-
ogy 2005, 2:8-43.
74. Nel A, Xia T, Madler L, Li N: Toxic potential of materials at the
nanolevel. Science 2006, 311:622-627.
75. Lam CW, James JT, McCluskey R, Arepalli S, Hunter RL: A Review
of Carbon Nanotube Toxicity and Assessment of Potential
Occupational and Environmental Health Risks. Critical Reviews
in Toxicology 2006, 36:189-217.
76. Monteiro-Riviere NA, Inman AO: Challenges for assessing car-
bon nanomaterial toxicity to the skin. Carbon 2006,
44:1070-1078.
77. Panessa-Warren BJ, Warren JB, Wong SS, Misewich JA: Biological
cellular response to carbon nanoparticle toxicity. Journal of
Physics: Condensed Matter 2006, 18:S2185-S2201.
78. Smart SK, Cassady AI, Lu GQ, Martin DJ: The biocompatibility of
carbon nanotubes. Carbon 2006, 44:1034-1047.
79. Oberdorster G, Oberdorster E, Oberdorster J: Nanotoxicology:
an emerging discipline evolving from studies of ultrafine par-
ticles. Environmental Health Perspectives 2005, 113:823-839.
80. Kagan VE, Bayir H, Shvedova AA: Nanomedicine and nanotoxi-
cology: Two sides of the same coin. Nanomedicine 2005,
1:313-316.
81. Cherukuri P, Bachilo SM, Litovsky SH, Weisman RB: Near-infrared
fluorescence microscopy of single-walled carbon nanotubes
in phagocytic cells. Journal of the American Chemical Society 2004,
126:15638-15639.
82. Chen X, Tam UC, Czlapinski JL, Lee GS, Rabuka D, Zettl A, Bertozzi
CR: Interfacing Carbon Nanotubes with Living Cells. Journal
of the American Chemical Society 2006, 128:6292-6293.
83. Koyama S, Endo M, Kim YA, Hayashi T, Yanagisawa T, Osaka K,
Koyama H, Haniu H, Kuroiwa N: Role of systemic T-cells and his-
topathological aspects after subcutaneous implantation of
various carbon nanotubes in mice. Carbon 2006, 44:1079-1092.
84. Zhu Y, Ran T, Li Y, Guo J, Li W: Dependence of the cytotoxicity
of MWCNTs on the culture medium. Nanotechnology 2006,
17:4668-4674.
85. Singh R, Pantarotto D, Lacerda L, Pastorin G, Klumpp C, Prato M,
Bianco A, Kostarelos K: Tissue biodistribution and blood clear-
ance rates of intravenously administered carbon nanotube
radiotracers. Proceedings of the National Academy of Sciences of the
United States of America 2006, 103:3357-3362.
86. Dumortier H, Lacotte S, Pastorin G, Marega R, Wu W, Bonifazi D,
Briand JP, Prato M, Muller S, Bianco A: Functionalized carbon nan-
otubes are non-cytotoxic and preserve the functionality of
primary immune cells. Nano Lett 2006, 6:1522-1528.
87. Hu H, Ni Y, Montana V, Haddon RC, Parpura V: Chemically func-
tionalized carbon nanotubes as substrates for neuronal
growth. Nano Letters 2004, 4:507-511.
88. Cui D, Tian F, Ozkan CS, Wang M, Gao H: Effect of single wall car-
bon nanotubes on human HEK293 cells. Toxicology Letters 2005,
155:73-85.
89. Lam CW, James JT, McCluskey R, Hunter RL: Pulmonary Toxicity
of Single-Wall Carbon Nanotubes in Mice 7 and 90 Days
After Intratracheal Instillation. Toxicolology Sciences 2004,
77:126-134.
90. Warheit DB, Laurence BR, Reed KL, Roach DH, Reynolds GAM,
Webb TR: Comparative Pulmonary Toxicity Assessment of
Single-wall Carbon Nanotubes in Rats. Toxicological Sciences
2004, 77:117-125.
91. Manna SK, Sarkar S, Barr J, Wise K, Barrera EV, Jejelowo O, Rice-
Ficht AC, Ramesh GT: Single-Walled Carbon Nanotube
Induces Oxidative Stress and Activates Nuclear Transcrip-
tion Factor-kB in Human Keratinocytes. Nano Letters 2005,
5:1676-1684.
92. Ding L, Stilwell J, Zhang T, Elboudwarej O, Jiang H, Selegue JP, Cooke
PA, Gray JW, Chen FF: Molecular Characterization of the Cyto-
toxic Mechanism of Multiwall Carbon Nanotubes and Nano-
Onions on Human Skin Fibroblast. Nano Letters 2005,
5:2448-2464.
93. Sayes CM, Liang F, Hudson JL, Mendez J, Guo W, Beach JM, Moore
VC, Doyle CD, West JL, Billups WE, Ausman KD, Colvin VL: Func-
tionalization density dependence of single-walled carbon
nanotubes cytotoxicity in vitro. Toxicology Letters 2006,
161:135-142.
94. Chlopek J, Czajkowska B, Szaraniec B, Frackowiak E, Szostak K,
Beguin F: In vitro studies of carbon nanotubes biocompatibil-
ity. Carbon 2006, 44:1106-1111.
95. Templeton RC, Ferguson PL, Washburn KM, Scrivens WA, Chandler
GT: Life-cycle effects of single-walled carbon nanotubes
(SWNTs) on an estuarine meiobenthic copepod. Environ Sci
Technol 2006, 40(23):7387-7393.
96. Warheit DB: What is currently known about the health risks
related to carbon nanotube exposures? Carbon 2006,
44:1064-1069.
97. Cherukuri P, Gannon CJ, Leeuw TK, Schmidt HK, Smalley RE, Curley
SA, Weisman RB: Mammalian pharmacokinetics of carbon
nanotubes using intrinsic near-infrared fluorescence. Proc
Natl Acad Sci U S A 2006, 103:18882-18886.
98. Liu Z, Cai W, He L, Nakayama N, Chen K, Sun X, Chen X, Dai H: In
vivo biodistribution and highly efficient tumour targeting of
carbon nanotubes in mice. Nat Nano 2007, 2:47-52.
99. Herrera JE, Balzano L, Borgna A, Alvarez WE, Resasco DE: Relation-
ship between the structure/composition of Co-Mo catalysts
and their ability to produce single-walled carbon nanotubes
by CO disproportionation. Journal of Catalysis 2001, 204:129-145.
100. Alvarez WE, Pompeo F, Herrera JE, Balzano L, Resasco DE: Charac-
terization of Single-Walled Carbon Nanotubes (SWNTs)
Produced by CO Disproportionation on Co-Mo Catalysts.
Chemistry of Materials 2002, 14:1853-1858.
101. Herrera JE, Balzano L, Pompeo F, Resasco DE: Raman characteri-
zation of single-walled nanotubes of various diameters
obtained by catalytic disproportionation of CO. Journal of
Nanoscience and Nanotechnology 2003, 3:133-138.
102. Bachilo SM, Balzano L, Herrera JE, Pompeo F, Resasco DE, Weisman
RB: Narrow (n,m)-Distribution of Single-Walled Carbon
Nanotubes Grown Using a Solid Supported Catalyst. Journal
of the American Chemical Society 2003, 125:11186-11187.
103. Lolli G, Zhang L, Balzano L, Sakulchaicharoen N, Tan Y, Resasco DE:
Tailoring (n,m) Structure of Single-Walled Carbon Nano-
tubes by Modifying Reaction Conditions and the Nature of
the Support of CoMo Catalysts. Journal of Physical Chemistry B
2006, 110:2108-2115.
104. SouthWest NanoTechnologies: www.swnano.com/technology.
[ />].
105. Buffa F, Hu H, Resasco DE: Side-Wall Functionalization of Sin-
gle-Walled Carbon Nanotubes with 4-Hydroxymethylaniline
Followed by Polymerization of e-Caprolactone. Macromole-
cules 2005, 38:8258-8263.
106. Attal S, Thiruvengadathan R, Regev O: Determination of the con-
centration of single-walled carbon nanotubes in aqueous dis-
persions using UV-visible absorption spectroscopy. Anal Chem
2006, 78:8098-8104.
107. Dresselhaus MS, Dresselhaus G, Jorio A, Souza Filho AG, Saito R:
Raman spectroscopy on isolated single wall carbon nano-
tubes. Carbon 2002, 40:2043-2061.
108. Resasco DE, Herrera JE: Structural characterization of single-
walled carbon nanotubes. Encyclopedia of Nanoscience and Nanote-
chnology 2004, 10:125-147.
109. Itkis ME, Perea DE, Jung R, Niyogi S, Haddon RC: Comparison of
Analytical Techniques for Purity Evaluation of Single-Walled
Publish with BioMed Central and every
scientist can read your work free of charge
"BioMed Central will be the most significant development for
disseminating the results of biomedical research in our lifetime."
Sir Paul Nurse, Cancer Research UK
Your research papers will be:
available free of charge to the entire biomedical community
peer reviewed and published immediately upon acceptance
cited in PubMed and archived on PubMed Central
yours — you keep the copyright
Submit your manuscript here:
/>BioMedcentral
Journal of Nanobiotechnology 2007, 5:8 />Page 17 of 17
(page number not for citation purposes)
Carbon Nanotubes. Journal of the American Chemical Society 2005,
127:3439-3448.
110. Braydich-Stolle L, Hussain S, Schlager JJ, Hofmann MC: In vitro cyto-
toxicity of nanoparticles in mammalian germline stem cells.
Toxicological Sciences 2005, 88:412-419.
111. Sauvant MP, Pepin D, Bohatier J, Groliere CA, Guillot J: Toxicity
assessment of 16 inorganic environmental pollutants by six
bioassays. Ecotoxicology and Environmental Safety 1997, 37:131-140.
112. Hussain SM, Hess KL, Gearhart JM, Geiss KT, Schlager JJ: In vitro
toxicity of nanoparticles in BRL 3A rat liver cells. Toxicology in
Vitro 2005, 19:975-983.
113. Bianco A: Carbon nanotubes for the delivery of therapeutic
molecules. Expert Opinion on Drug Delivery 2004, 1:57-65.
114. Kostarelos K, Lacerda L, Partidos CD, Prato M, Bianco A: Carbon
nanotube-mediated delivery of peptides and genes to cells:
Translating nanobiotechnology to therapeutics. Journal of
Drug Delivery Science and Technology 2005, 15:41-47.
115. Huang YS, Karashima T, Yamamoto M, Ogura T, Hamaguchi H:
Raman spectroscopic signature of life in a living yeast cell.
Journal of Raman Spectroscopy 2004, 35:525-526.
116. Krafft C, Knetschke T, Funk RHW, Salzer R: Studies on Stress-
Induced Changes at the Subcellular Level by Raman Micro-
spectroscopic Mapping. Analytical Chemistry 2006, 78:4424-4429.
117. Cheng JX, Xie XS: Coherent Anti-Stokes Raman Scattering
Microscopy: Instrumentation, Theory, and Applications.
Journal of Physical Chemistry B 2004, 108:827-840.
118. Chin SF: Synthetic nano-1 peptide increases the uptake of sin-
gle-walled carbon nanotubes by HeLa cells. In Chemistry Rich-
ardson, Ph.D. Thesis, The University of Texas at Dallas; 2005.
119. Yamawaki H, Iwai N: Cytotoxicity of water-soluble fullerene in
vascular endothelial cells. American Journal of Physiology 2006,
290:C1495-C1502.
120. Martin BM: Tissue Culture Techniques. Boston, Birkhauser Bos-
ton; 1994:63-66.
121. Long TC, Saleh N, Tilton RD, Lowry GV, Veronesi B: Titanium
Dioxide (P25) Produces Reactive Oxygen Species in Immor-
talized Brain Microglia (BV2): Implications for Nanoparticle
Neurotoxicity. Environmental Science & Technology 2006,
40:4346-4352.
122. Xia T, Kovochich M, Brant J, Hotze M, Sempf J, Oberley T, Sioutas C,
Yeh JI, Wiesner MR, Nel AE: Comparison of the Abilities of
Ambient and Manufactured Nanoparticles To Induce Cellu-
lar Toxicity According to an Oxidative Stress Paradigm.
Nano Letters 2006, 6:1794-1807.
123. Julian D, April KL, Patel S, Stein JR, Wohlgemuth SE: Mitochondrial
depolarization following hydrogen sulfide exposure in eryth-
rocytes from a sulfide-tolerant marine invertebrate. Journal of
Experimental Biology 2005, 208:4109-4122.